📊 GBP/CAD — SETUP BREAKDOWN

What's Happening on This Chart?

This is the (GBP/CAD) on the 1-hour timeframe. Price had a massive rally, shooting up to the 1.8680–1.8700 area. After that, sellers took over completely and pushed price all the way back down, that's the big drop you see on the right side of the chart.

G
@godswillfx - 3 hours ago

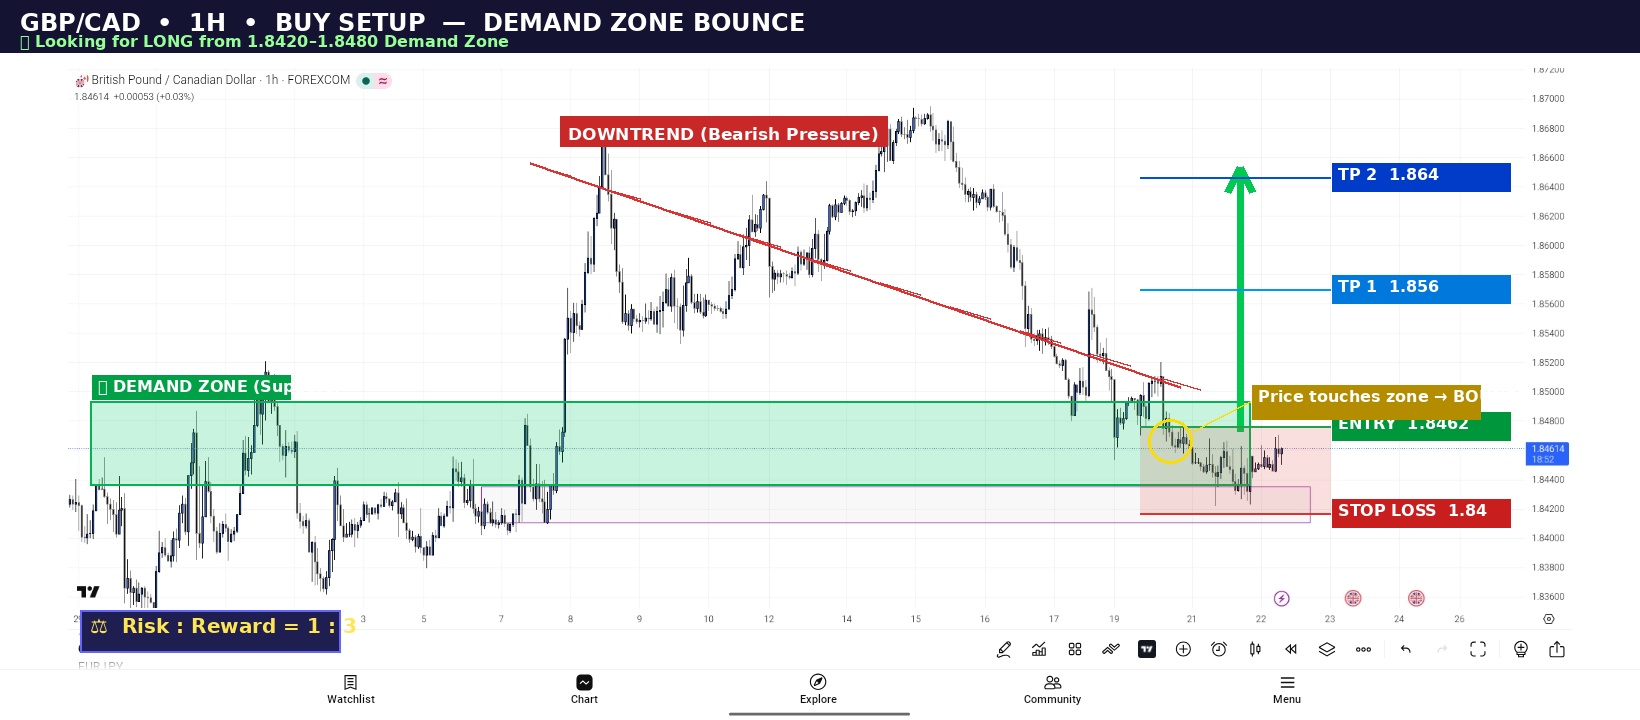
The Demand Zone (The Green Box)

A Demand Zone is simply an area on the chart where buyers have historically stepped in and pushed price UP.

Think of it like a sale at a store, when something drops to a certain price, people rush to buy it.

The pink/purple box already drawn on the chart sits between 1.8420 – 1.8480, and price has now dropped right back into that same zone. This is significant because:

- Price respected this zone multiple times going back to late March / early April

- It's a proven area where buyers like to enter

- Price is currently sitting right at 1.84614,exactly inside the zone

G
@godswillfx - 2 hours ago

Why I'm Looking to BUY

Three reasons this is a valid BUY setup:

1. Demand Zone Support: Price has returned to a key level that held before. Buyers are expected to defend this area again.

2. Oversold Drop: Price fell a long way from the highs (~1.8700 down to ~1.8420). Big moves like this often get a relief bounce before continuing.

3. Price Action Reaction: Looking at the most recent candles, you can see price dipped into the zone and is already starting to push back up, that's buyers defending their territory in real time.