BTC LIVE TRADE
Why I Took This SELL Trade on BTC/USD 🔽
Here's the breakdown from top to bottom, pay attention:
Starting from the bigger picture:
The Weekly chart showed a strong resistance level. Price hit it and got rejected, meaning big players didn't want price going higher at that zone.
That rejection pushed down to the Daily chart, which then also hit its own resistance level and rejected. This told me the Daily was now confirming the Weekly's message, sellers are in control.
Drilling down:
That Daily rejection triggered a 4-Hour breakout to the downside. Within that 4-hour move, a CRT candle formed, this is a candle that traps buyers before reversing sharply. Classic manipulation.
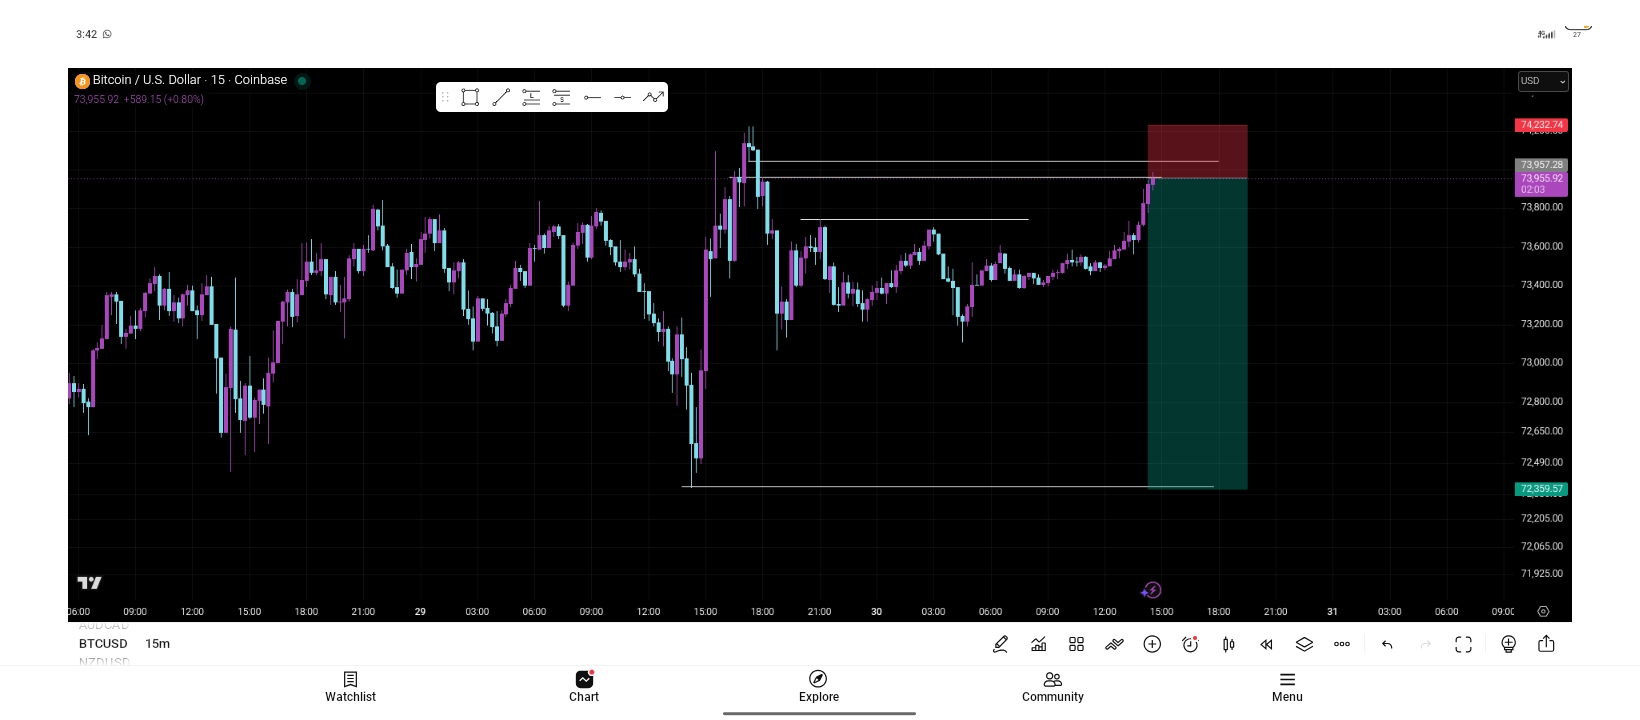
The entry (15-minute chart):
I dropped to the 15-minute timeframe and looked for confirmation. I found three things:
- ✅ Market Structure Shift (MSS), price broke below a recent low, confirming sellers took over
- ✅ Liquidity— buy stops were swept above a key level, fueling the sell move
- ✅ QMR Key Level — a high-probability price zone aligned perfectly
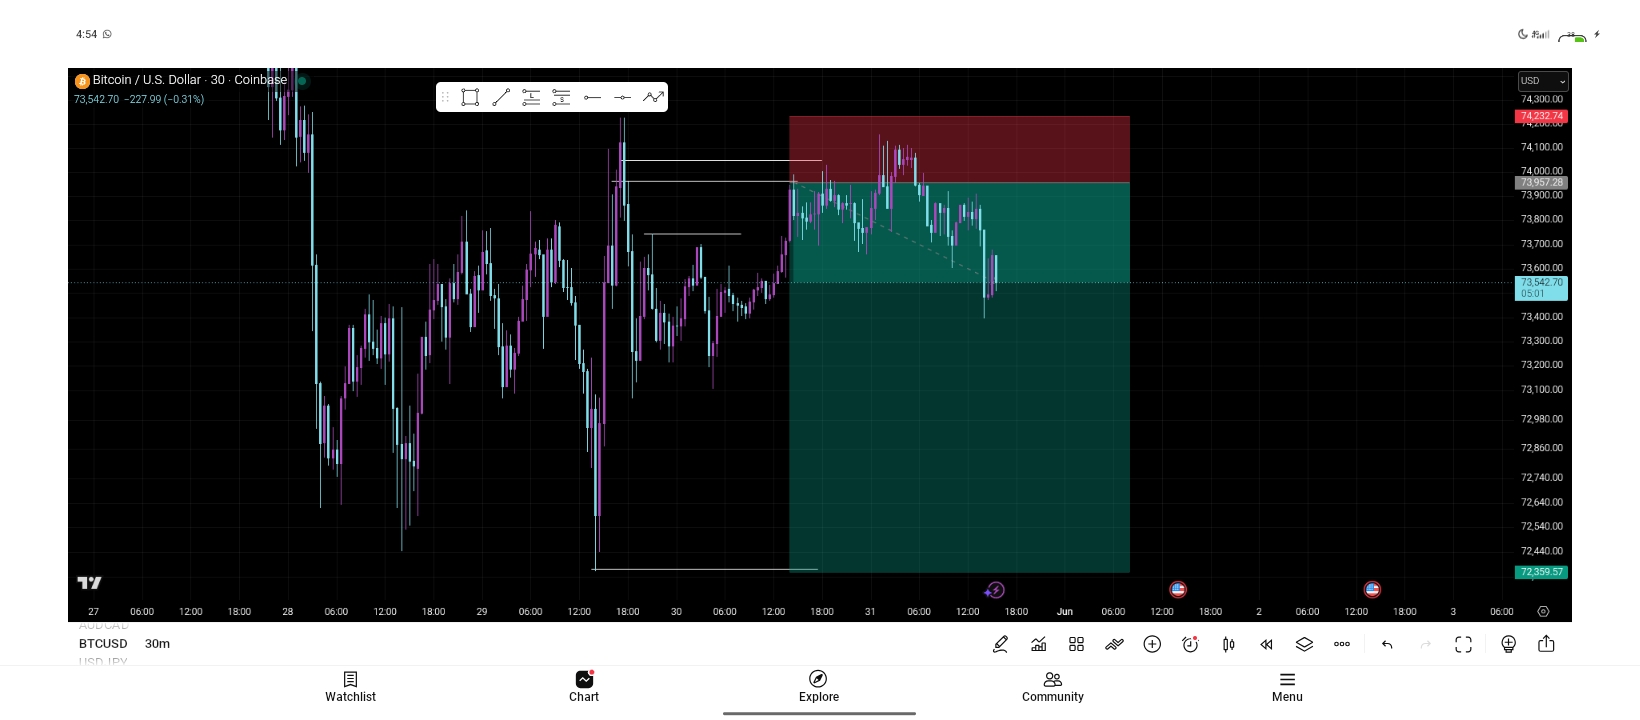
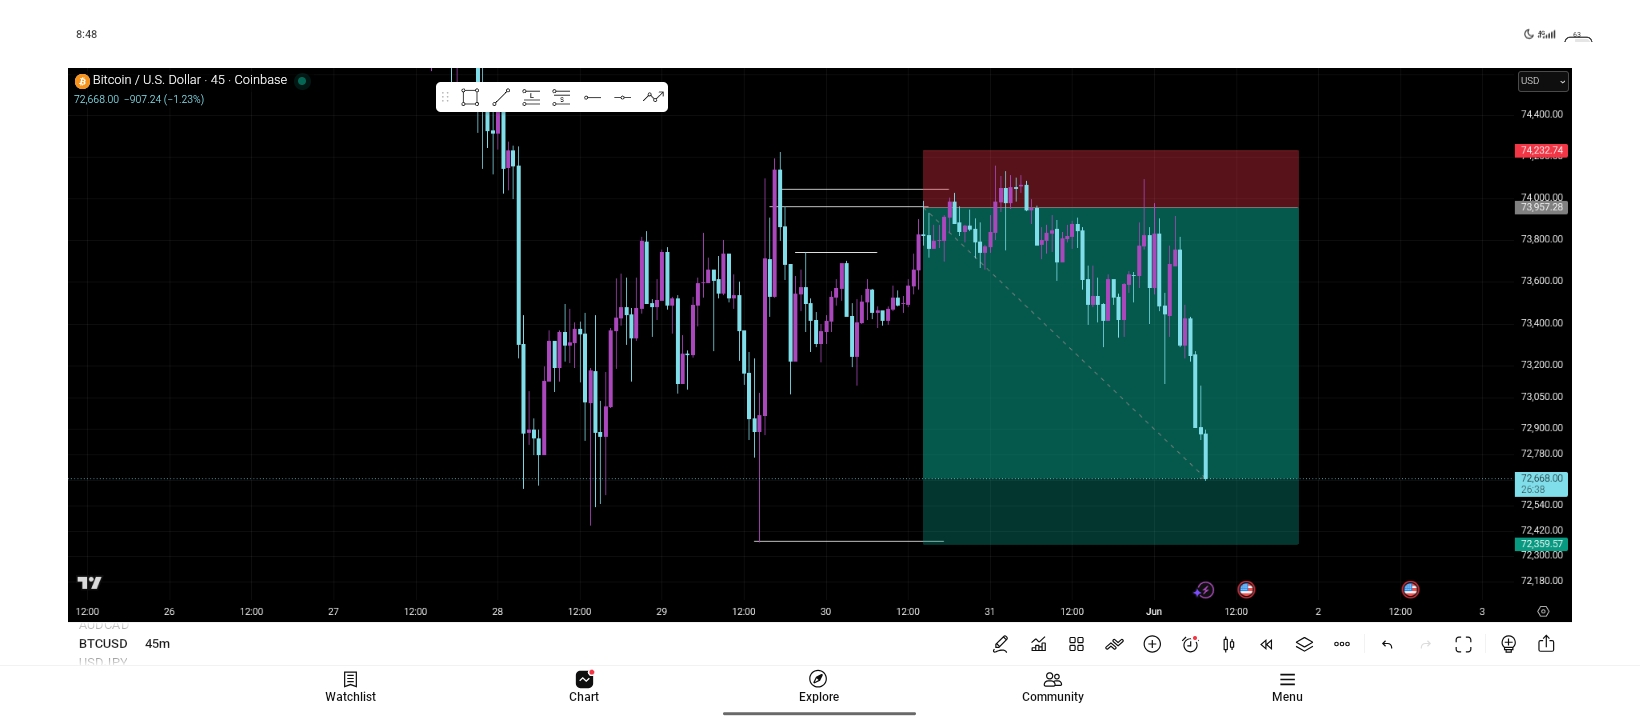
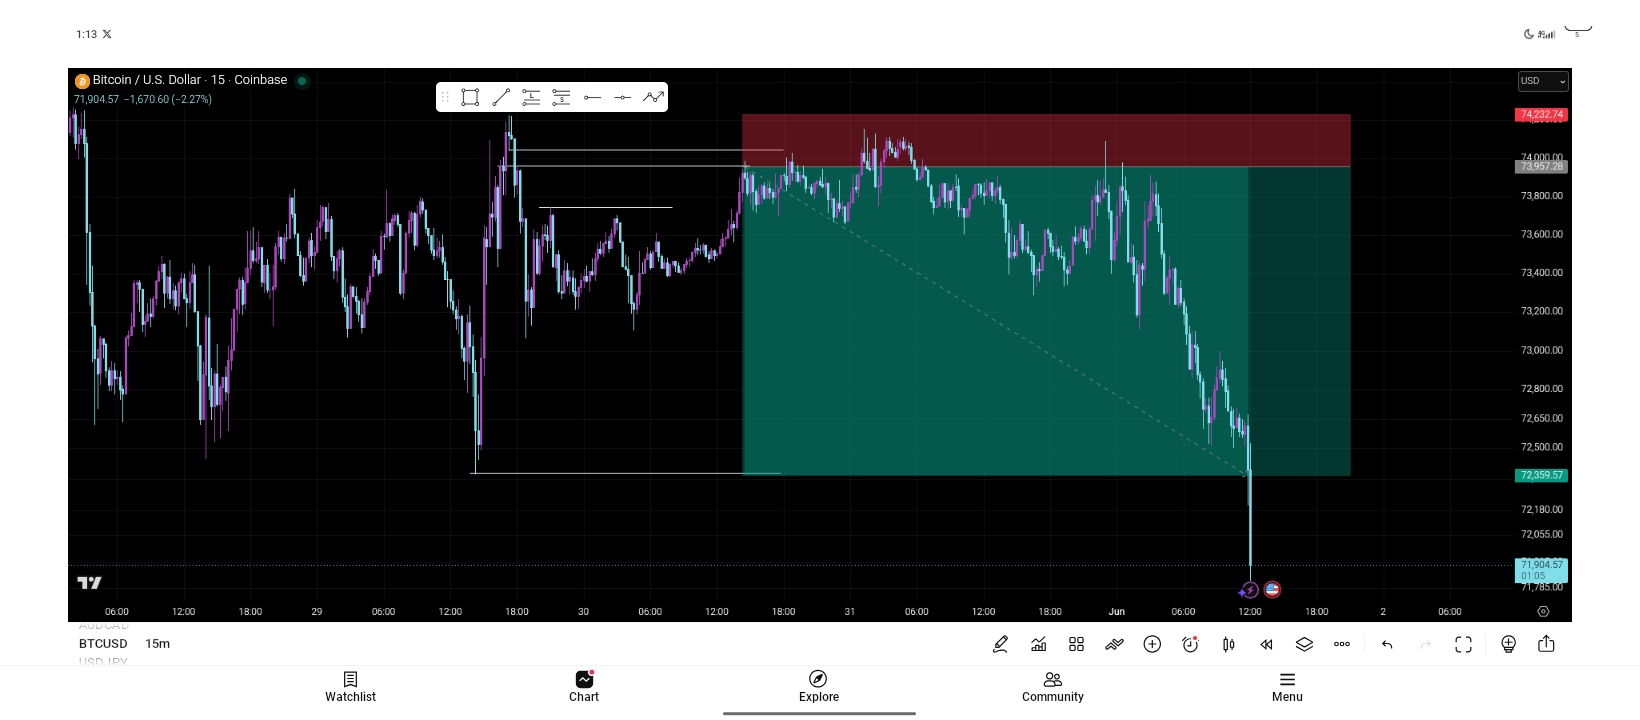
All three lined up. I entered my sells.