How do you read open, high, low, close (OHLC) on any timeframe?
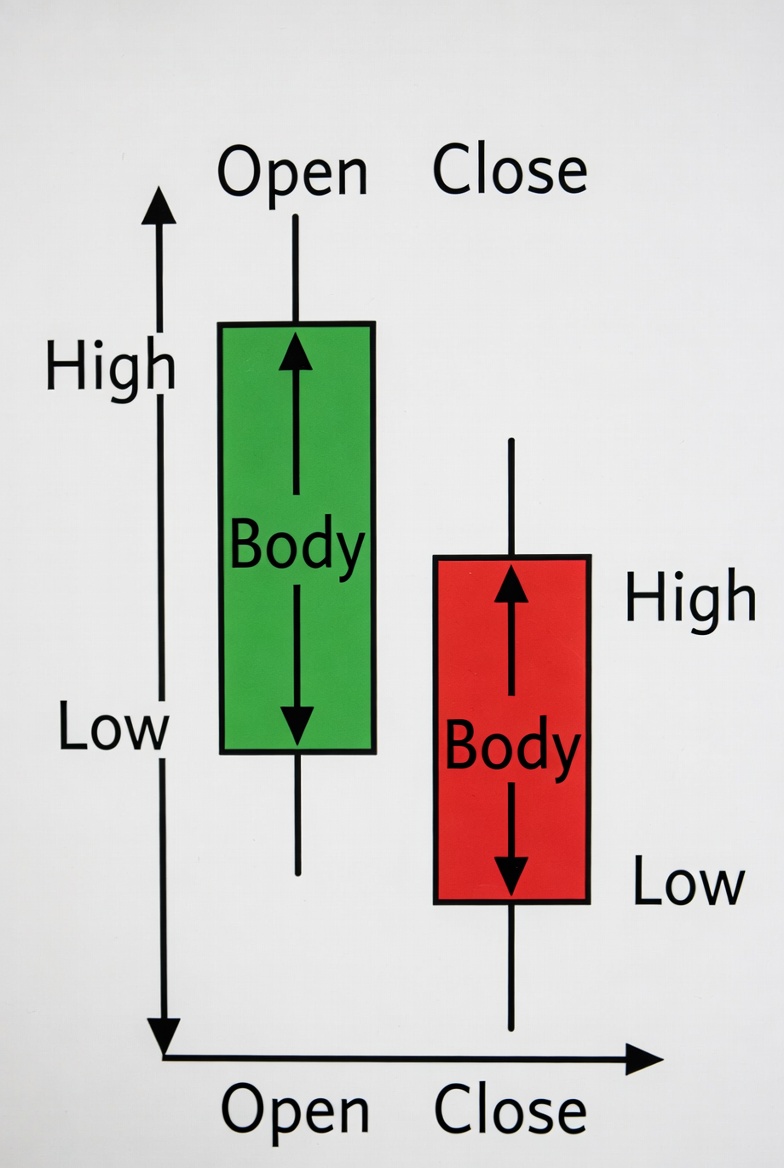
- Open: Price when the candle/bar starts (at the beginning of the timeframe).
- High: Highest price reached during that period.
- Low: Lowest price reached during that period.
- Close: Price when the candle/bar ends (at the end of the timeframe).
- 1-minute candle = OHLC of 1 minute.
- 15-minute candle = OHLC of 15 minutes.
- 1-hour candle = OHLC of 1 hour.
- Daily candle= OHLC of the full day.
The body of the candle shows Open to Close.
The wicks/shadows show the High and Low.
Key Point: Every candle tells you the full battle between buyers and sellers in that exact timeframe. That's it. Use this to understand price action on any chart.
The body of the candle shows Open to Close.
The wicks/shadows show the High and Low.
Key Point: Every candle tells you the full battle between buyers and sellers in that exact timeframe. That's it. Use this to understand price action on any chart.
You can also change the color of the candles they must not be red and green
You can also change the color of the candles they must not be red and green
Okay boss
Noted