JP225 (NIKKEI) Market Analysis and Trade Setups

The Nikkei 225 Stock Index (also called JP225) is a price-weighted average of 225 top-rated Japanese companies from a wide array of industry sectors.
This thread is for discussions about this Asset, Market Analysis and Trade Setups.

N
@nsg_usd - 5 hours ago

JP225 Market Analysis
Trend: Bullish
Bias: Bullish
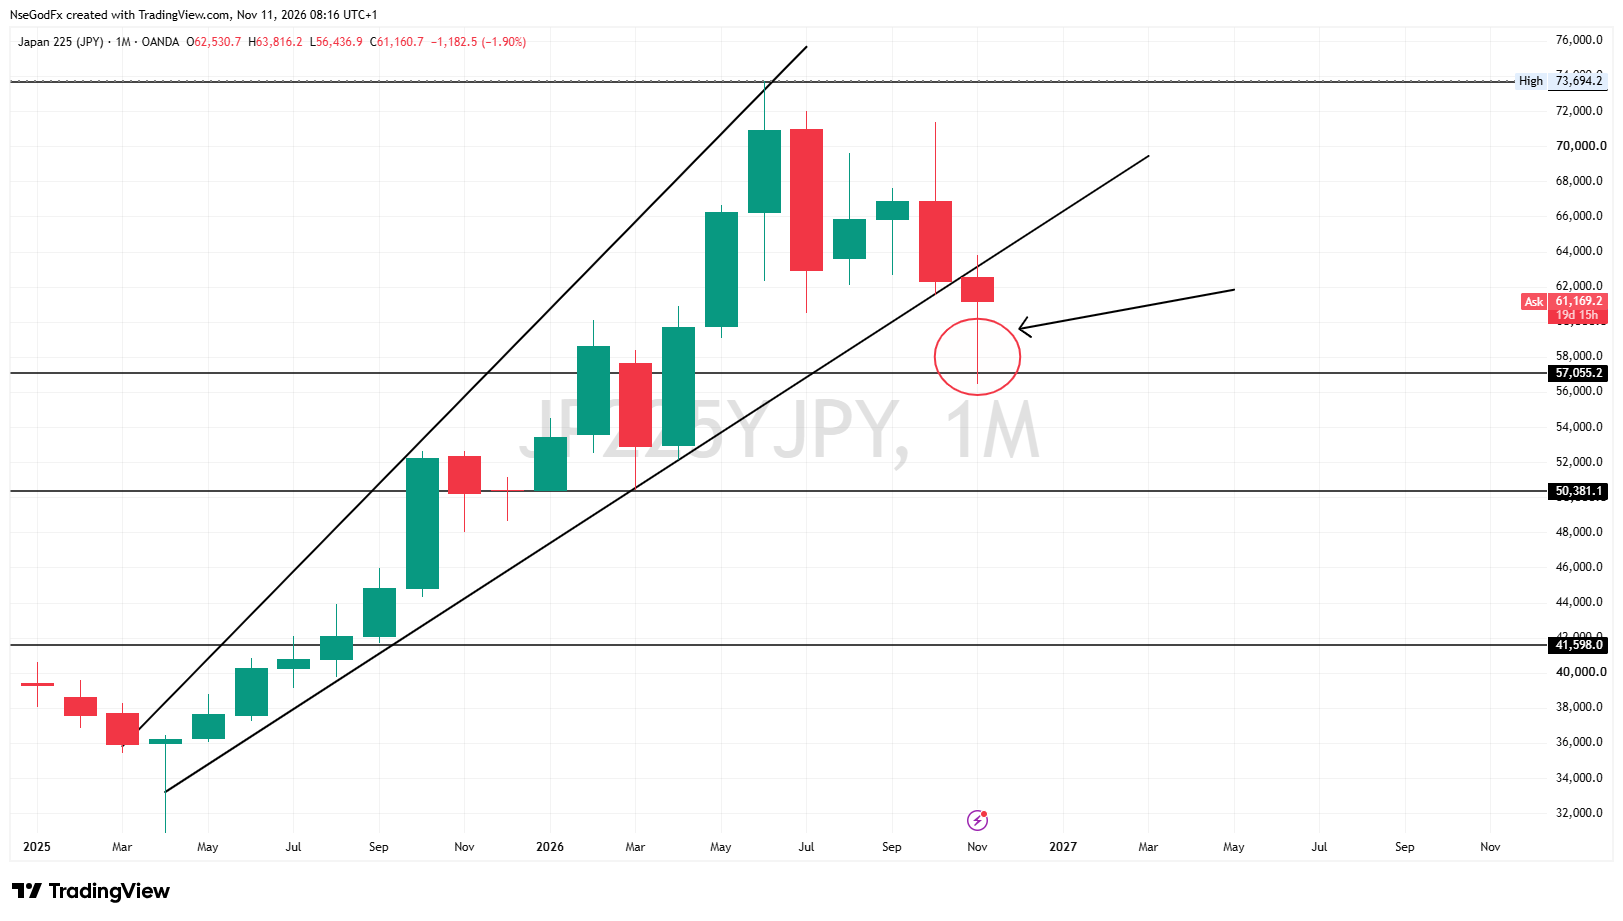
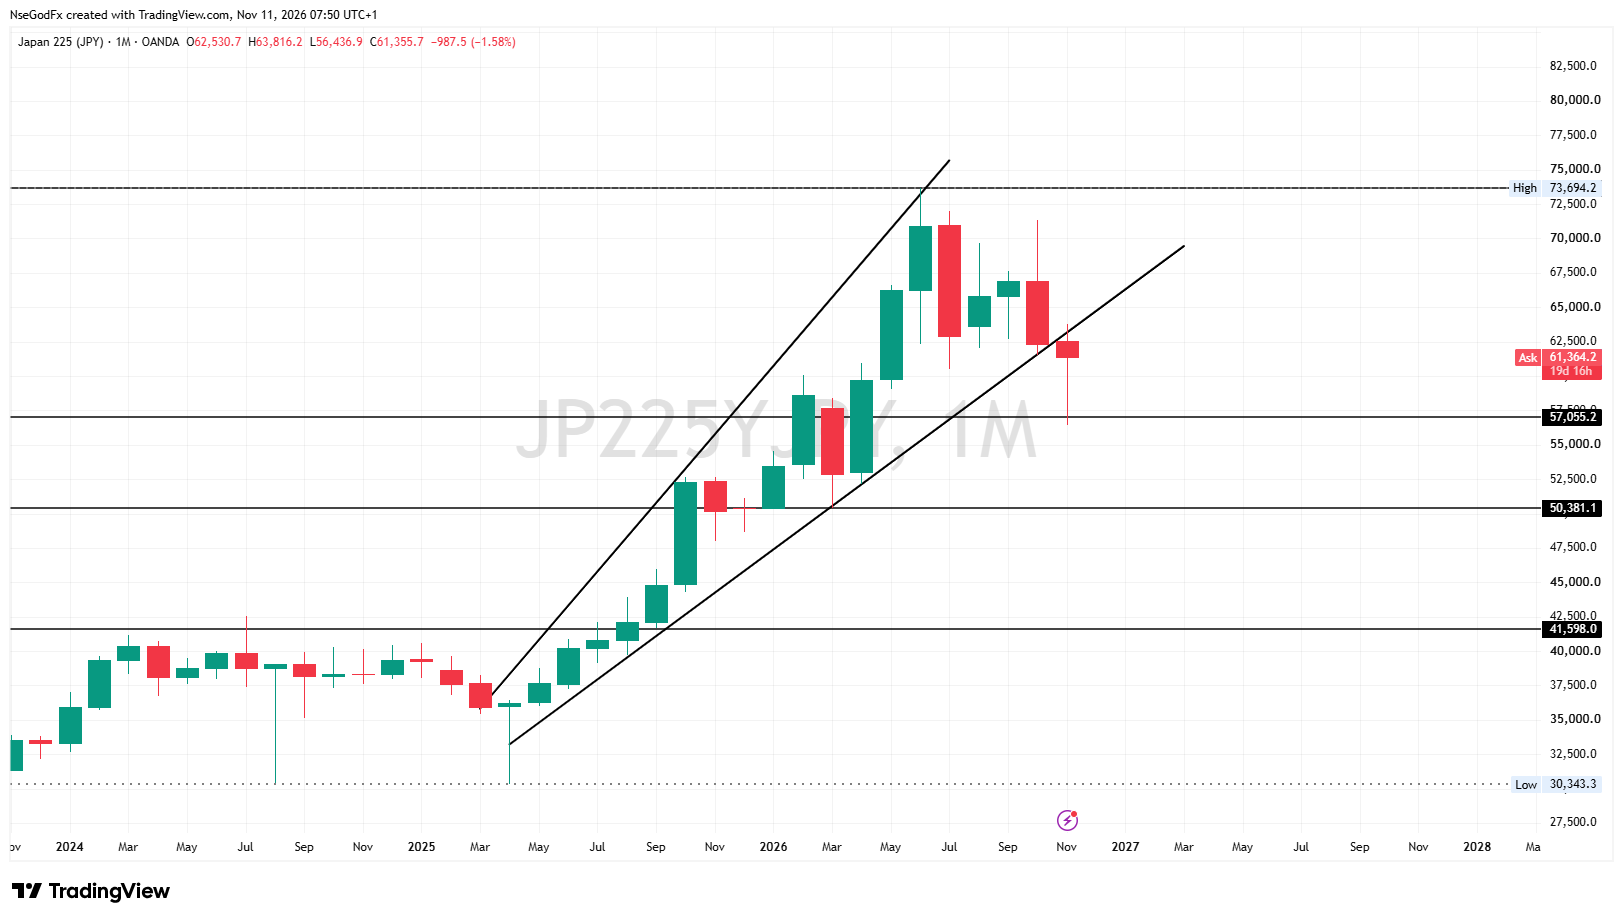
Technical Outlook: Monthly Ascending Channel

Analysis: The Monthly Timeframe depicts the overall picture of price activities on the asset, capturing the bullish sequence of Higher highs and higher lows.
This month, price shows strong bearish activities that drove price down to the major support region at 57000 before strong bullish activities intercepted heavily.
Despite price trading outside the confines of the Ascending Channel, pushing below the lower trendline that has acted as Dynamic Support in times past, we can't conclude that price has done a breakout out of the channel until the monthly candle closes at the end of the month.
If it closes with a body below the lower trendline, then a breakout is said to occur and the channel invalidated.

N
@nsg_usd - 4 hours ago
Quoted - nsg_usd

Also, on the monthly, If the November monthly candle flips bullish and closes inside the Channel, above the dynamic support (Lower trendline), then the lower wick of the candle will represent a monthly fakeout of the channel.

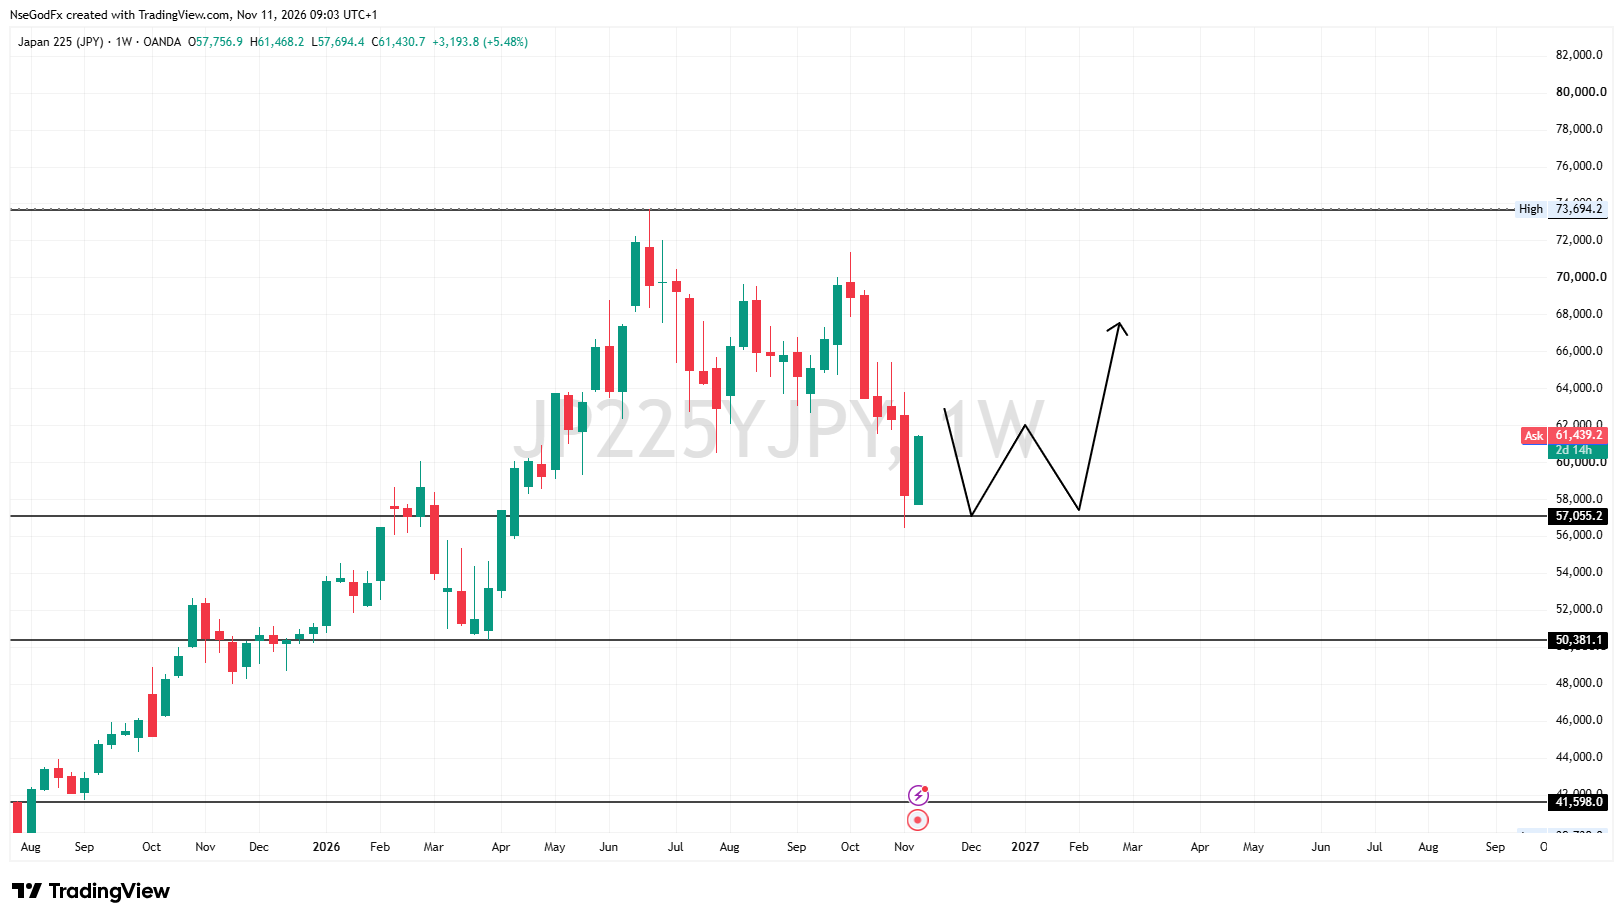
On the Weekly, the rebound on the Major support zone (57,000-58000) shows vividly with a strong weekly momentum candle that depicts the trading activities of this week.
Often times, the first rebound from a Major zone shows the presence and activeness of bulls or bears in that zone, in this case, the bulls. Then the second rebound that often creates a double bottom shows defence and often leads to a bigger momentum that can create a higher high, breaking the neckline of the double bottom.
In this JP225 case, there's only the first touch which signals Active presence of the bulls at the zone, and I'll anticipate a revisit at the zone for a second touch and if it creates a double bottom, then that shows Active defence of the zone by the bulls and they are ready to defend the level and prevent a further downside.

N
@nsg_usd - 3 hours ago
Quoted - nsg_usd

On the Weekly, the rebound on the Major support zone (57,000-58000) shows vividly with a strong weekly momentum candle that depicts the trading activities of this week.
Often times, the first rebound from a Major zone shows the presence and activeness of bulls or bears in that zone, in this case, the bulls. Then the second rebound that often creates a double bottom shows defence and often leads to a bigger momentum that can create a higher high, breaking the neckline of the double bottom.
In this JP225 case, there's only the first touch which signals Active presence of the bulls at the zone, and I'll anticipate a revisit at the zone for a second touch and if it creates a double bottom, then that shows Active defence of the zone by the bulls and they are ready to defend the level and prevent a further downside.
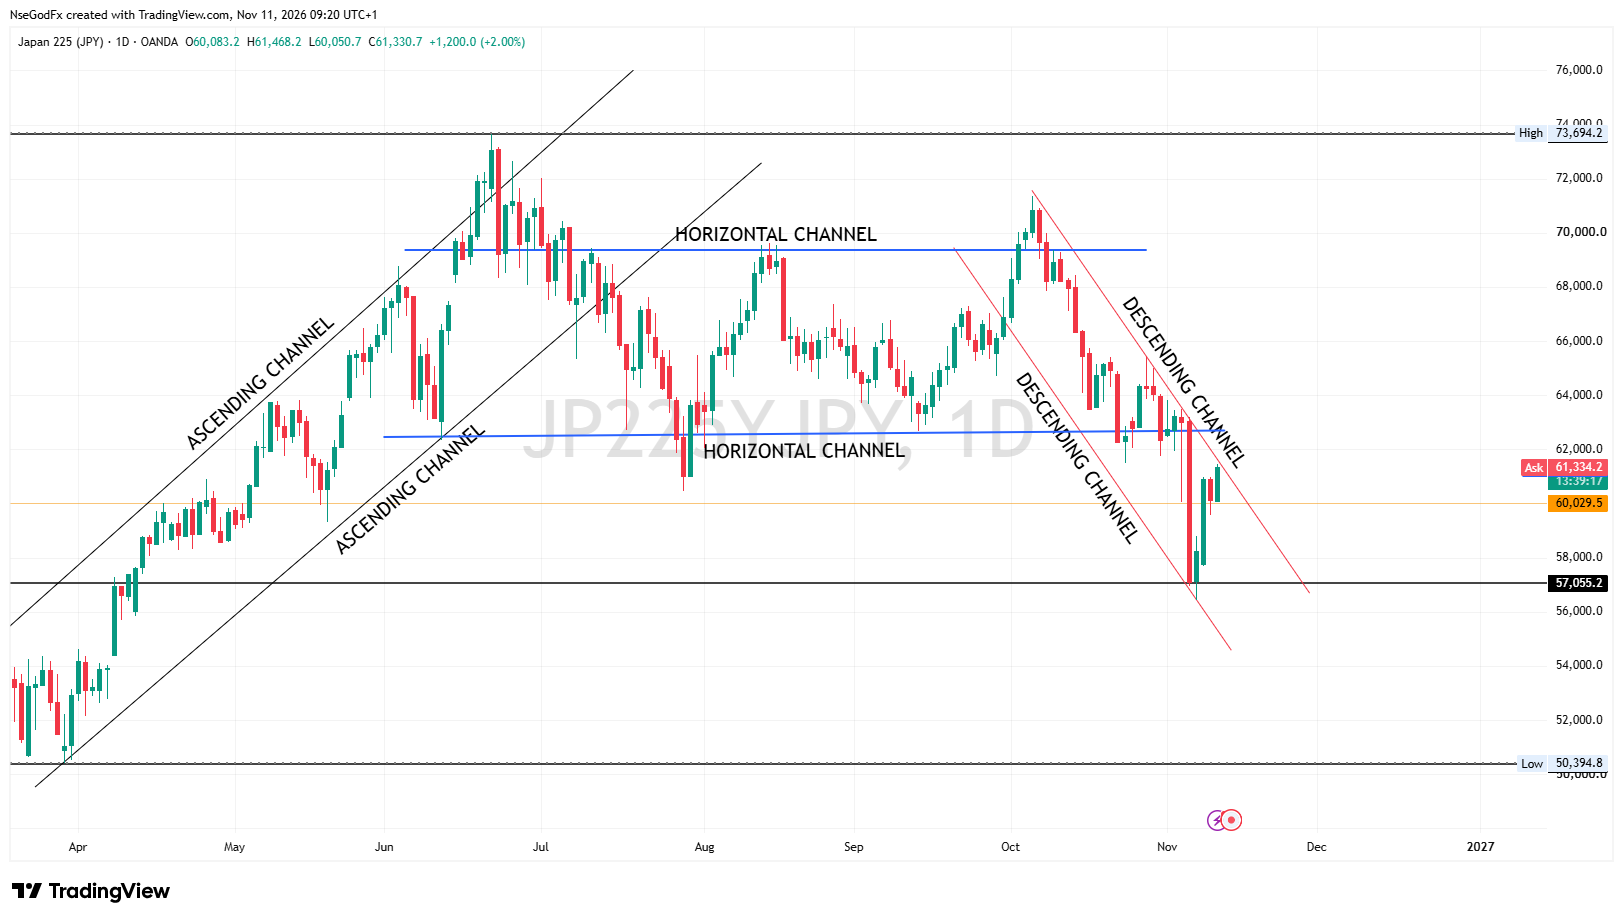
On the Daily, I've spotted 3 market phases on the Daily chart.
1) The Ascending Channel - This phase showed when the market was in an uptrend this year. It lasted throughout the first and second quarter of the year.
2) The Horizontal Channel - This phase shows when the market was trading sideways, after the uptrend phase. This lasted throughout the third quarter of the year.
3) The Descending Channel - This phase shows the current phase of the market, depicting the asset is currently in a downtrend and there's more bearish activities dominating it.

Despite the rebound at the Major Weekly Support zone at 57,000-58000 price region, without invalidation of the descending channel particularly the dynamic resistance, there's high tendency of price continuing the downside bearish move, till the month is over.

Disclaimer:

At MyTradingLand.com, we connect you with forex brokers and provide a community for traders. While we offer valuable information and resources, please note that we are not financial advisors and cannot provide personalized financial advice. Always conduct your own research and invest responsibly.

Community Guidelines: The MyTradingLand.com community is designed as a resource for forex traders, promoting respectful and constructive discussions. We reserve the right to remove any content that is misleading, abusive, or violates our terms of service.

Broker Information: While we may receive commissions or advertising income from some of the brokers listed, this does not imply an endorsement of any broker, nor does it affect our review process. Our evaluations are based solely on objective criteria and user feedback.

Always verify the regulatory status of any broker with your local financial authority, along with their terms and privacy policies, before engaging with them. It is crucial to conduct thorough research to ensure that you are making informed decisions.

Risk Warning: At MyTradingLand.com, we strive to provide accurate information; however, the forex market is highly volatile and can change rapidly. It is essential to verify any information before making investment decisions.

Please be aware that trading in forex involves substantial risk, and it is possible to lose more than your trading equity/investment capital. 70-90% of retail CFD traders incur losses in their trading activities as per information from various brokers.

You are solely responsible for your use of MyTradingLand.com and any trading decisions you make. We encourage all users to educate themselves thoroughly about forex trading and to consider seeking advice from qualified financial professionals.

Advertising Disclosure: We may earn commissions from recommended brokers, but our reviews are independent (not influenced by potential earnings). Sponsored content is clearly marked and doesn't reflect our views.

©2026 ©2025 All rights reserved Mytradingland.com