whats your technique for analyzing forex charts?

Guess everyone does it a bit differently so i'm curious, what method do you guys use to analyze forex charts before placing a trade?

I start by going to the 1 month timeframe to look for key support/resistance levels. Some call this the "top-down analysis" method because you start looking for these key levels from higher timeframes first, and then you go down too lower timeframes.

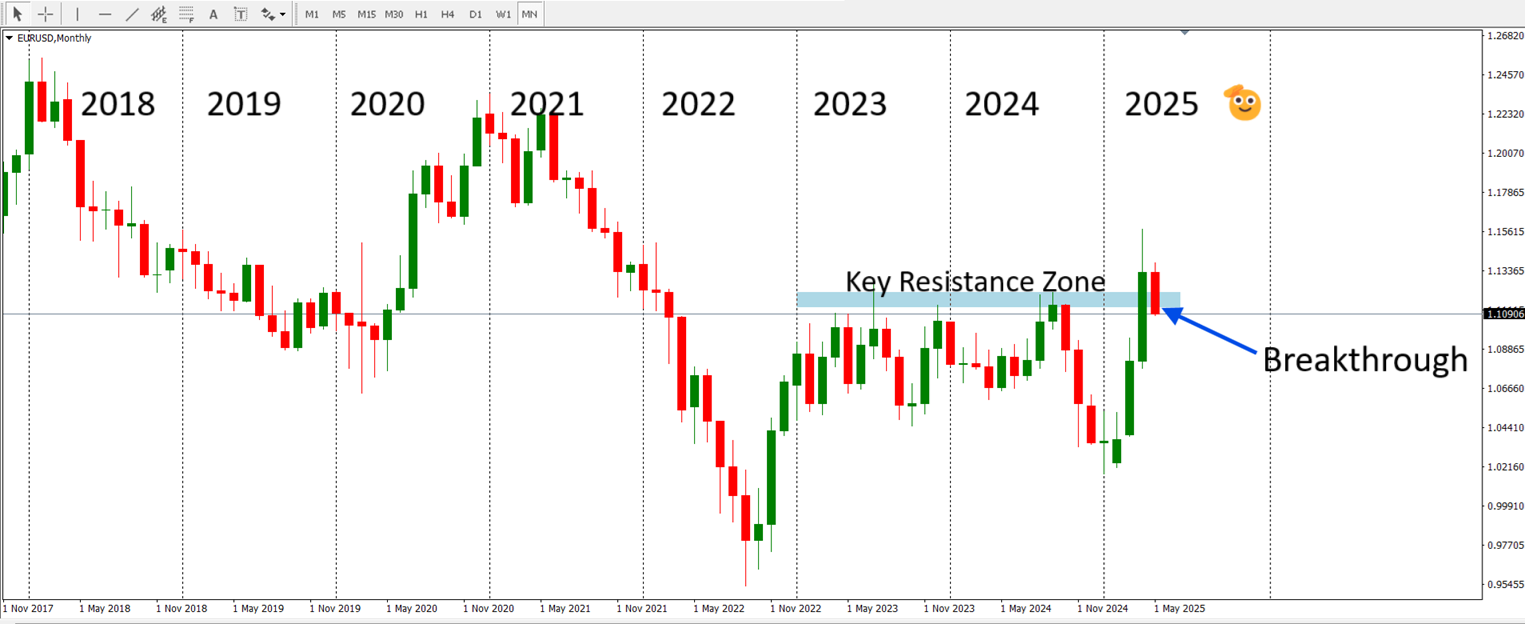
In the chart i attached, I am viewing the charts through a 1-month timeframe using an MT4 platform and i used "period seperators" to divide the screen into different years. Note that on a 1-month time frame, every candlestick represents one month.

If you look at the charts you will observe that between 2023 & 2024, price was unable to break through the 1.11973 level so I marked it as a key resistance level.

If price is able gather enough momemtum to break this resistance level, it may continue in the breakout direction for a while till the momentu is expired.

In April of 2025 (the 4th green candle on the chart), you will observe price broke through the key resistance level in the upward direction and maintained the momentum for a while.

Also observe that in May 2025 (last red candle on the chart), price gathered enough momentum to fall and break through the key resistance level (now turned support) and the likelihood is that price will also continue in the downward direction till the momentum is expired.

So, when you spot a key resistance/support level like this on a higher timefrme, you mark it with a horizontal line so it can guide you in forming your trading strategy.

Quoted - andy_colgate_nottinghill

I start by going to the 1 month timeframe to look for key support/resistance levels. Some call this the "top-down analysis" method because you start looking for these key levels from higher timeframes first, and then you go down too lower timeframes.

In the chart i attached, I am viewing the charts through a 1-month timeframe using an MT4 platform and i used "period seperators" to divide the screen into different years. Note that on a 1-month time frame, every candlestick represents one month.

If you look at the charts you will observe that between 2023 & 2024, price was unable to break through the 1.11973 level so I marked it as a key resistance level.

If price is able gather enough momemtum to break this resistance level, it may continue in the breakout direction for a while till the momentu is expired.

In April of 2025 (the 4th green candle on the chart), you will observe price broke through the key resistance level in the upward direction and maintained the momentum for a while.

Also observe that in May 2025 (last red candle on the chart), price gathered enough momentum to fall and break through the key resistance level (now turned support) and the likelihood is that price will also continue in the downward direction till the momentum is expired.

So, when you spot a key resistance/support level like this on a higher timefrme, you mark it with a horizontal line so it can guide you in forming your trading strategy.
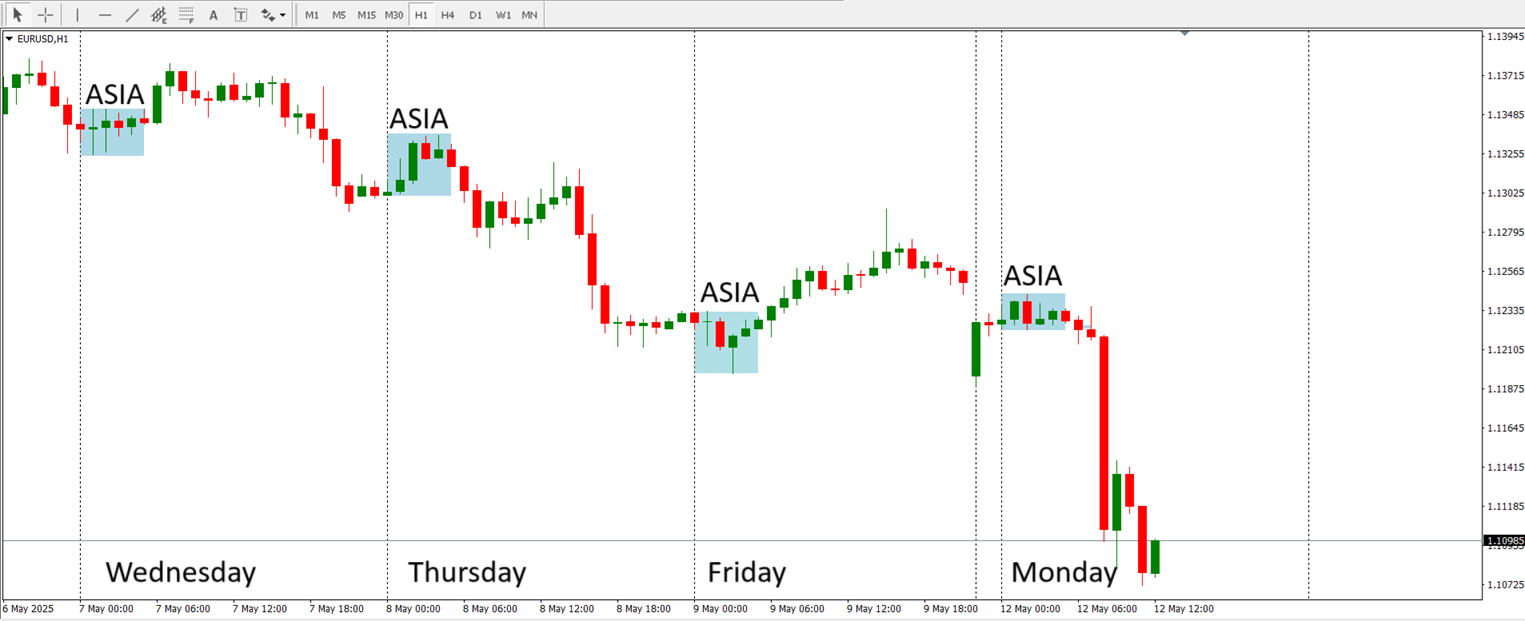
The next step in my chart analysis is to switch to the 1-hour timeframe and instert period seperators to divide the screen into different days of the week. I then mark out the Asian session by drawing a rectangle to cover the highest and lowest prices reached during the Asian session.

Why do I do this? Well, it is because the Asian session comes before the London session (which is the most important session for any trader) and so the Asian session sets the tone for the London session.

From the image i attached, notice how price always breaks above/below the Asian session rectangle after the Asian session ends and the Frankfurt/London sessions start. You could build a trading strategy using this breakout occurence.

O
@obinna - 1 year ago
Quoted - andy_colgate_nottinghill

The next step in my chart analysis is to switch to the 1-hour timeframe and instert period seperators to divide the screen into different days of the week. I then mark out the Asian session by drawing a rectangle to cover the highest and lowest prices reached during the Asian session.

Why do I do this? Well, it is because the Asian session comes before the London session (which is the most important session for any trader) and so the Asian session sets the tone for the London session.

From the image i attached, notice how price always breaks above/below the Asian session rectangle after the Asian session ends and the Frankfurt/London sessions start. You could build a trading strategy using this breakout occurence.

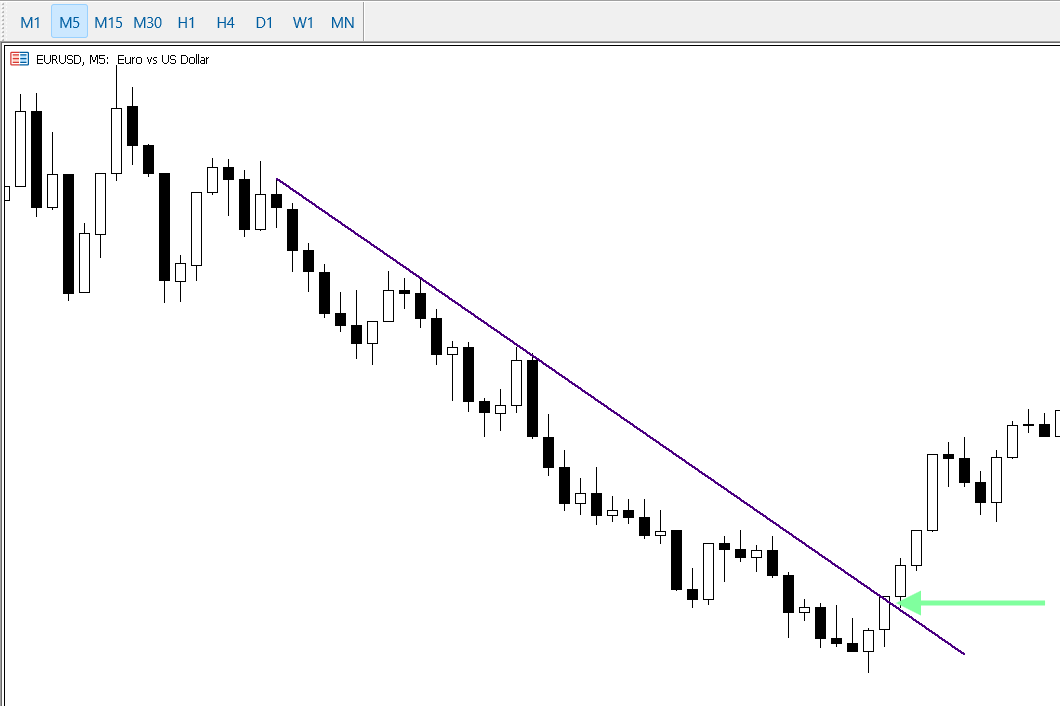
One of the methods I empoy is trend line analysis. For example if i see a down trend, I draw a trend line from the start of the trend and drag it downwards. The trend line i draw must touch the wicks or tops of some candles in its path, this is important.

I then sit back & observe how new candles that form on the chart interact with the trend line. When i notice that new candles have started forming above the trend line, then it means the trend is dying. I then mark the point where the trend line was breached as an area of value for future referenc.

Disclaimer:

At MyTradingLand.com, we connect you with forex brokers and provide a community for traders. While we offer valuable information and resources, please note that we are not financial advisors and cannot provide personalized financial advice. Always conduct your own research and invest responsibly.

Community Guidelines: The MyTradingLand.com community is designed as a resource for forex traders, promoting respectful and constructive discussions. We reserve the right to remove any content that is misleading, abusive, or violates our terms of service.

Broker Information: While we may receive commissions or advertising income from some of the brokers listed, this does not imply an endorsement of any broker, nor does it affect our review process. Our evaluations are based solely on objective criteria and user feedback.

Always verify the regulatory status of any broker with your local financial authority, along with their terms and privacy policies, before engaging with them. It is crucial to conduct thorough research to ensure that you are making informed decisions.

Risk Warning: At MyTradingLand.com, we strive to provide accurate information; however, the forex market is highly volatile and can change rapidly. It is essential to verify any information before making investment decisions.

Please be aware that trading in forex involves substantial risk, and it is possible to lose more than your trading equity/investment capital. 70-90% of retail CFD traders incur losses in their trading activities as per information from various brokers.

You are solely responsible for your use of MyTradingLand.com and any trading decisions you make. We encourage all users to educate themselves thoroughly about forex trading and to consider seeking advice from qualified financial professionals.

Advertising Disclosure: We may earn commissions from recommended brokers, but our reviews are independent (not influenced by potential earnings). Sponsored content is clearly marked and doesn't reflect our views.

©2026 ©2025 All rights reserved Mytradingland.com