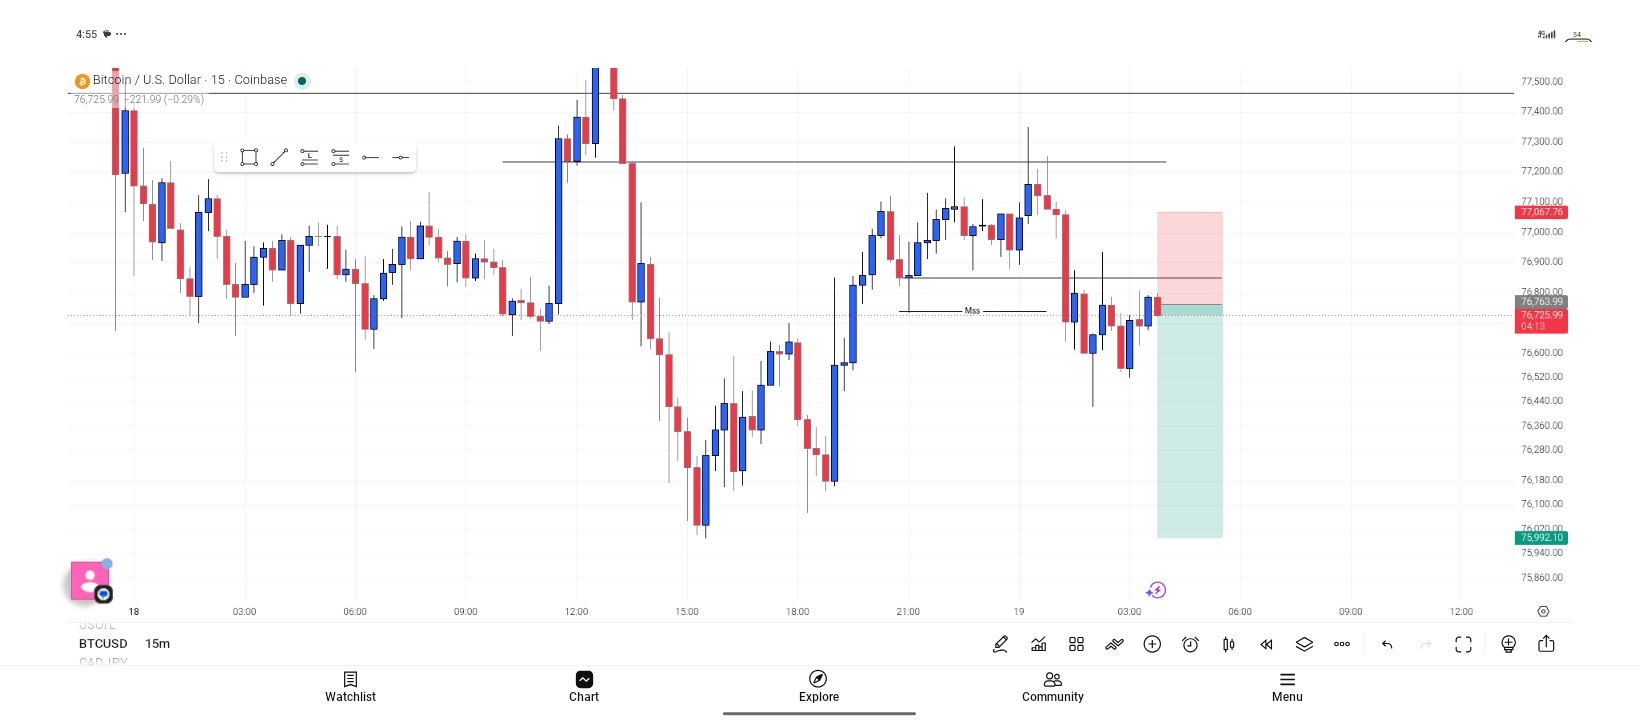
Bitcoin Analysis

G
@godswillfx - 1 month ago

This is a quick scalp setup on BTCUSD.

1 hour resistance zone

15 minutes Mss liquidity and poi

G
@godswillfx - 1 month ago

This is a quick Bitcoin scalp trade setup.

Buying on the 15 minutes timeframe.

I saw a mss, liquidity and poi that's why I'm going long to sell later

G
@godswillfx - 1 month ago

Bitcoin Trading Setup Explained (Simple Version)

Hey everyone! πŸ‘‹ I spotted an interesting Bitcoin setup and want to explain it step-by-step

The Big Picture (45-minute Timeframe)

On the higher timeframe (45m chart):

- Bitcoin was moving in one clear direction (a trend).

- Then the market changed direction.

- We saw a "Double Break of Structure", this means price broke previous important highs/lows twice. This is a strong sign that the old trend is losing power and a new move is starting.

- Price swept through liquidity (areas where many stop-loss orders from traders are sitting usually just above recent highs or below recent lows).

- After sweeping that liquidity, price reacted nicely at a Breaker Block on the 45-minute chart.

What is a Breaker Block?

Think of it as a "failed" demand or supply zone that price broke through earlier. Once broken, it often becomes an important area where price likes to return to later like a magnet.

G
@godswillfx - 1 month ago
Quoted - godswillfx

Bitcoin Trading Setup Explained (Simple Version)

Hey everyone! πŸ‘‹ I spotted an interesting Bitcoin setup and want to explain it step-by-step

The Big Picture (45-minute Timeframe)

On the higher timeframe (45m chart):

- Bitcoin was moving in one clear direction (a trend).

- Then the market changed direction.

- We saw a "Double Break of Structure", this means price broke previous important highs/lows twice. This is a strong sign that the old trend is losing power and a new move is starting.

- Price swept through liquidity (areas where many stop-loss orders from traders are sitting usually just above recent highs or below recent lows).

- After sweeping that liquidity, price reacted nicely at a Breaker Block on the 45-minute chart.

What is a Breaker Block?

Think of it as a "failed" demand or supply zone that price broke through earlier. Once broken, it often becomes an important area where price likes to return to later like a magnet.

Zooming In (5-minute Timeframe)

On the lower timeframe (5m chart) we see more details:

- There was a Market Structure Shift (MSS), this simply means the pattern of higher highs & higher lows (or lower highs & lower lows) changed. It confirms the direction has shifted.

- We again saw liquidity being taken (price sweeping stops).

- There are clear Points of Interest (POI), these are high-probability zones where smart money often reacts.

What we're waiting for:

The plan is for price to come back to the 5-minute Breaker Block to give us a good entry (buy or sell setup, depending on the direction).

G
@godswillfx - 1 month ago
Quoted - godswillfx

Zooming In (5-minute Timeframe)

On the lower timeframe (5m chart) we see more details:

- There was a Market Structure Shift (MSS), this simply means the pattern of higher highs & higher lows (or lower highs & lower lows) changed. It confirms the direction has shifted.

- We again saw liquidity being taken (price sweeping stops).

- There are clear Points of Interest (POI), these are high-probability zones where smart money often reacts.

What we're waiting for:

The plan is for price to come back to the 5-minute Breaker Block to give us a good entry (buy or sell setup, depending on the direction).

Summary of the Setup (Easy Version)

1. Higher Timeframe (45m) confirms the bigger picture and direction.

2. Price broke structure twice + swept liquidity β†’ strong signal.

3. Price respected the 45m Breaker Block.

4. Lower timeframe (5m) shows a structure shift + more liquidity taken.

5. Waiting for price to return to the 5m Breaker Block for a high-probability entry.

This is a multi-timeframe approach , using the big picture (45m) to understand direction, and the lower timeframe (5m) to time the entry precisely.

Y
@yokoyi - 1 month ago
Quoted - temp02

Could you please explain this chart

@Godswill someone dropped a comment for you

G
@godswillfx - 1 month ago
Quoted - temp02

Could you please explain this chart

Bitcoin was reacting from a daily timeframe key level, I scaled down to the 15 minutes, and I got market structure shift MSS, liquidity (Inducement) and POI.

G
@godswillfx - 1 month ago
Quoted - godswillfx

Stop loss hit.

Weekly BTC Outlook: Buy Setup Loading

Bitcoin swept the 30/45-minute inducement (taking out liquidity below recent lows) and tapped into the 45/30-minute Fair Value Gap, exactly where I was watching for a reaction.

G
@godswillfx - 1 month ago
Quoted - godswillfx

Weekly BTC Outlook: Buy Setup Loading

Bitcoin swept the 30/45-minute inducement (taking out liquidity below recent lows) and tapped into the 45/30-minute Fair Value Gap, exactly where I was watching for a reaction.

This is classic inducement + POI play. Price moved down to grab stops and fill the imbalance, now I’m expecting a strong bounce from this zone for a long entry.

Plan: Waiting for confirmation (displacement up or clean reversal candle) to buy. Not chasing, letting it come to my level.

Stay patient. The sweep is done. Reversal incoming. πŸš€

What do you guys think?

G
@godswillfx - 1 month ago

Bitcoin Short Setup Explained (Multi-Timeframe Breakdown)

I went short on Bitcoin with this clear confluence:

Higher Timeframes (Daily & 4H) gave the direction:

- On the Daily chart, price hit strong resistance, rejected it hard, and broke down on the 4-hour timeframe. That was the first confirmation of weakness.

- On the 4H chart, price then rejected the 4H resistance level and broke lower on the 1-hour timeframe. Momentum was shifting down.

G
@godswillfx - 1 month ago
Quoted - godswillfx

Bitcoin Short Setup Explained (Multi-Timeframe Breakdown)

I went short on Bitcoin with this clear confluence:

Higher Timeframes (Daily & 4H) gave the direction:

- On the Daily chart, price hit strong resistance, rejected it hard, and broke down on the 4-hour timeframe. That was the first confirmation of weakness.

- On the 4H chart, price then rejected the 4H resistance level and broke lower on the 1-hour timeframe. Momentum was shifting down.

Lower Timeframe (15min) for precise entry:

I dropped to the 15-minute chart and waited for confirmation:

- Clear Market Structure Shift (price broke previous lows and started making lower highs/lows).

- Liquidity swept (price took out recent highs to grab stops).

- POI (Point of Interest) β€” a high-probability reversal zone where I saw order flow align.

Once all three lined up on 15min, I entered the short.

Disclaimer:

At MyTradingLand.com, we connect you with forex brokers and provide a community for traders. While we offer valuable information and resources, please note that we are not financial advisors and cannot provide personalized financial advice. Always conduct your own research and invest responsibly.

Community Guidelines: The MyTradingLand.com community is designed as a resource for forex traders, promoting respectful and constructive discussions. We reserve the right to remove any content that is misleading, abusive, or violates our terms of service.

Broker Information: While we may receive commissions or advertising income from some of the brokers listed, this does not imply an endorsement of any broker, nor does it affect our review process. Our evaluations are based solely on objective criteria and user feedback.

Always verify the regulatory status of any broker with your local financial authority, along with their terms and privacy policies, before engaging with them. It is crucial to conduct thorough research to ensure that you are making informed decisions.

Risk Warning: At MyTradingLand.com, we strive to provide accurate information; however, the forex market is highly volatile and can change rapidly. It is essential to verify any information before making investment decisions.

Please be aware that trading in forex involves substantial risk, and it is possible to lose more than your trading equity/investment capital. 70-90% of retail CFD traders incur losses in their trading activities as per information from various brokers.

You are solely responsible for your use of MyTradingLand.com and any trading decisions you make. We encourage all users to educate themselves thoroughly about forex trading and to consider seeking advice from qualified financial professionals.

Advertising Disclosure: We may earn commissions from recommended brokers, but our reviews are independent (not influenced by potential earnings). Sponsored content is clearly marked and doesn't reflect our views.

©2026 Β©2025 All rights reserved Mytradingland.com