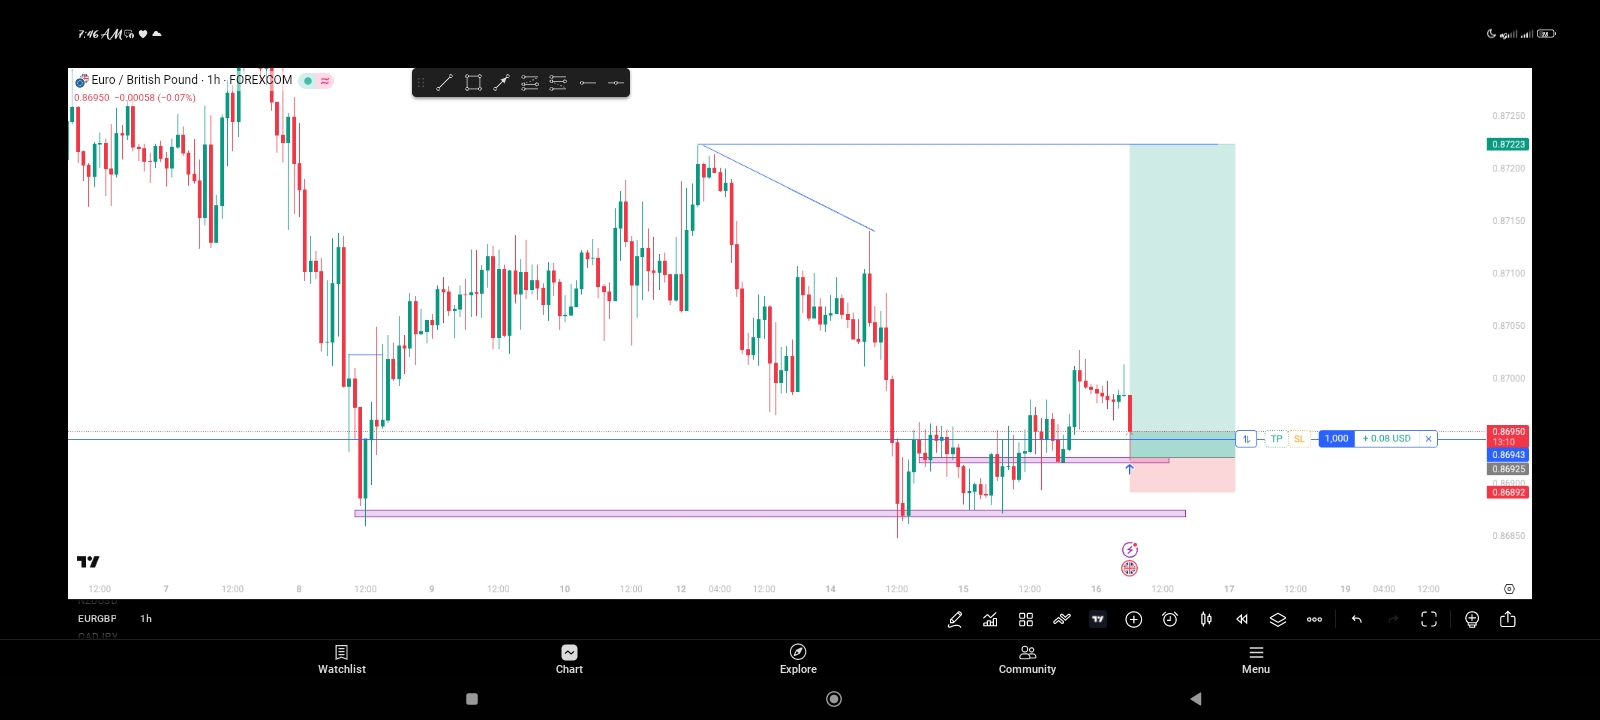
EURGBP SETUP

Directional Bias on 4hr.

Entry on 1 hour resistance zone

London session

TP at trendline liquidity exit

G
@godswillfx - 1 month ago

What's your take on this setup

G
@godswillfx - 1 month ago

Trade now running in profits.

G
@godswillfx - 4 weeks ago

Another quick setup on EURGBP

Y
@yokoyi - 4 weeks ago

It looks bearish to me but since its a quick scalp, price could go up b4 falling

G
@godswillfx - 4 weeks ago
Quoted - godswillfx

Trade now running in profits.

First TP smashed

1:8 RR bagged.

Unto the next

G
@godswillfx - 1 week ago

The Big Picture (Daily Chart)

Price hit a major resistance zone think of it as a ceiling the market has struggled to break through before. At that exact ceiling, a specific pattern called a CRT formed. That's basically the market faking a move, trapping buyers, then reversing. That's your first warning sign that price wants to come down

G
@godswillfx - 1 week ago
Quoted - godswillfx

The Big Picture (Daily Chart)

Price hit a major resistance zone think of it as a ceiling the market has struggled to break through before. At that exact ceiling, a specific pattern called a CRT formed. That's basically the market faking a move, trapping buyers, then reversing. That's your first warning sign that price wants to come down

Zooming In (2-Hour Chart)

Once you dropped to the 2H, three things confirmed the story:

- Market Structure Shift — Price broke a key low, signaling the trend flipped from up to down. The market "changed its mind."

- Liquidity — Before that shift, there were stop losses and orders sitting below. The market swept those, fueling the move down. Smart money fed off that.

- POI (Point of Interest) — After dropping, price needs to pull back up to refill that zone before continuing lower. That pullback zone is your entry area marked by that pink/red shaded box on the chart.