Good Morning Guys
Today I am Trading with the help of the Relative Strength Index (RSI) Indicator
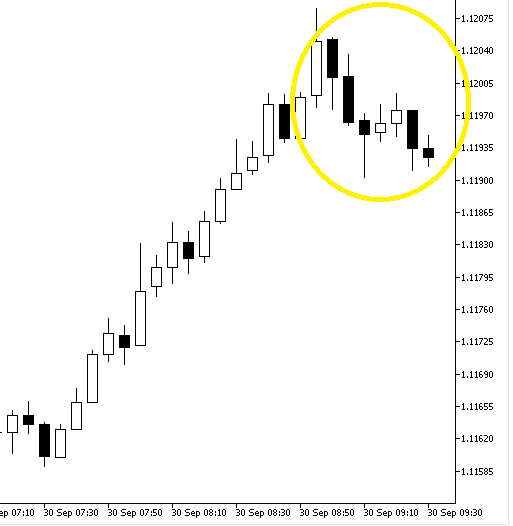
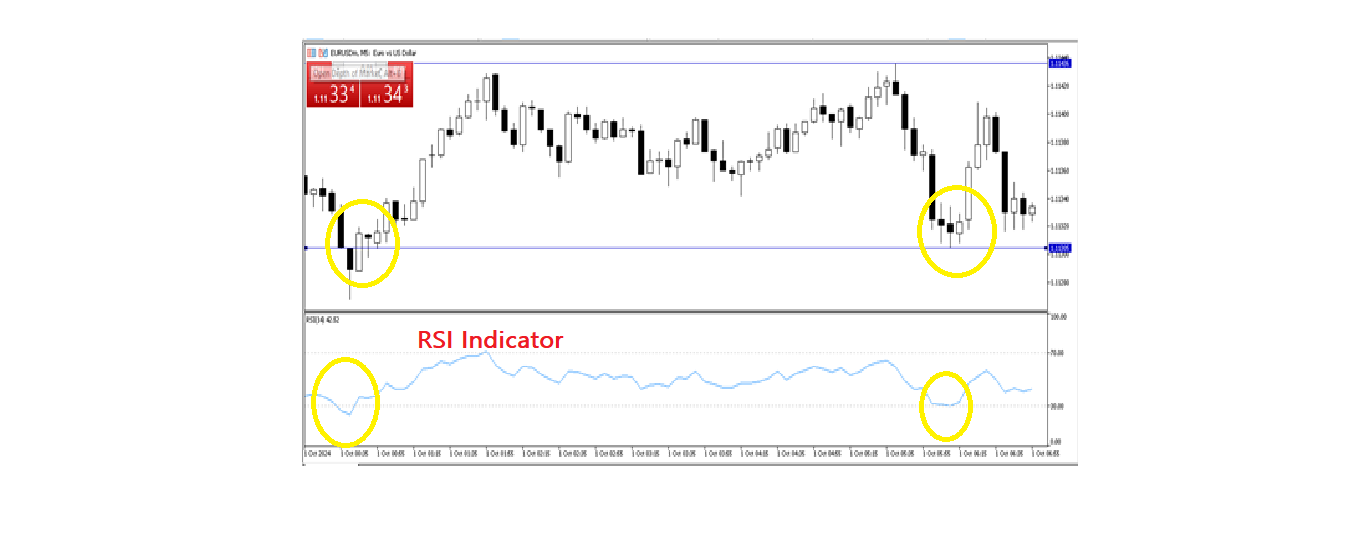
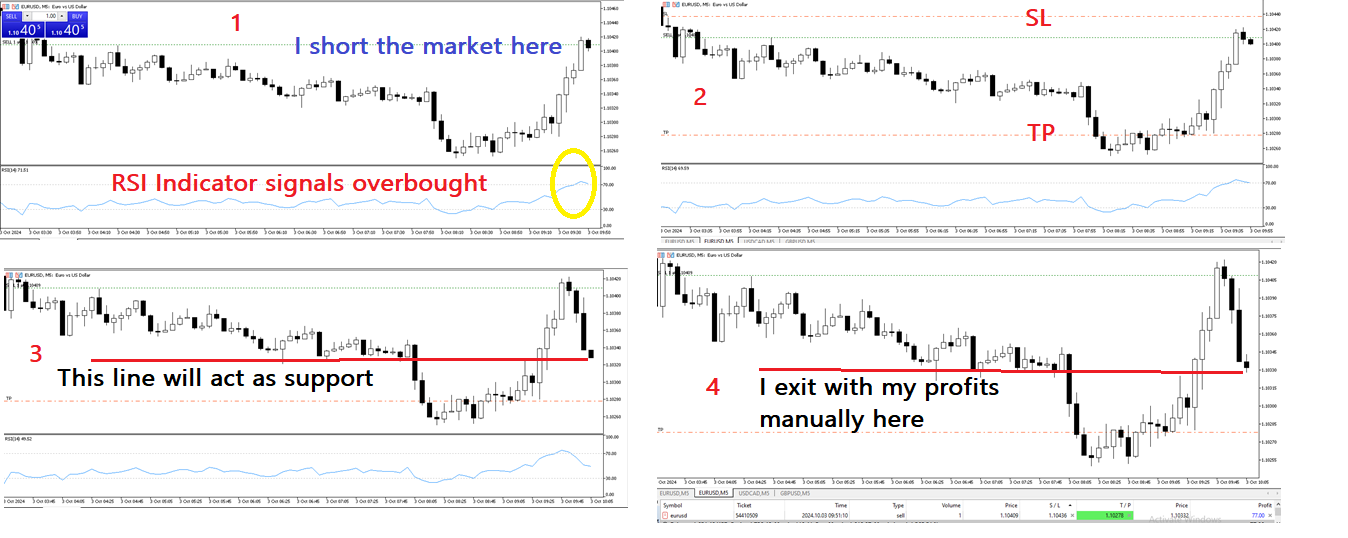
Chart1:
The RSI Indicator (see yellow circle) is showing the the market is overbought (the readong is above 70)
Whenever the market is overbought the next thing is the price will start falling so i short the market by placing a sell order.
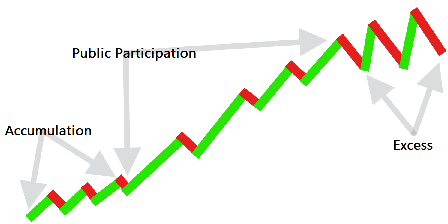
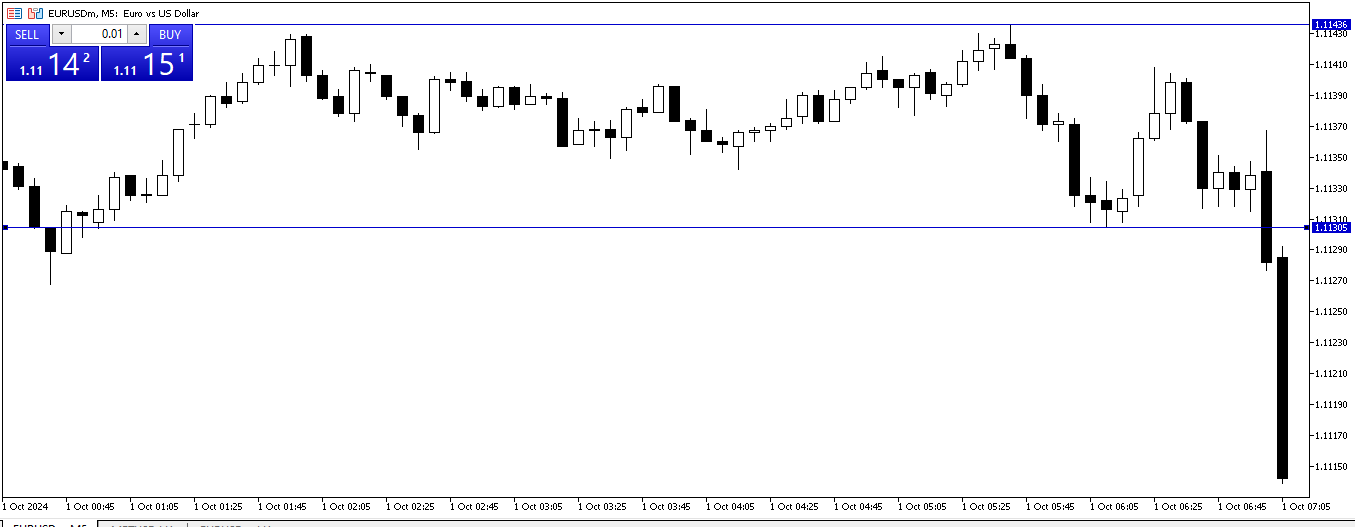
Chart 2:
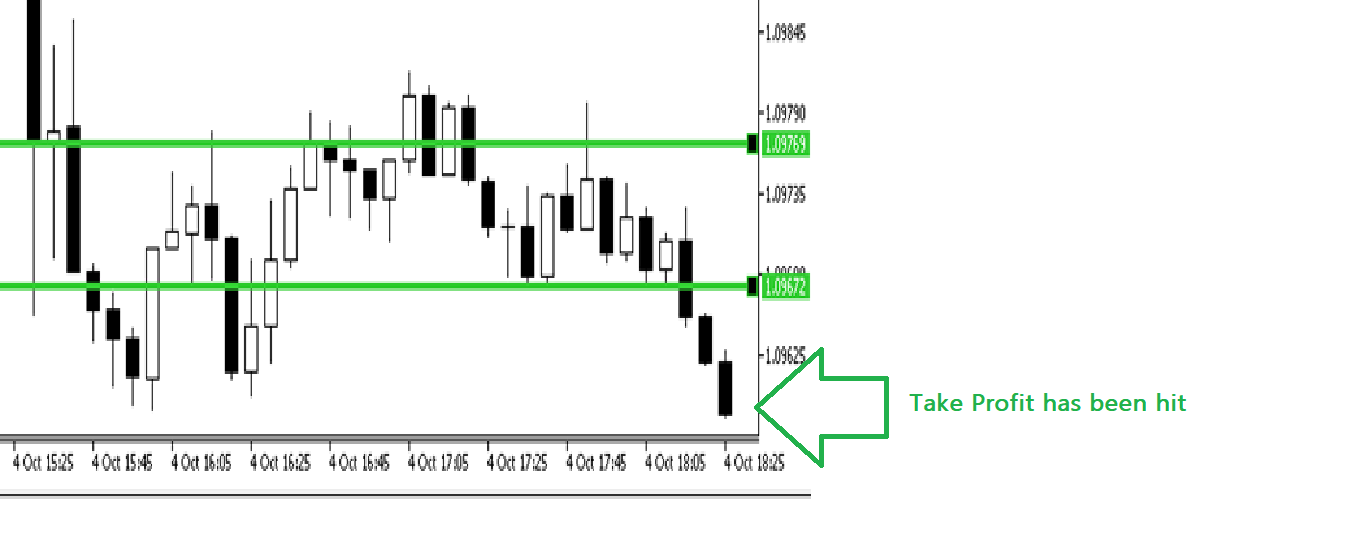
I place my Stop Loss above & Take Profit Below
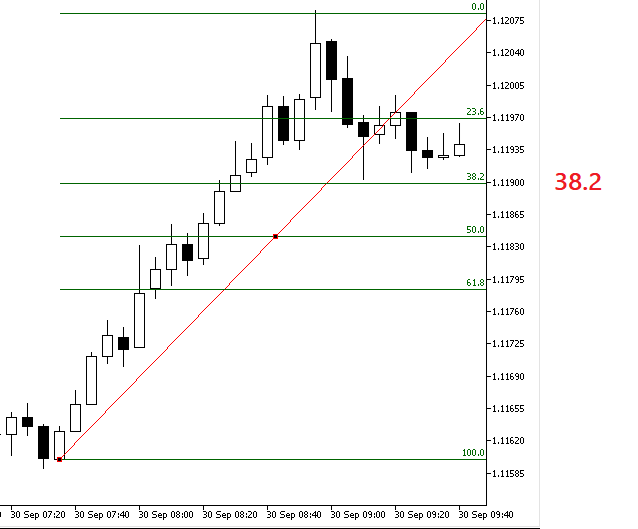
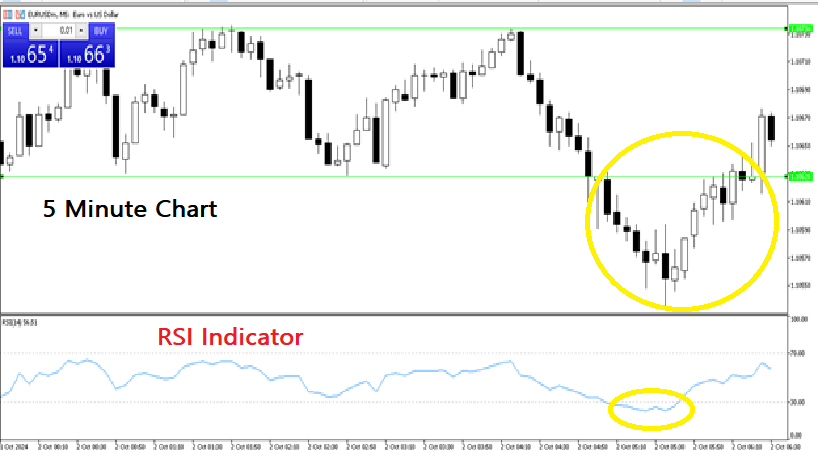
Chart 3:
Price starts falling in my favor
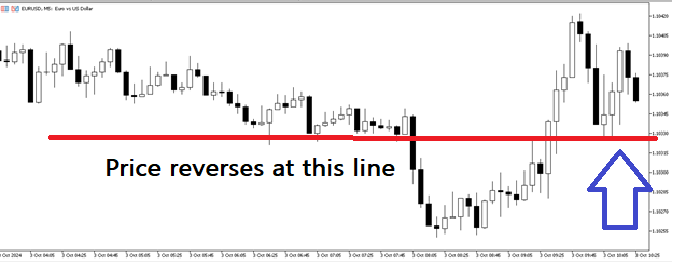
However, I notice something: I fear price may reverse at the 1.10330 because the candles seemed to break an invisible barrier before going down so i mark that point with a red line
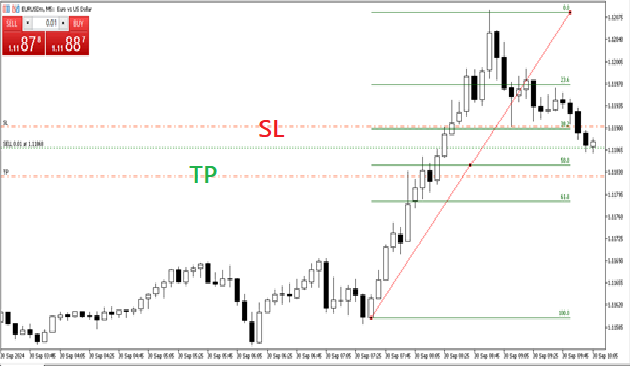
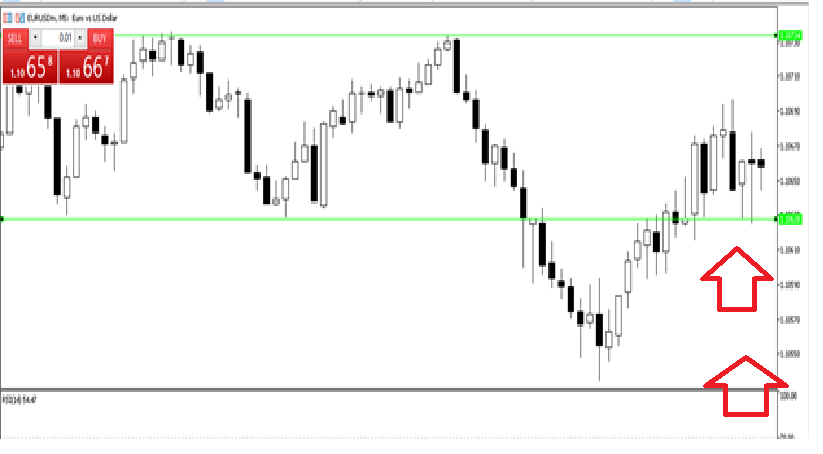
Chart 4:
When price gets to that red line i exit manually with my profits