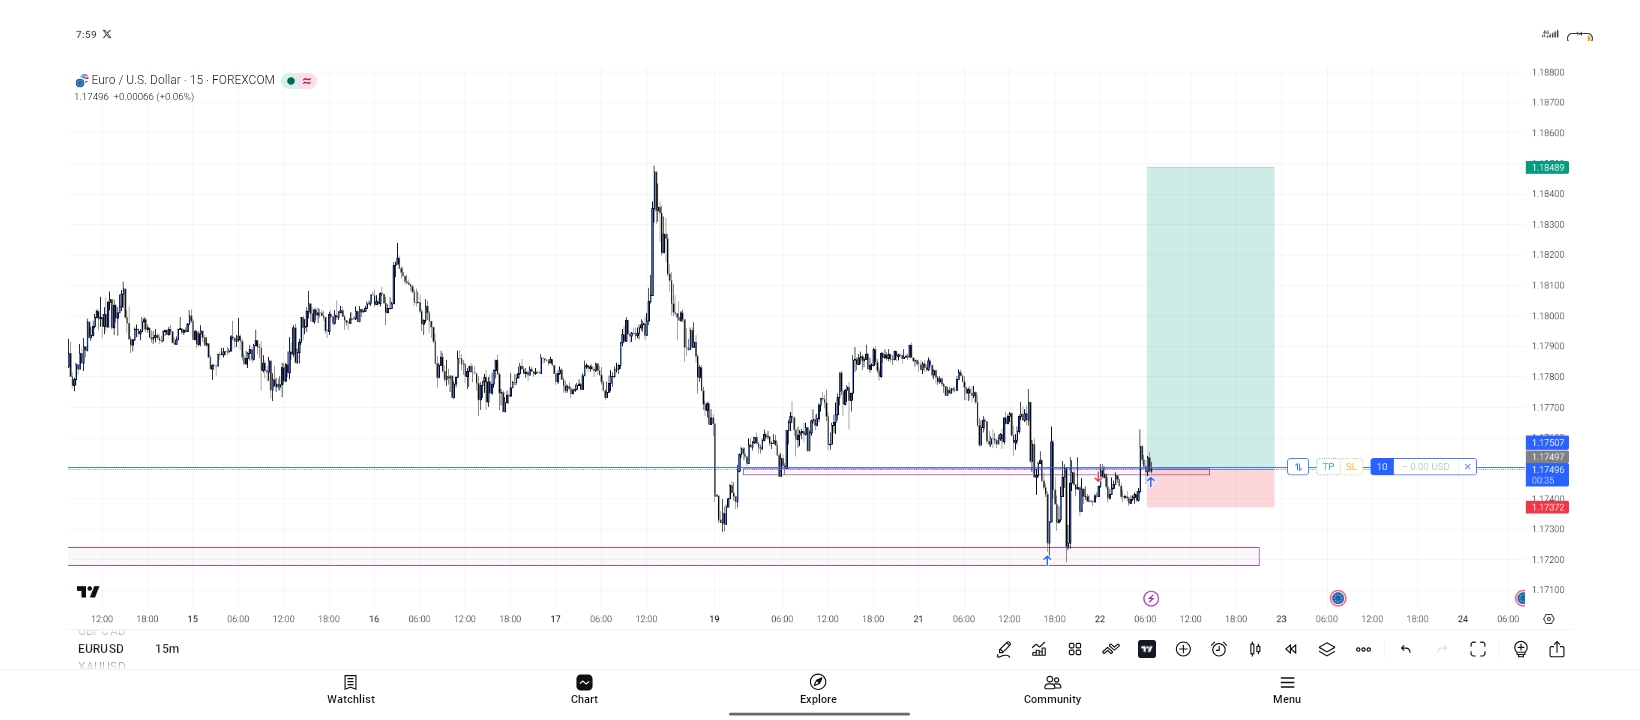
EURUSD quick scalp
A quick setup up on EURUSD
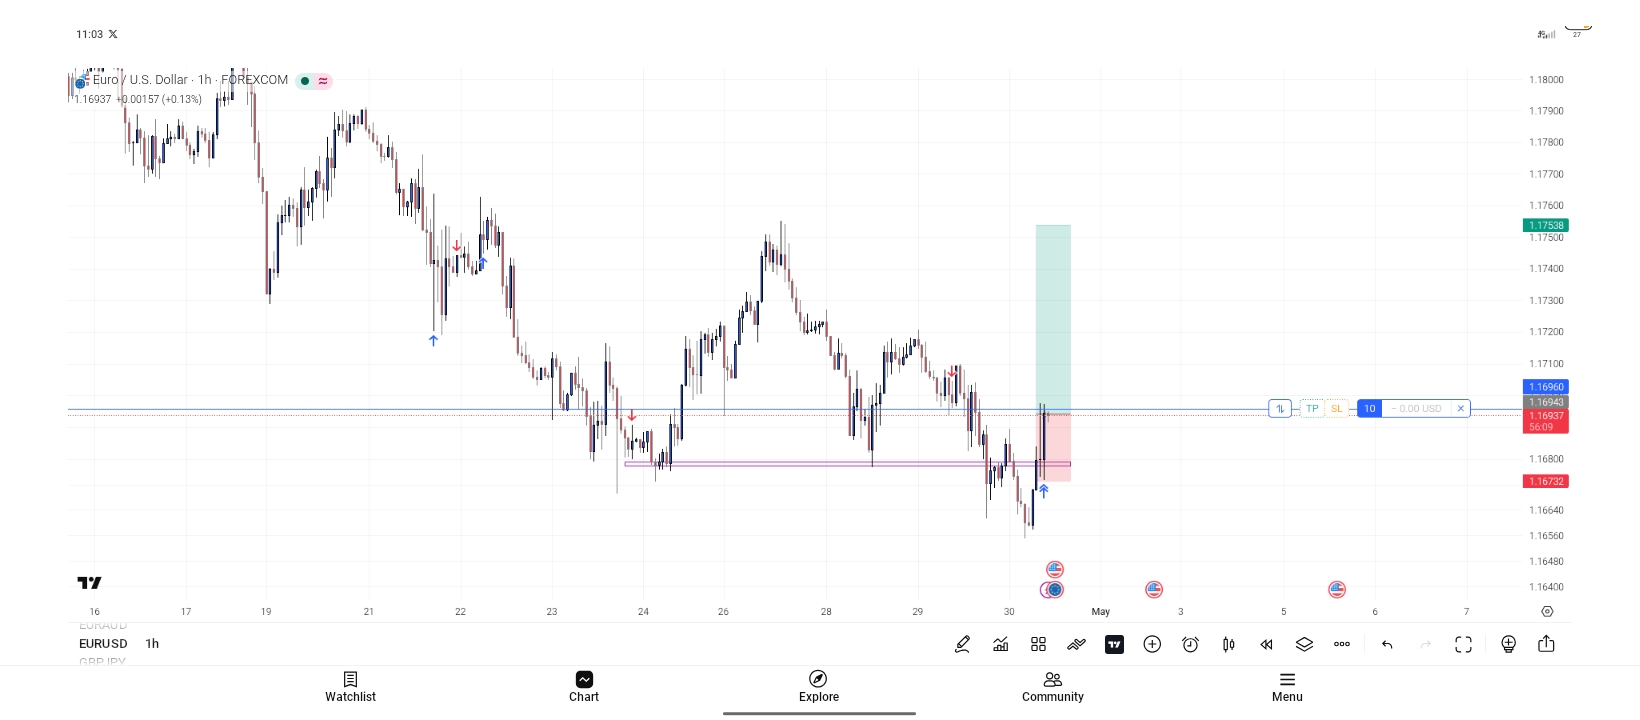
1:13 RR
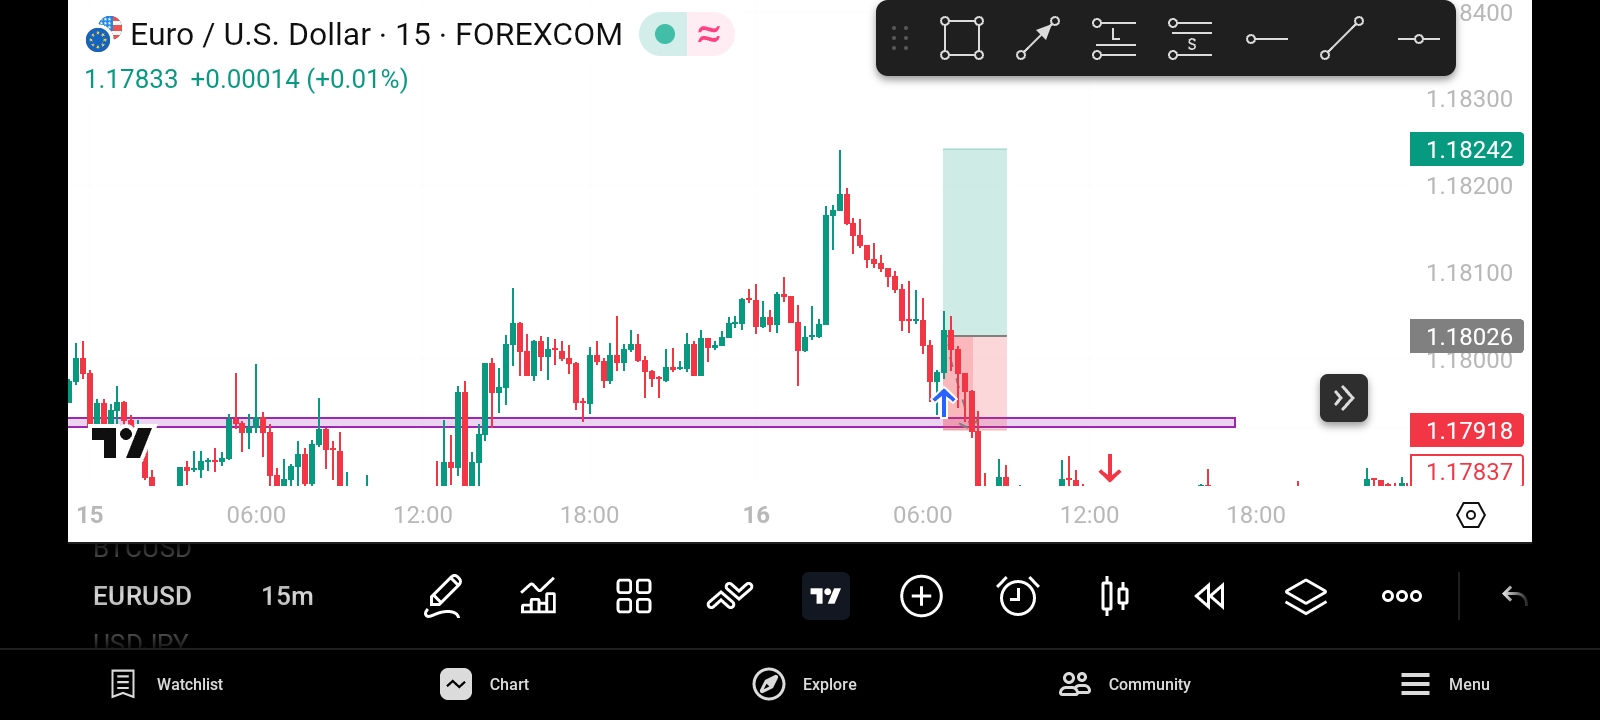
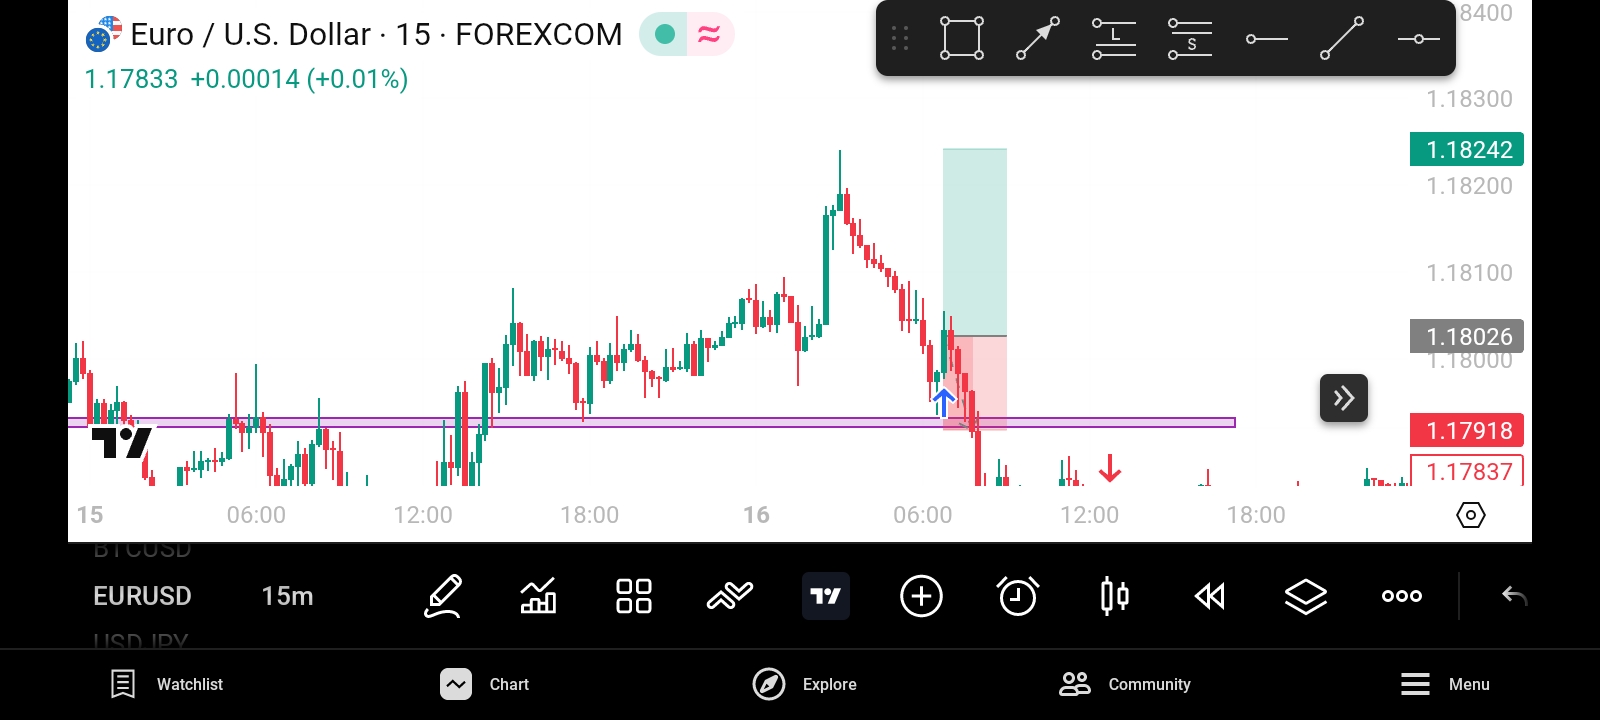
I Saw a two hour break of structure, market came back to react on our zone and gave a 15 minutes Mss liquidity and our POI
π EUR/USD 15-Minute Trade Setup β Buy Opportunity
Pair: EUR/USD (Euro vs US Dollar)
Timeframe: 15 Minutes
π What's Happening?
The market has been moving downward, but there are strong signs it's getting ready to bounce back up. Here's how I spotted this opportunity:
π The Analysis (Step by Step)
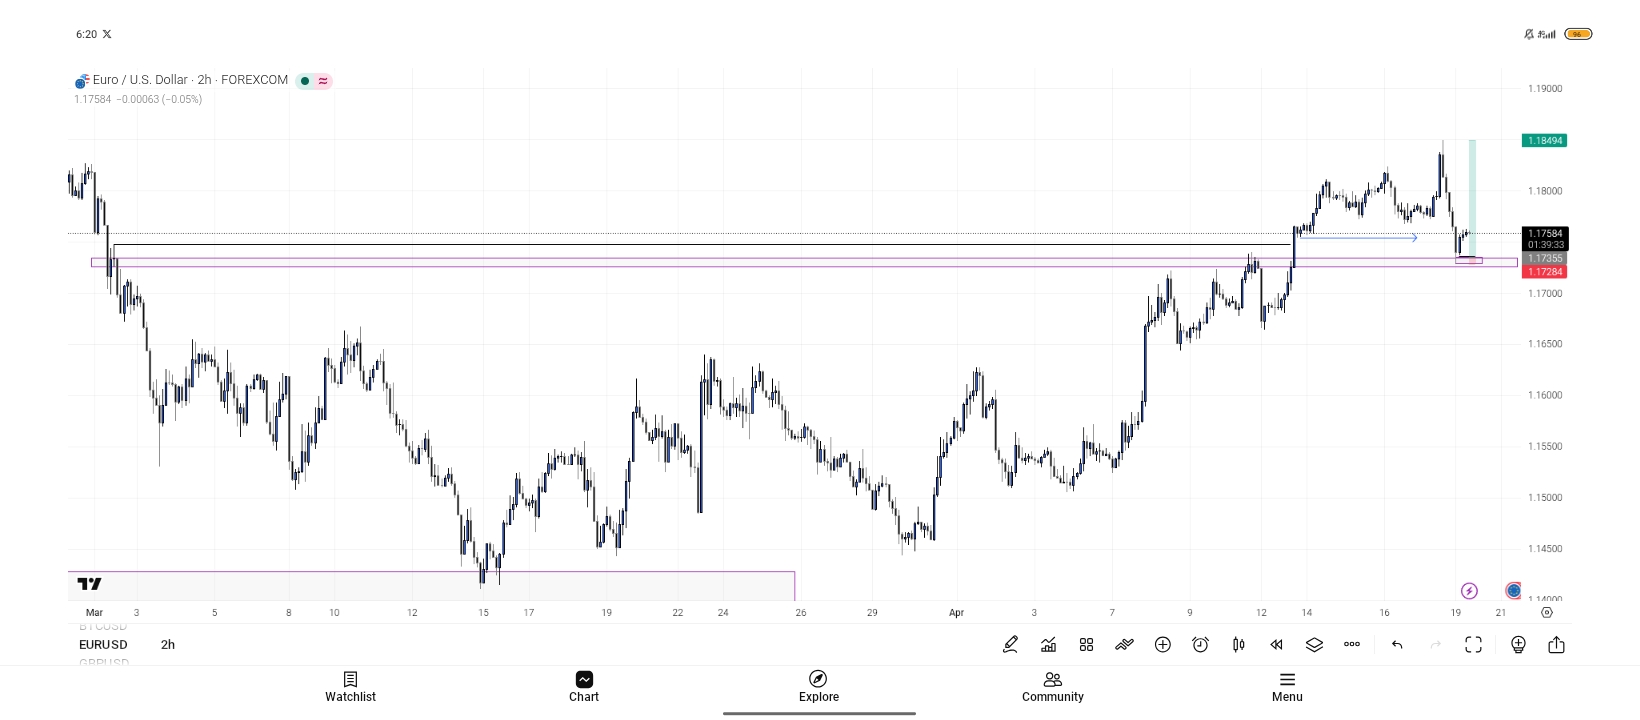
Step 1 β Start with the Big Picture (1-Hour Chart)
Before jumping into any trade, I zoomed out to the 1-hour chart. Price was sitting right at a key support zone β a price level where buyers have historically stepped in and pushed the market back up. The market *rejected* that level, meaning sellers tried to push lower but failed. That was my first green light. π’
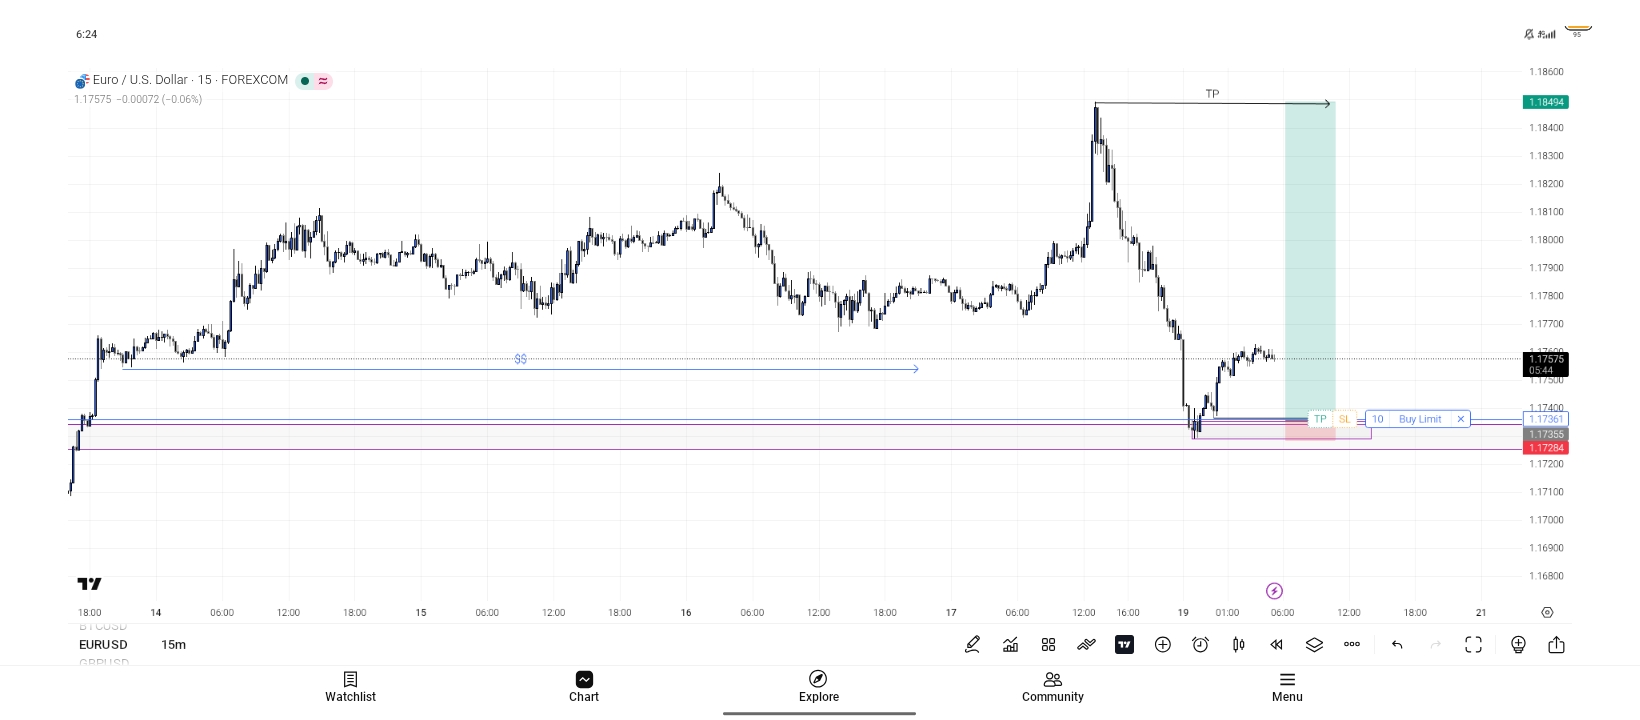
Step 2 β Drop Down to the 15-Minute Chart
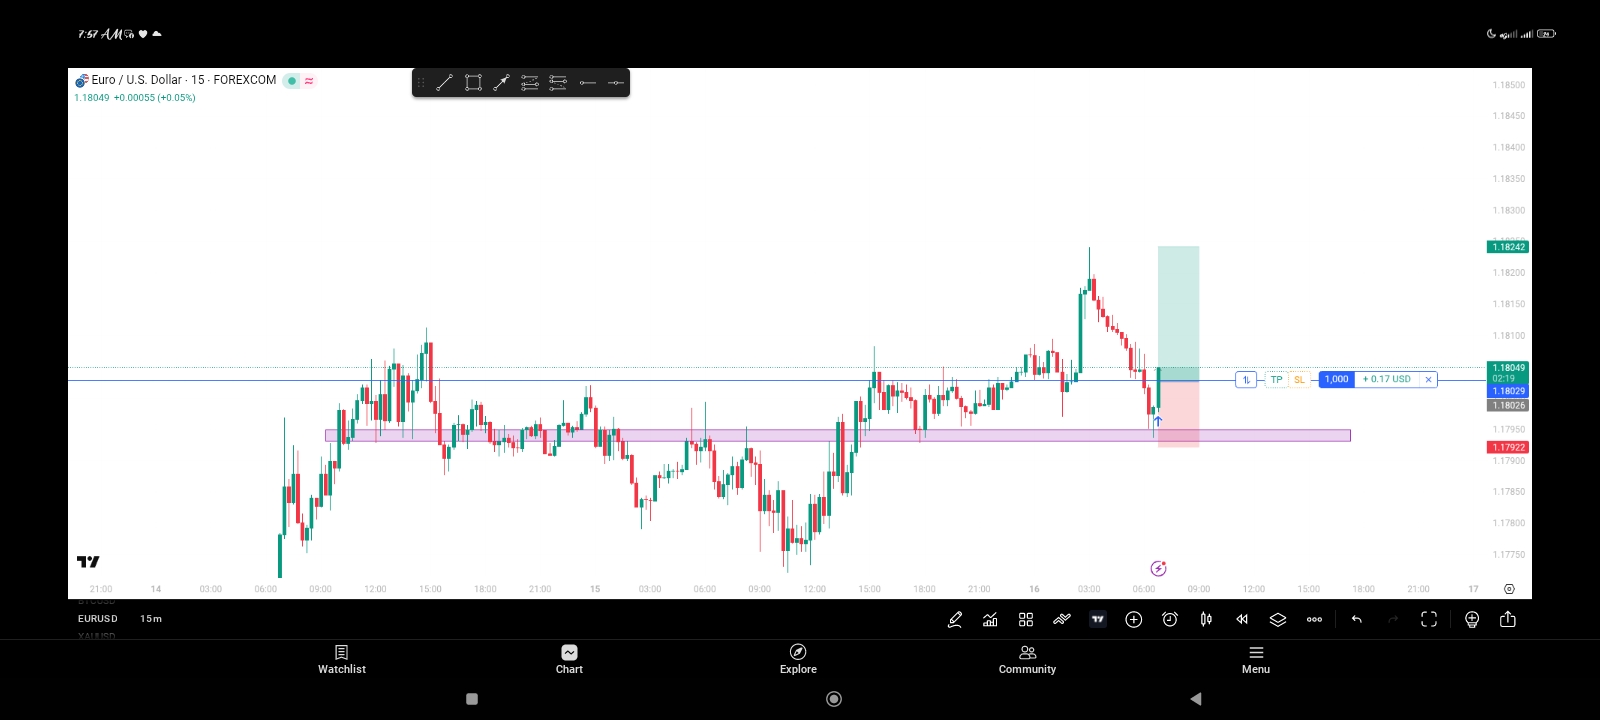
After confirming the direction on the higher timeframe, I came down to the 15-minute chart to find a precise entry. Here, I spotted another strong support zone that formed after a previous breakout this adds extra confirmation that buyers are defending this area.
π EUR/USD 15-Minute Trade Setup β Buy Opportunity
Pair: EUR/USD (Euro vs US Dollar)
Timeframe: 15 Minutes
π What's Happening?
The market has been moving downward, but there are strong signs it's getting ready to bounce back up. Here's how I spotted this opportunity:
π The Analysis (Step by Step)
Step 1 β Start with the Big Picture (1-Hour Chart)
Before jumping into any trade, I zoomed out to the 1-hour chart. Price was sitting right at a key support zone β a price level where buyers have historically stepped in and pushed the market back up. The market *rejected* that level, meaning sellers tried to push lower but failed. That was my first green light. π’
Step 2 β Drop Down to the 15-Minute Chart
After confirming the direction on the higher timeframe, I came down to the 15-minute chart to find a precise entry. Here, I spotted another strong support zone that formed after a previous breakout this adds extra confirmation that buyers are defending this area.
Step 3 β The Setup
Price is now hovering right at that support. I'm looking to BUY from this zone, expecting the market to push higher toward the green area shown on the chart.
π― Trade Plan
- Entry: Buy from the current support zone (~1.1749)
- Stop Loss: Below the support zone (red area), to protect the trade if the setup fails
- Take Profit: Upper green zone (~1.1840+)
π EUR/USD 15-Minute Trade Setup β Buy Opportunity
Pair: EUR/USD (Euro vs US Dollar)
Timeframe: 15 Minutes
π What's Happening?
The market has been moving downward, but there are strong signs it's getting ready to bounce back up. Here's how I spotted this opportunity:
π The Analysis (Step by Step)
Step 1 β Start with the Big Picture (1-Hour Chart)
Before jumping into any trade, I zoomed out to the 1-hour chart. Price was sitting right at a key support zone β a price level where buyers have historically stepped in and pushed the market back up. The market *rejected* that level, meaning sellers tried to push lower but failed. That was my first green light. π’
Step 2 β Drop Down to the 15-Minute Chart
After confirming the direction on the higher timeframe, I came down to the 15-minute chart to find a precise entry. Here, I spotted another strong support zone that formed after a previous breakout this adds extra confirmation that buyers are defending this area.
Beginner Tip
> Always confirm your trade idea on a higher timeframe first, then use a lower timeframe to find your entry. This is called Top-Down Analysis and it's one of the most powerful habits in trading.
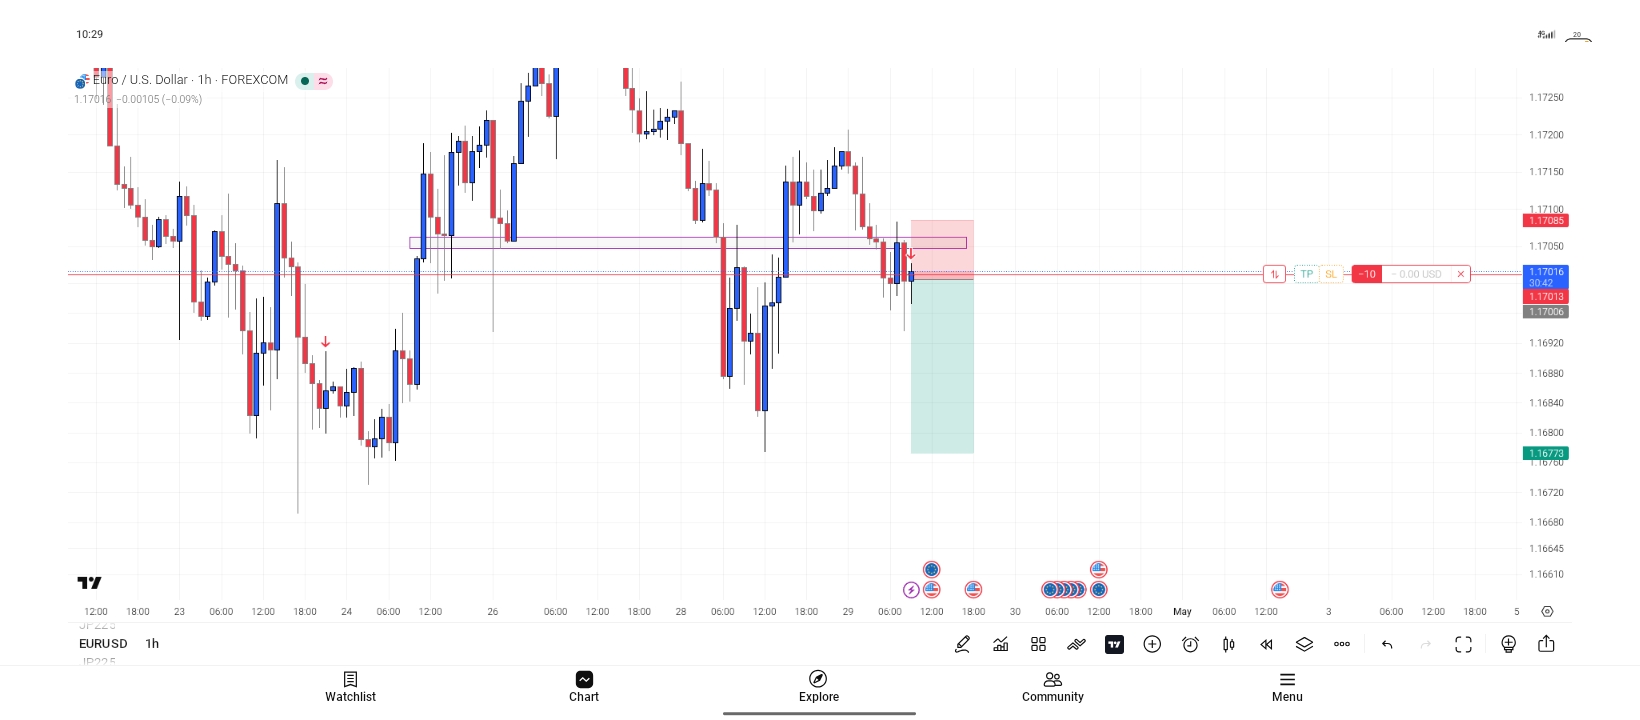
1 hour timeframe resistance
Engulfing candle on the 1 hour timeframe.
Taking sells
π Quick Trade Explanation
I took this trade from a 1-hour resistance zone.
What is a resistance zone?
Itβs like an invisible ceiling on the chart. Price has hit that level multiple times and struggled to go higher.
I waited for price to reach this ceiling on the 1-hour chart, saw it get rejected, and entered a sell trade expecting the price to drop.
Simple rules I followed:
- Clear resistance level on 1H chart
- Waited for rejection
- Proper stop-loss above the zone
- Good risk-reward target
Key lesson: Trade from important zones instead of random entries.
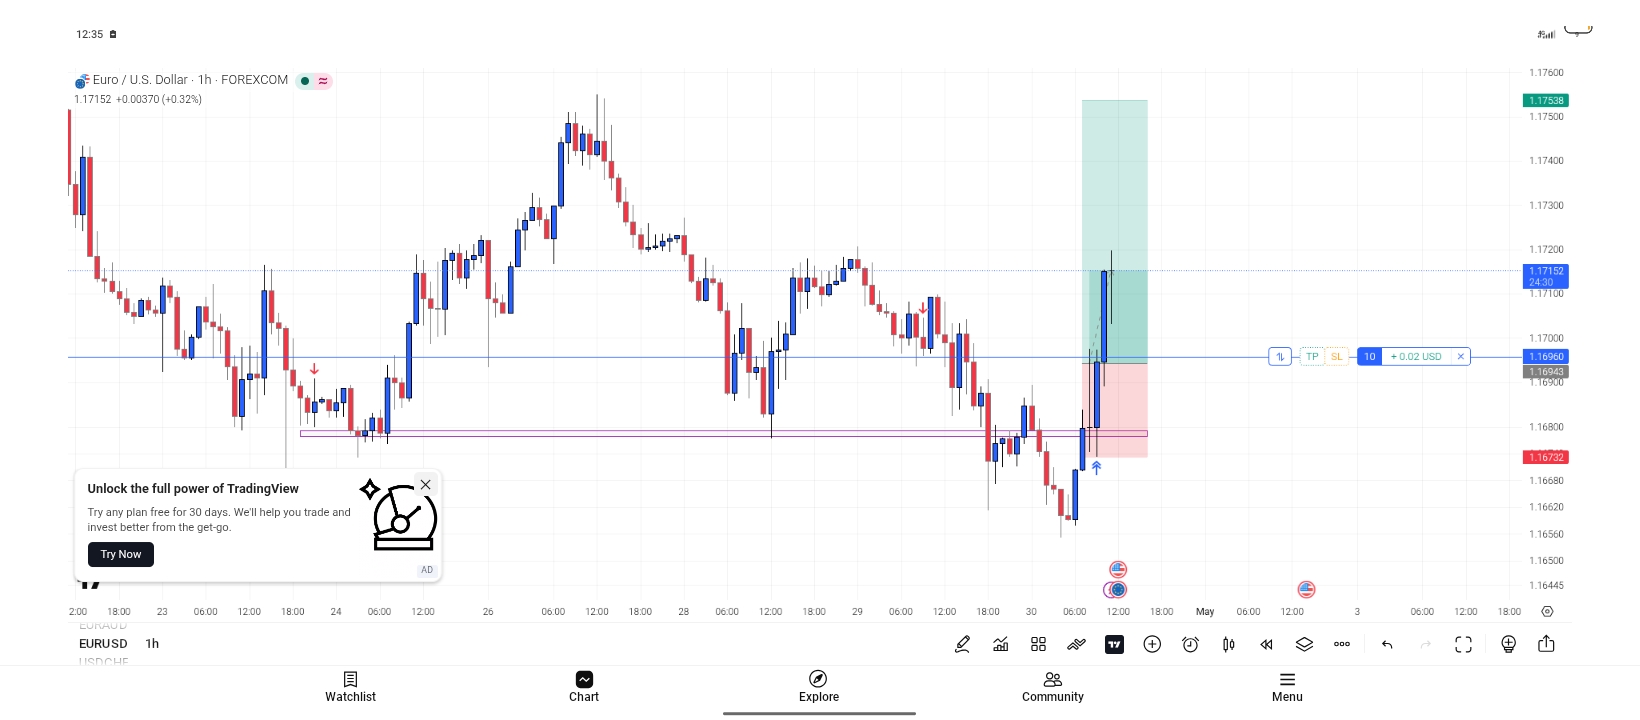
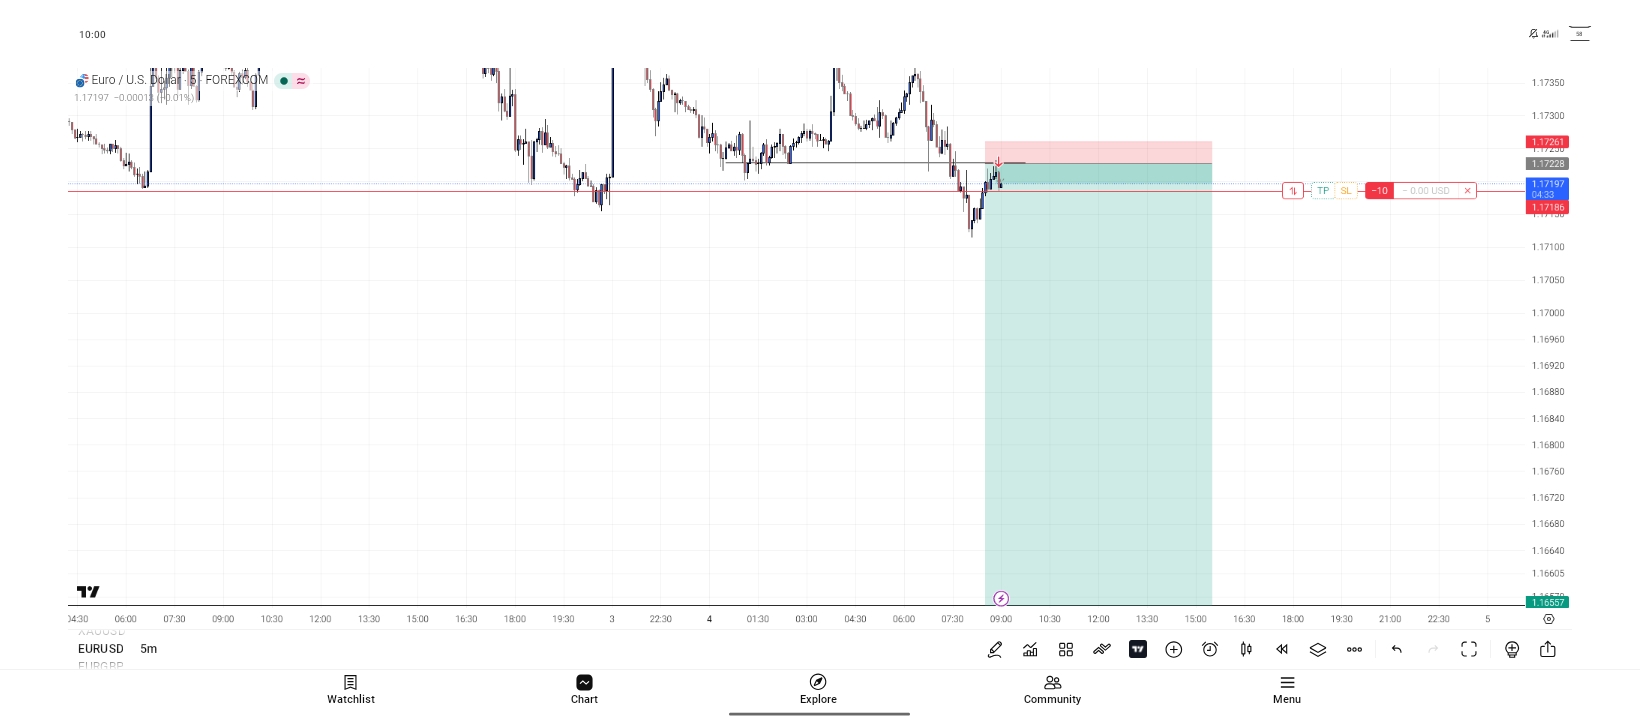
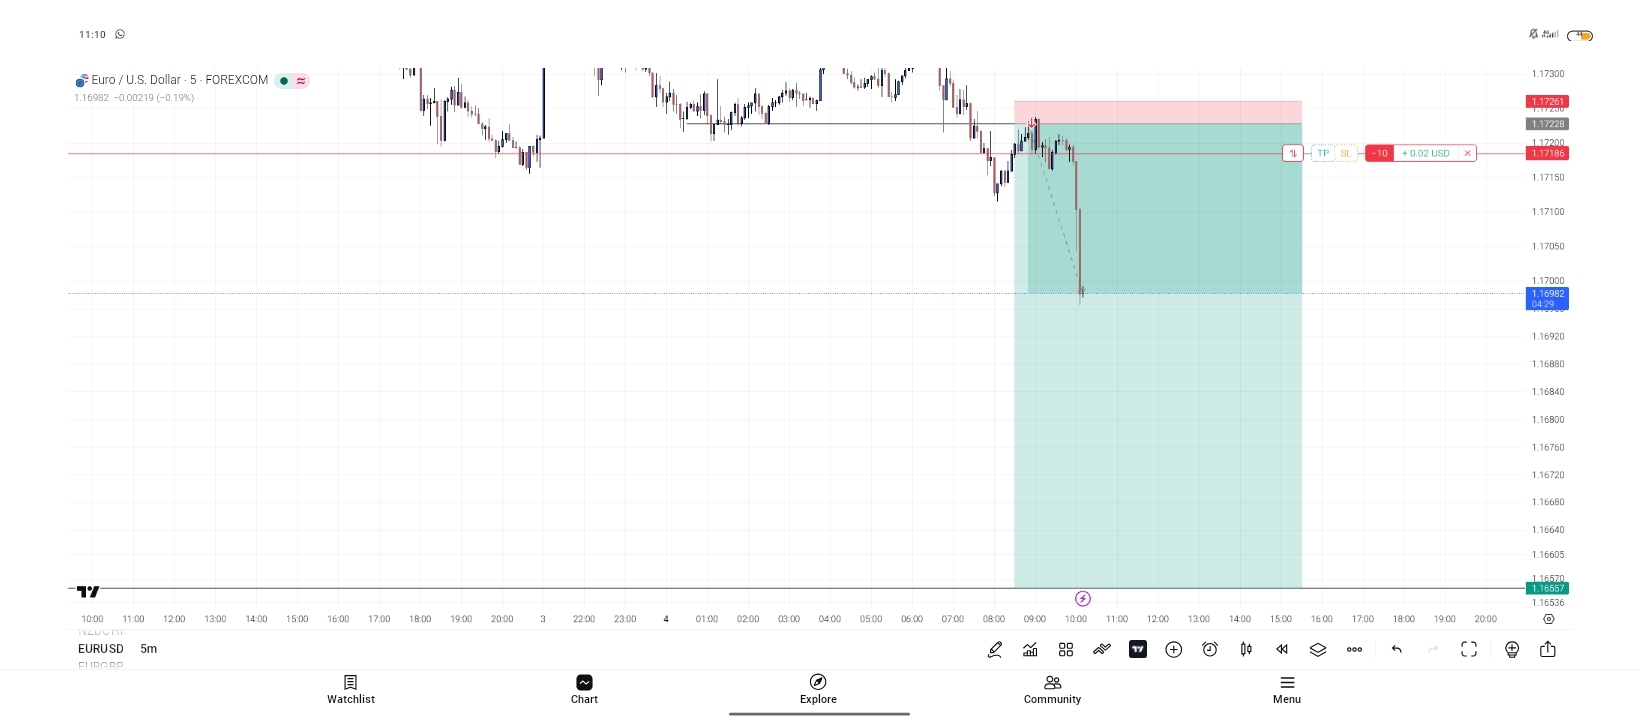
Trade is moving in my direction... TP hopefully
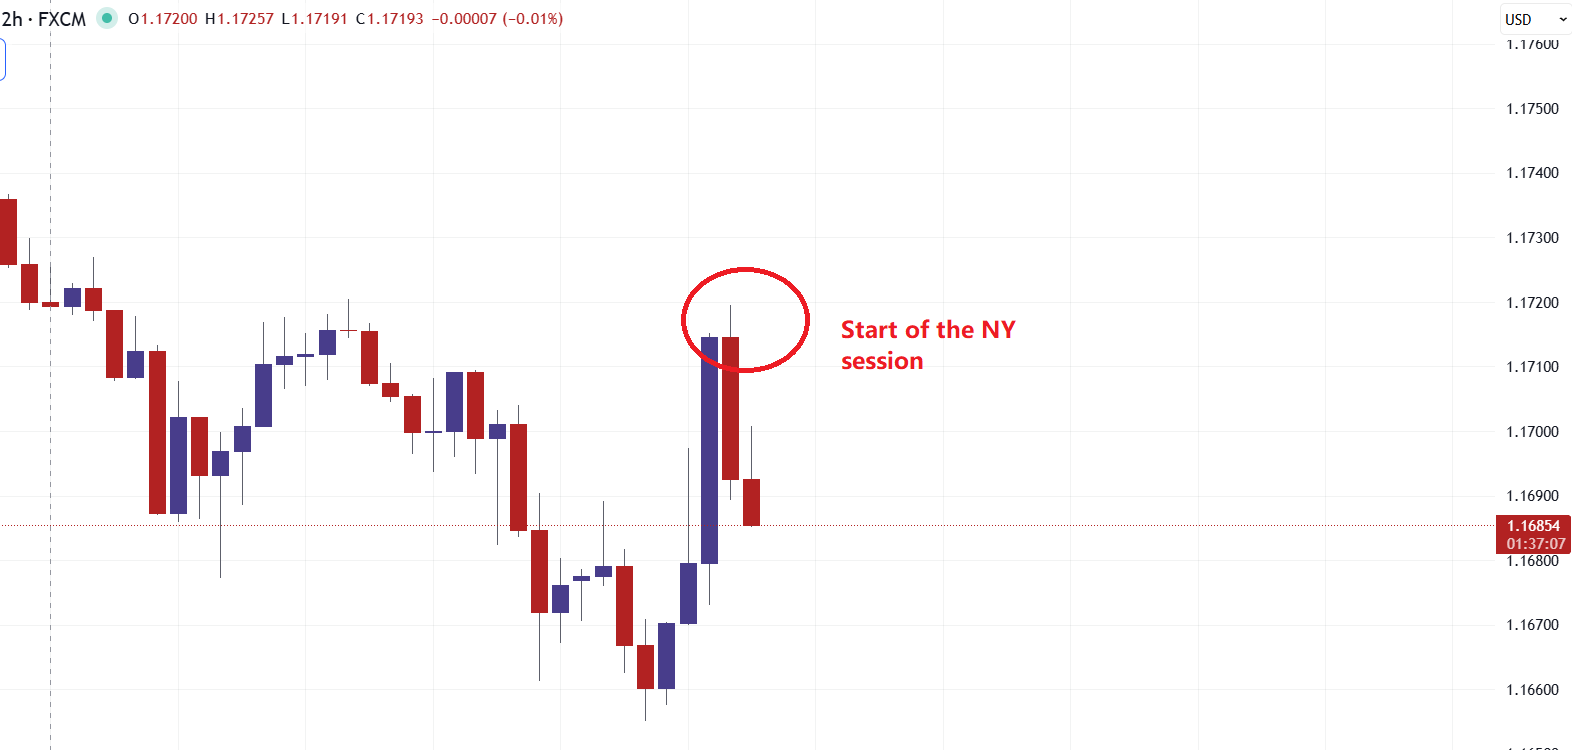
Each session can follow or fade the previous session. Attached is the 2H chart. The next session at it's start is just fading the Franky/London move.
I am seeing that your entry is during late London session, is there a reason for it?
Franky faded the Asian session move. In my experience & as per data, most edges of the day are set of Frankfurt & London pair. Today the low of the day was during Asian, Franky did not even challenge or fake that low, so I would have faded at 12PM. I don't trust the Asian lows. I could be wrong.
I don't trade the NY session, so I did not short it, but that is the high for now. 12PM London time is the start of NY session (pre NY).
Each session can follow or fade the previous session. Attached is the 2H chart. The next session at it's start is just fading the Franky/London move.
I am seeing that your entry is during late London session, is there a reason for it?
Franky faded the Asian session move. In my experience & as per data, most edges of the day are set of Frankfurt & London pair. Today the low of the day was during Asian, Franky did not even challenge or fake that low, so I would have faded at 12PM. I don't trust the Asian lows. I could be wrong.
I don't trade the NY session, so I did not short it, but that is the high for now. 12PM London time is the start of NY session (pre NY).
You're right that the next session (NY) is fading the Franky/London directional move, as the circled candle at the NY open shows a strong rejection after an initial push higher (that tall blue/red combo around the 1.1720 area). Classic session fade behavior when momentum from the prior session doesn't carry through with conviction.
Trade is moving in my direction... TP hopefully
My entry was placed during late London because that's where the price action showed the clearest setup completion based on the structure we were watching specifically, the failure to sustain the upside after testing key levels from the Franky/London push.
Each session can follow or fade the previous session. Attached is the 2H chart. The next session at it's start is just fading the Franky/London move.
I am seeing that your entry is during late London session, is there a reason for it?
Franky faded the Asian session move. In my experience & as per data, most edges of the day are set of Frankfurt & London pair. Today the low of the day was during Asian, Franky did not even challenge or fake that low, so I would have faded at 12PM. I don't trust the Asian lows. I could be wrong.
I don't trade the NY session, so I did not short it, but that is the high for now. 12PM London time is the start of NY session (pre NY).
The Frankfurt + early/mid London window often sets the day's primary edge (as you noted from your data/experience), and today the pair didn't even properly challenge or fake the Asian low, which aligns with your point about not trusting Asian extremes. That reduced the conviction for an earlier fade at the 12 PM London / pre-NY mark for me. Instead, the late London period gave a cleaner reaction at resistance, with better risk definition relative to the recent swing.
I prioritize where the discretionary confirmation lines up (candle structure, volume profile at that time, or order flow signs) over strictly forcing an entry at session open, especially on a fade play. Late London can still carry solid liquidity before the NY handover, though I completely get preferring to stay out of pure NY action if that's your style.
π¨ EUR/USD Trade Breakdown | CRT Strategy (Continuation Entry)
Trade Direction: Short
Timeframes Used: 2H (for direction & structure) β 15M + 5M (for entry)
Strategy: Candle Range Theory (CRT) β Liquidity Sweep + POI
π¨ EUR/USD Trade Breakdown | CRT Strategy (Continuation Entry)
Trade Direction: Short
Timeframes Used: 2H (for direction & structure) β 15M + 5M (for entry)
Strategy: Candle Range Theory (CRT) β Liquidity Sweep + POI
Why I took this trade:
1. Higher Timeframe Structure β Clear resistance level on the 2H timeframe
2. Double Break of Structure β Confirmed on both 15-minute and 2-hour for bearish continuation.
3. Liquidity Sweepβ Price swept above the resistance, taking out buy-side liquidity (classic inducement).
4. POI + Market Structure β High-probability reversal zone after the sweep.
5. Continuation Entry β Entered on the lower timeframe (5M) after displacement and confirmation.
Entry: Around 1.1720 - 1.1719 zone (after the sweep and BOS)
Stop Loss: Above the breaker Block
Take Profit: Targeting next liquidity pool below (marked on chart)
The big green zone you see is the profit area running after price broke down strongly.
π¨ EUR/USD Trade Breakdown | CRT Strategy (Continuation Entry)
Trade Direction: Short
Timeframes Used: 2H (for direction & structure) β 15M + 5M (for entry)
Strategy: Candle Range Theory (CRT) β Liquidity Sweep + POI
This was a textbook CRT setup: Liquidity grab β Fair Value Gap / POI reaction β Strong displacement lower.
Risk Management: 1:20 RR+ (very favorable due to the sweep and structure)
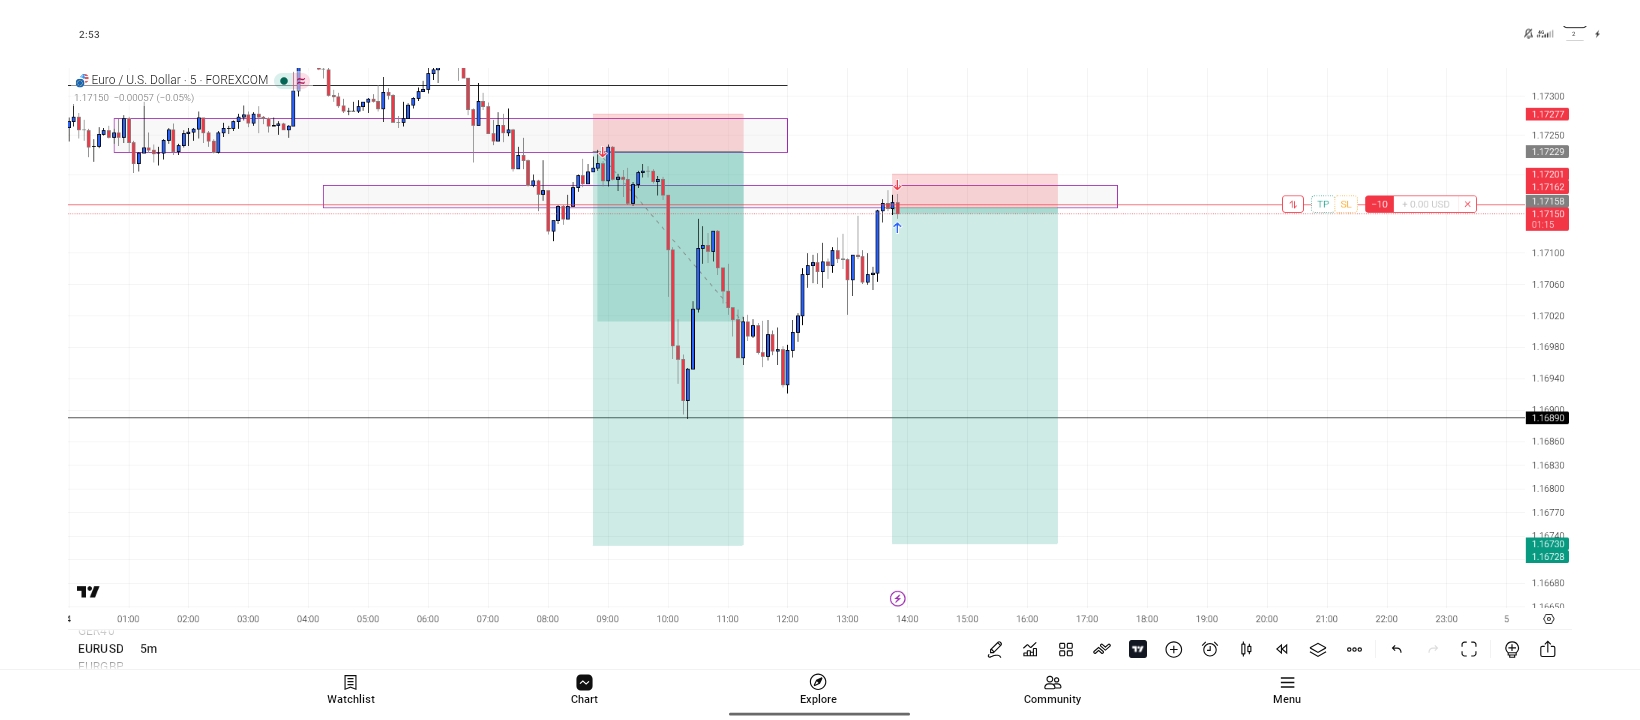
Our trade so far
Market is now gifting us another sell opportunity
what happened to the other trade you took?