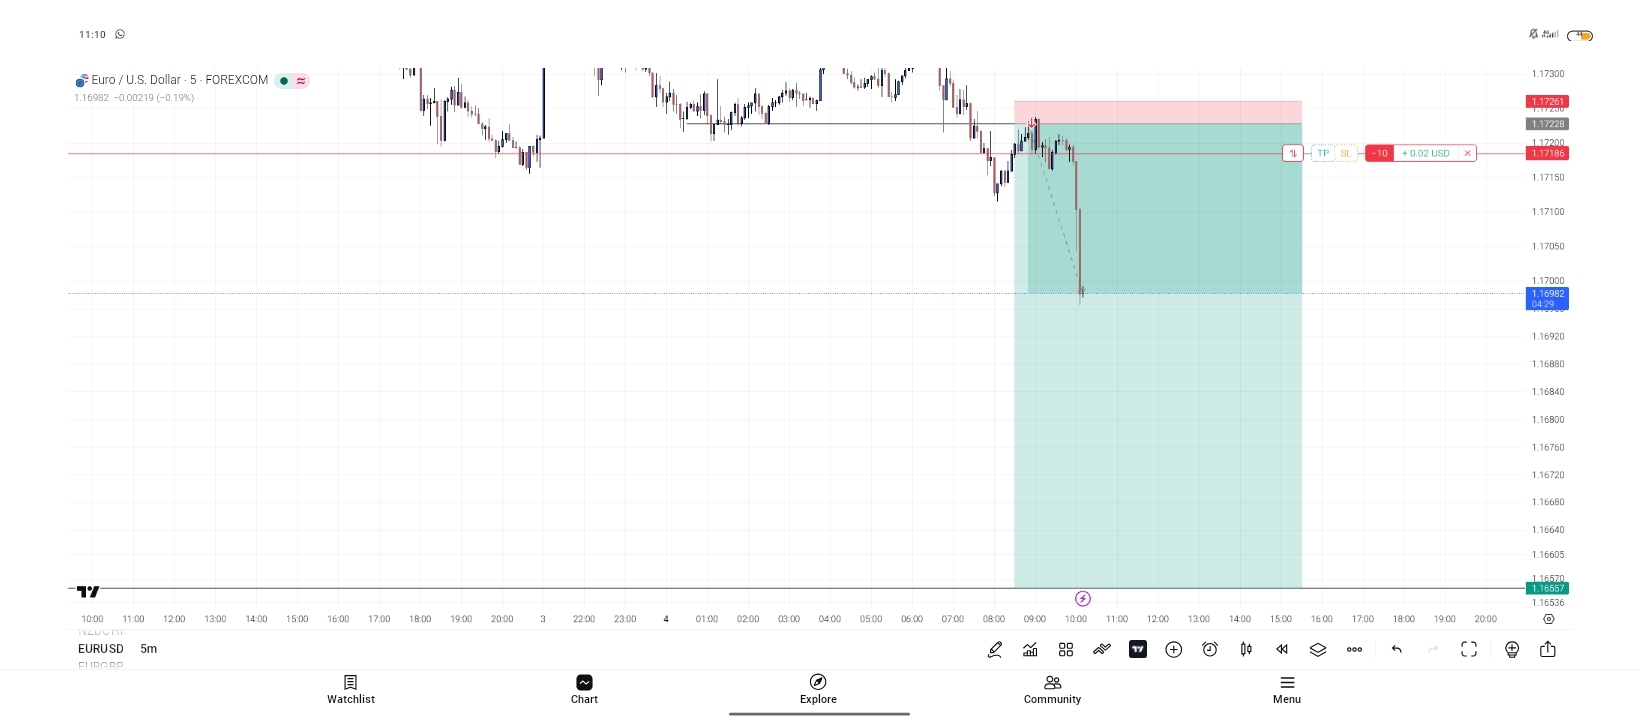
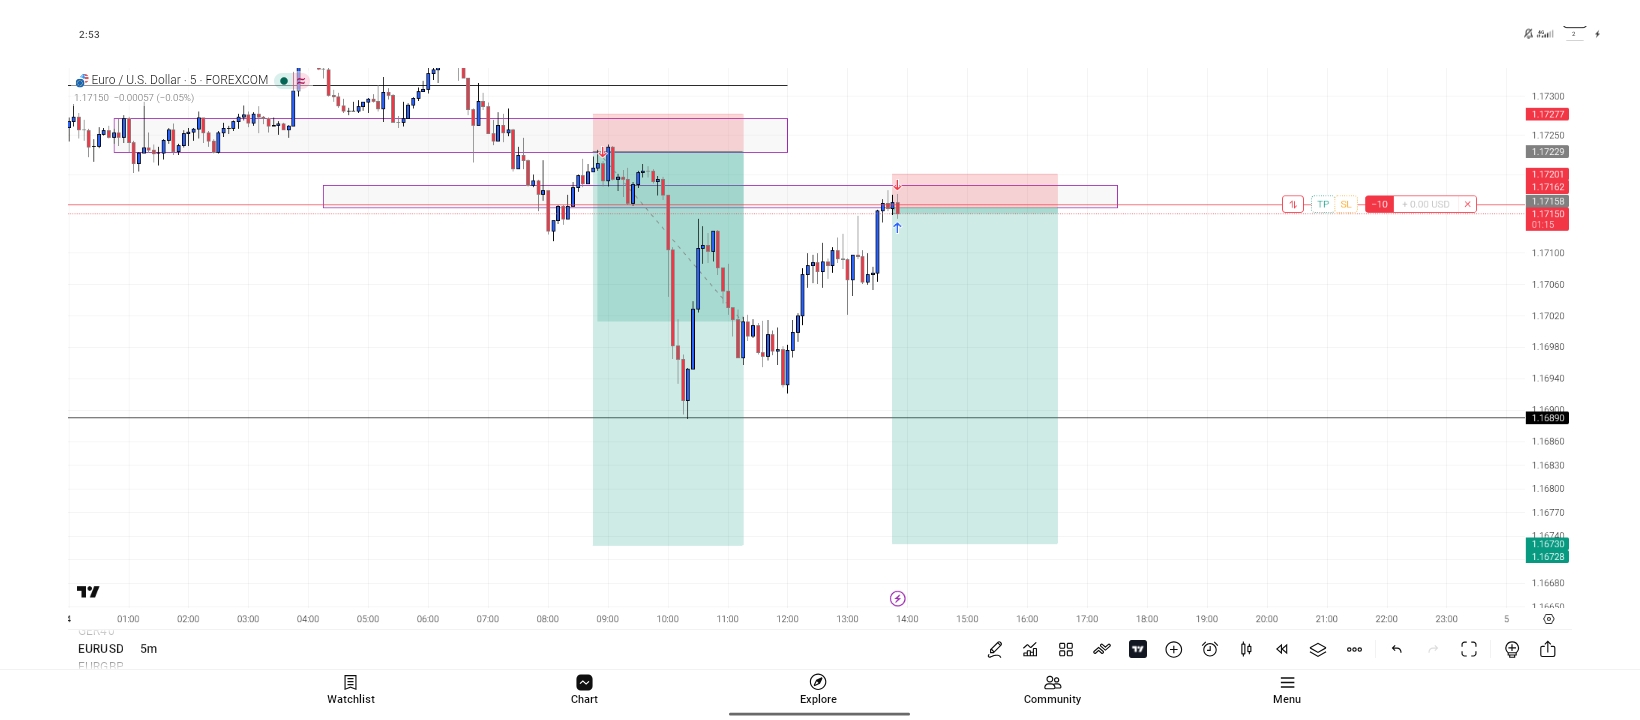
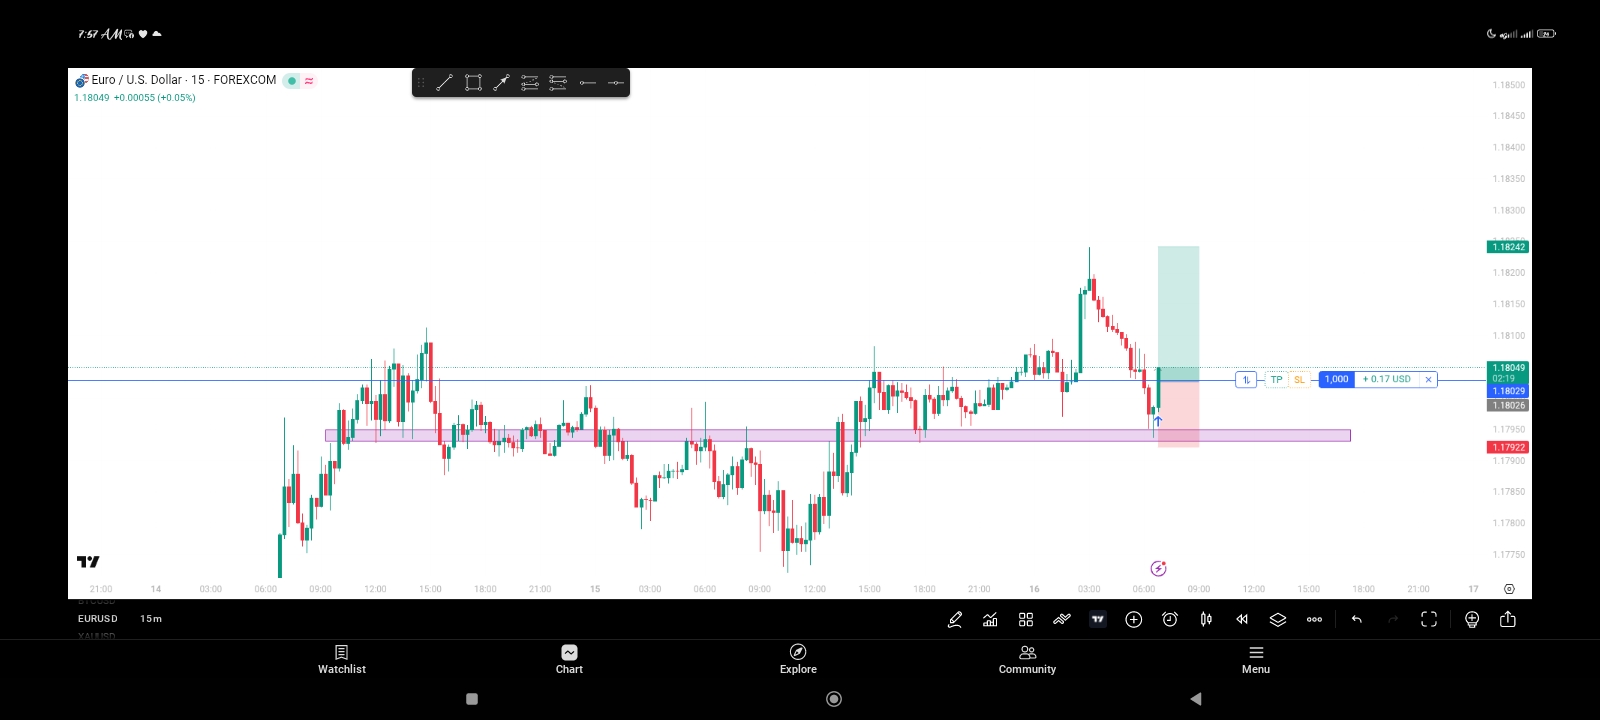
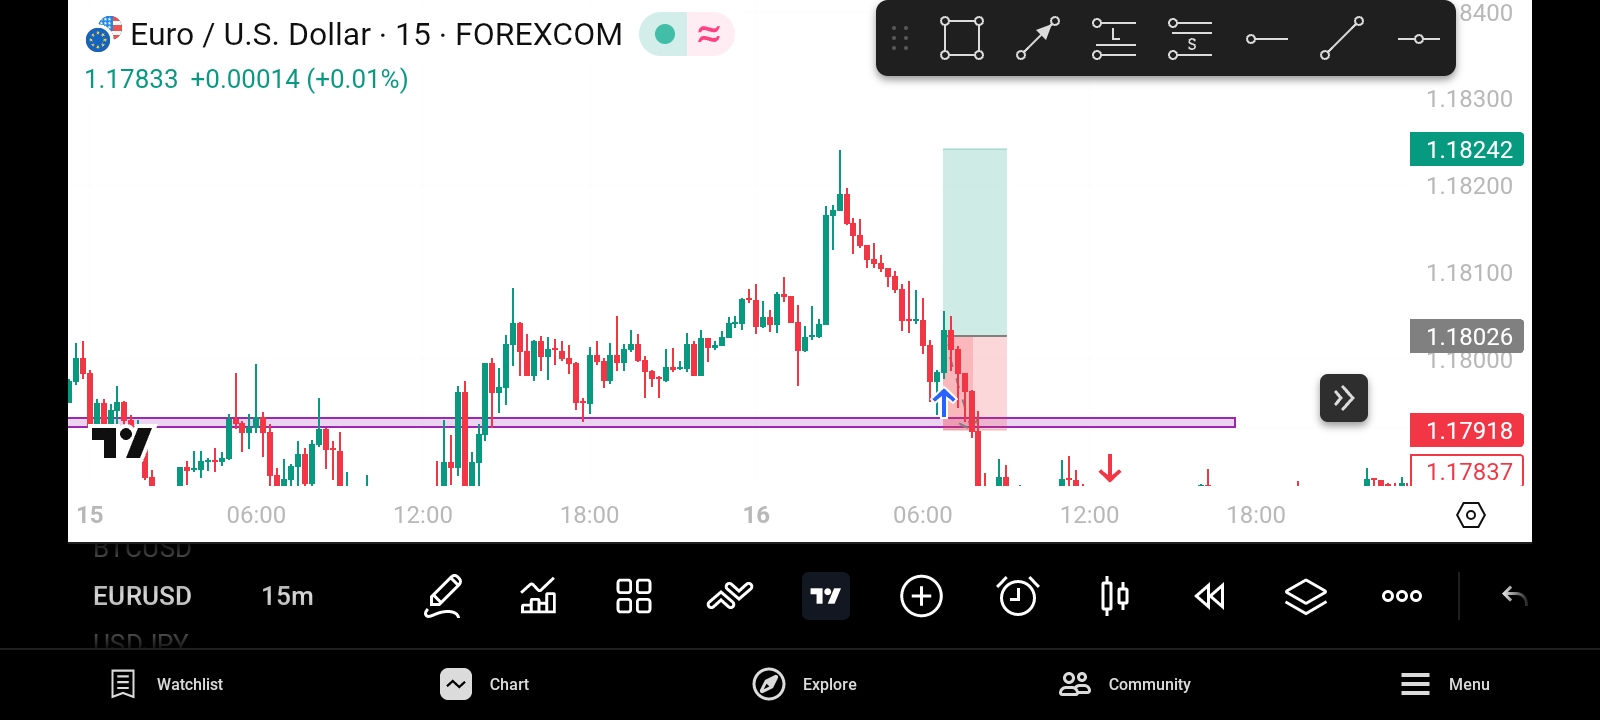
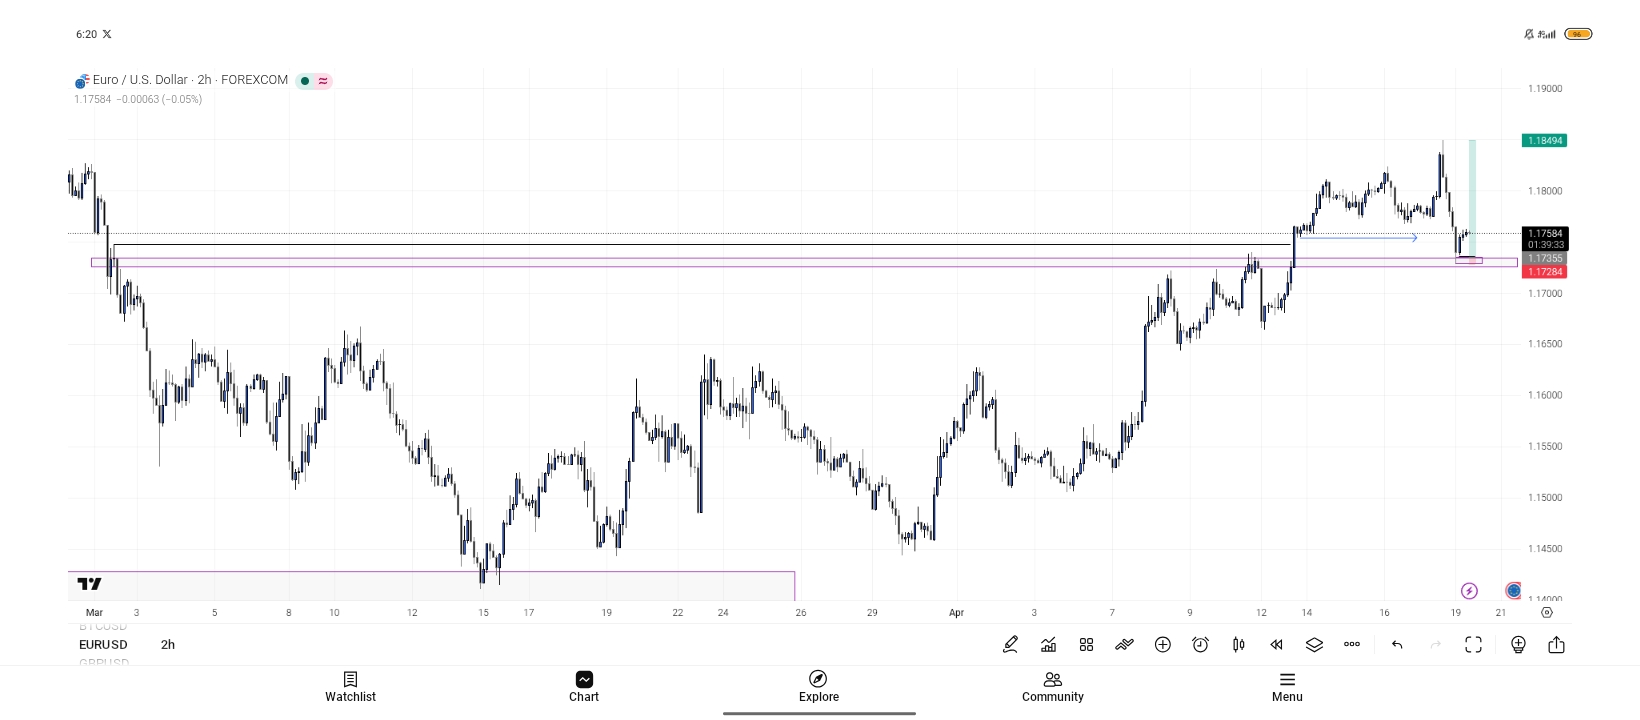
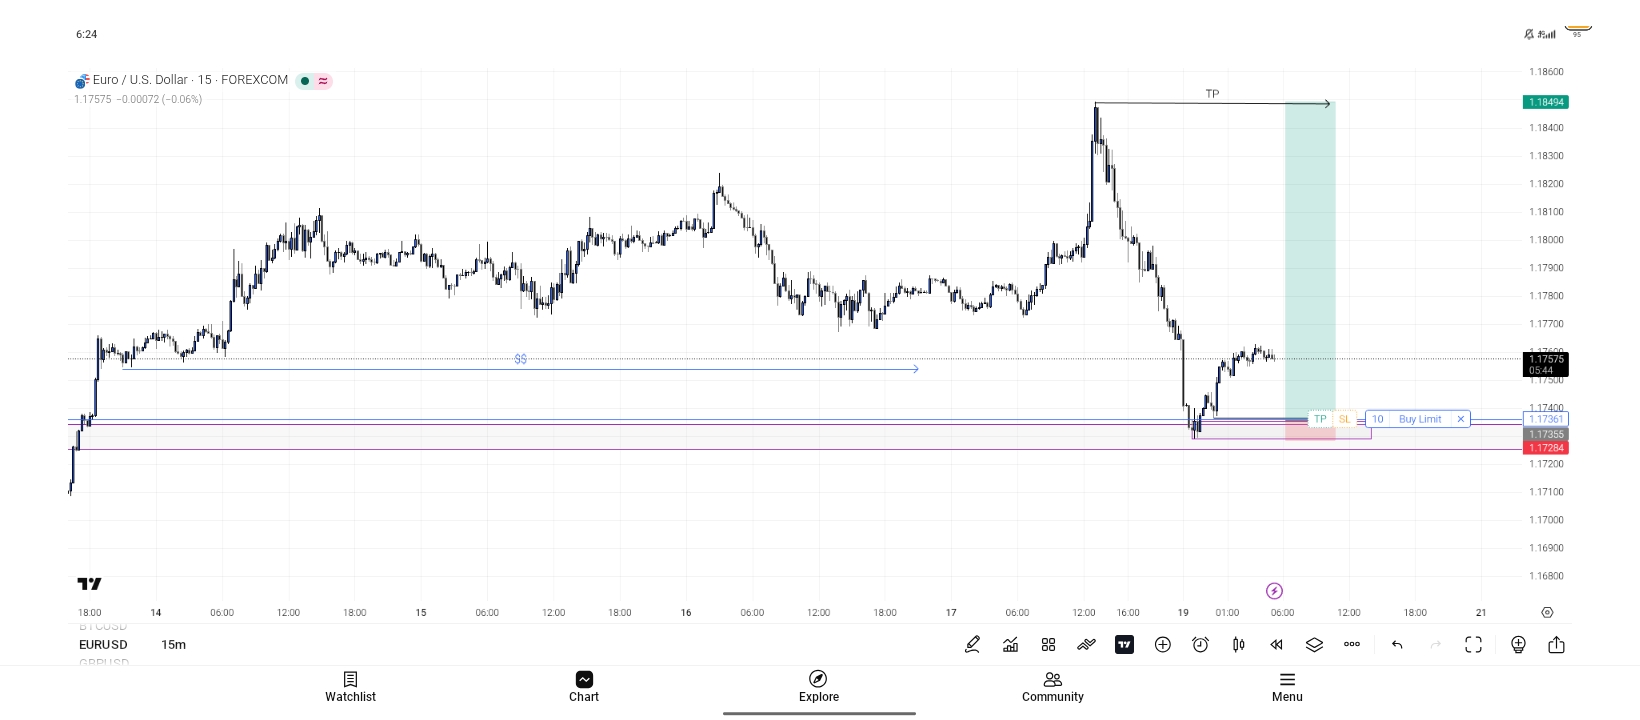
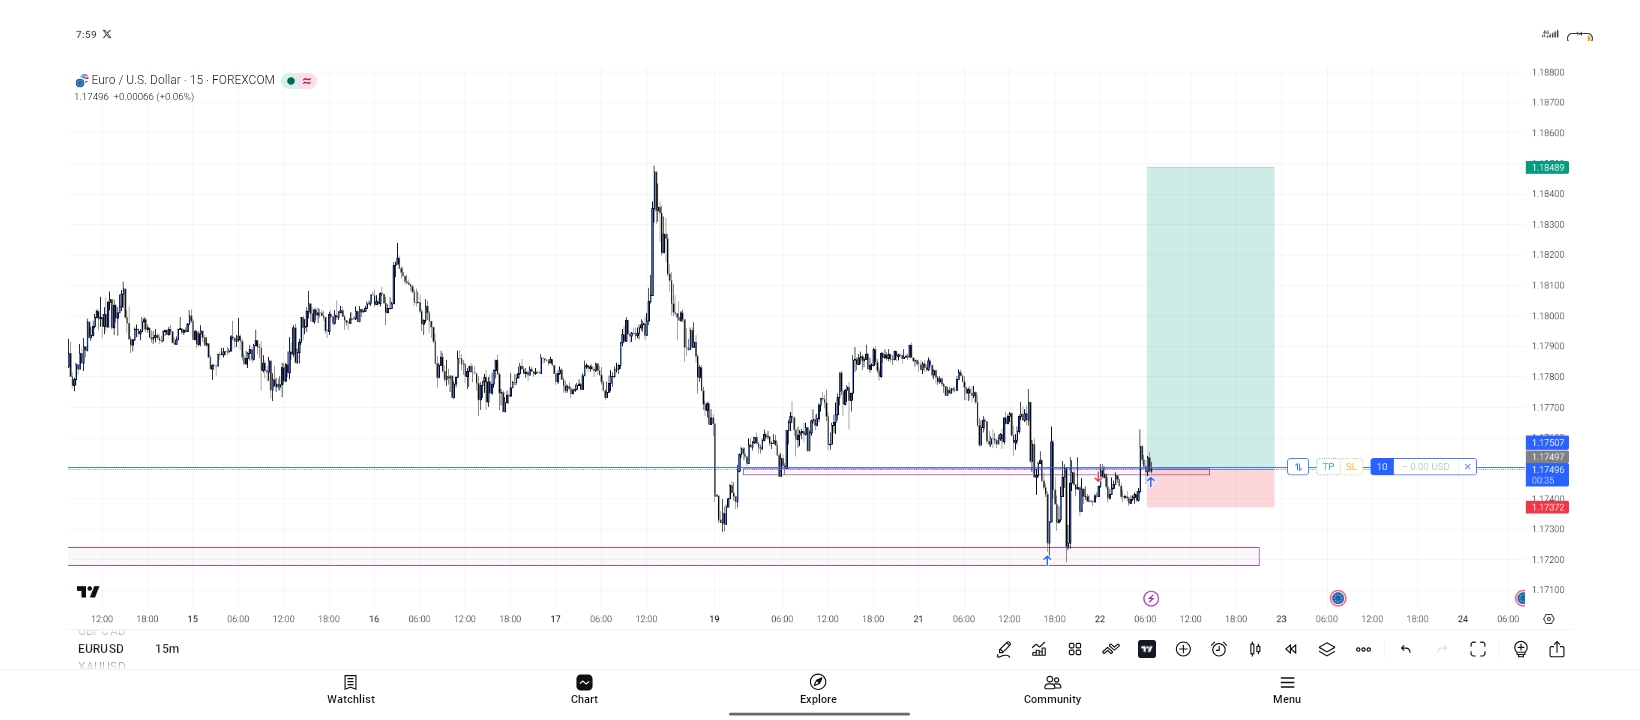
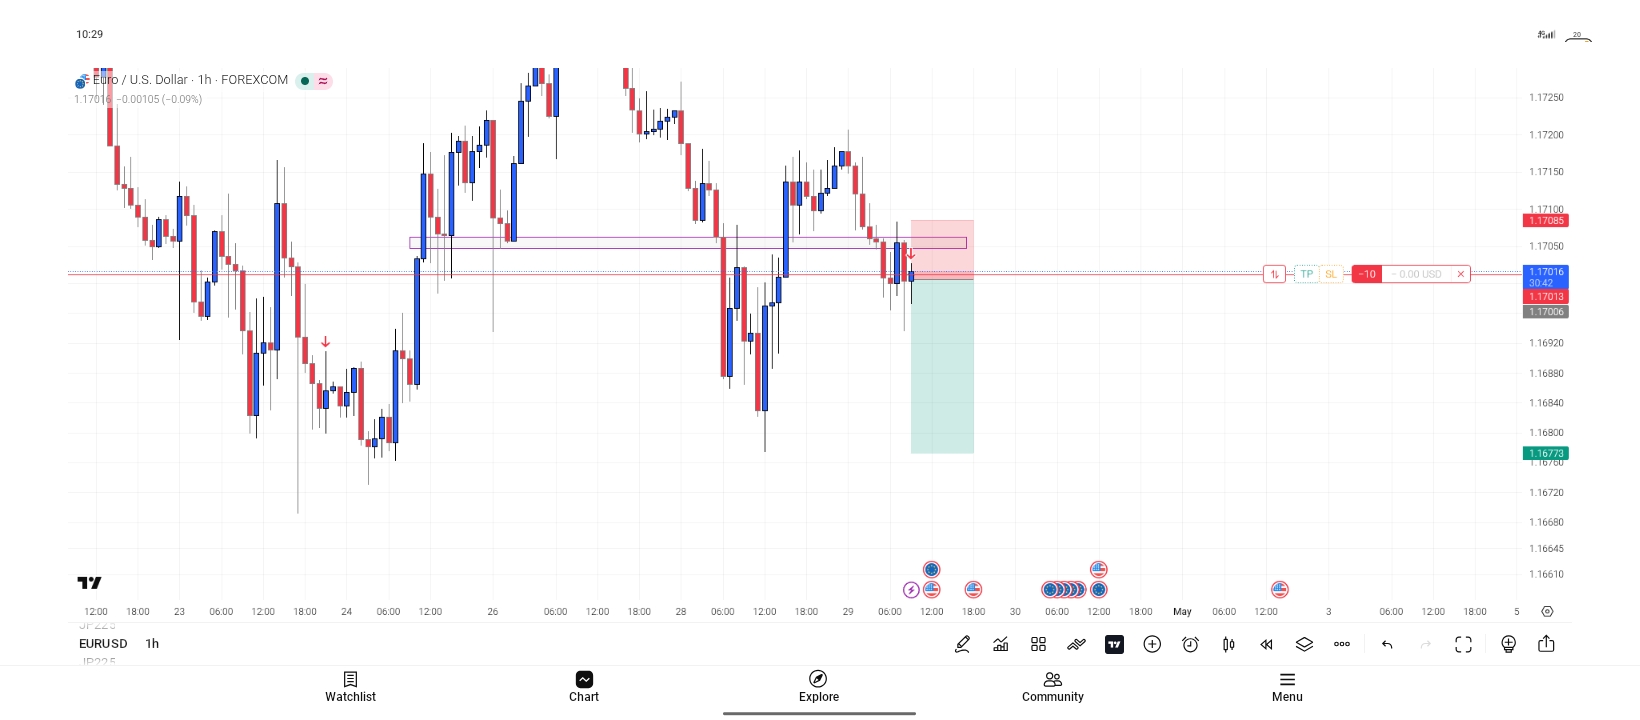
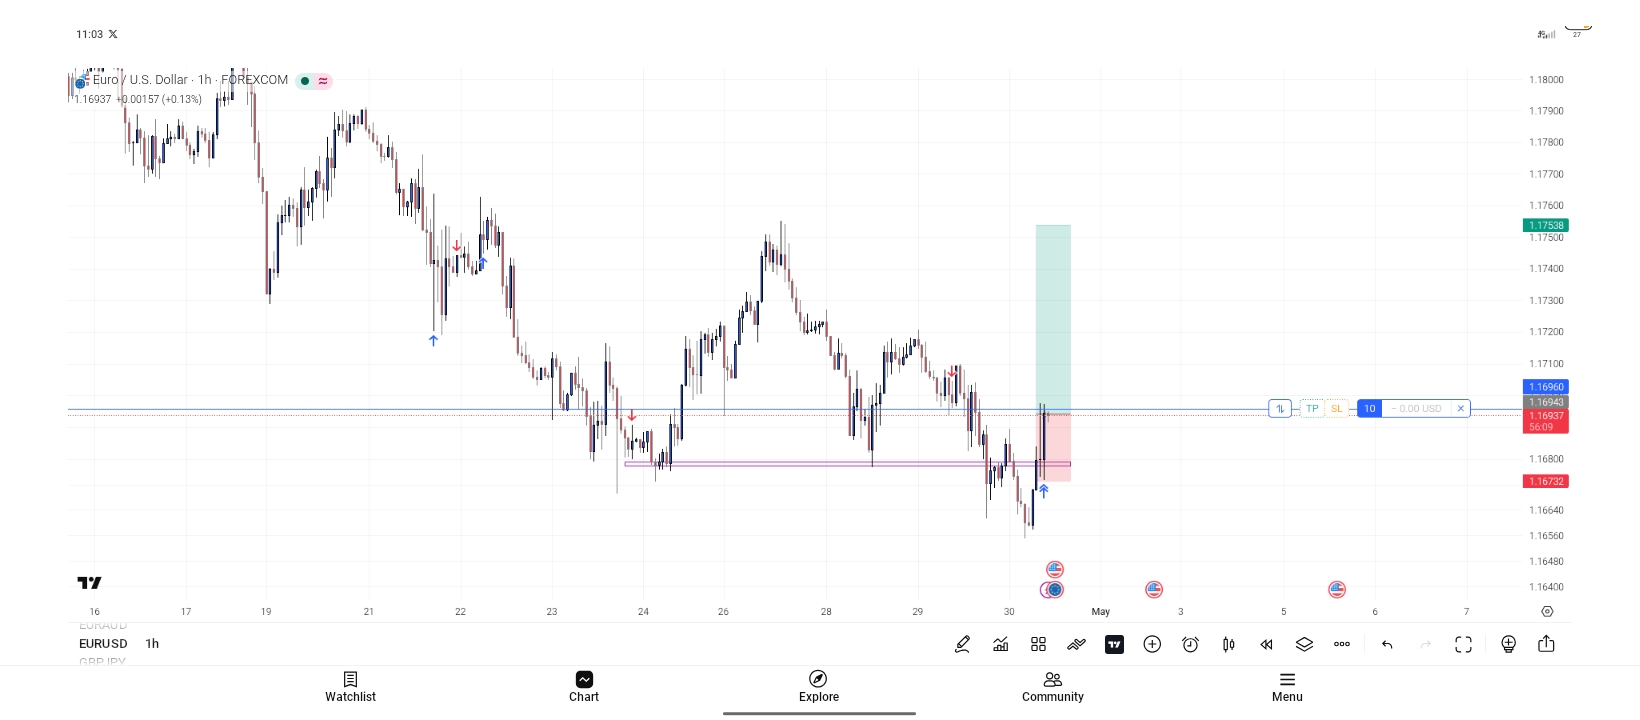
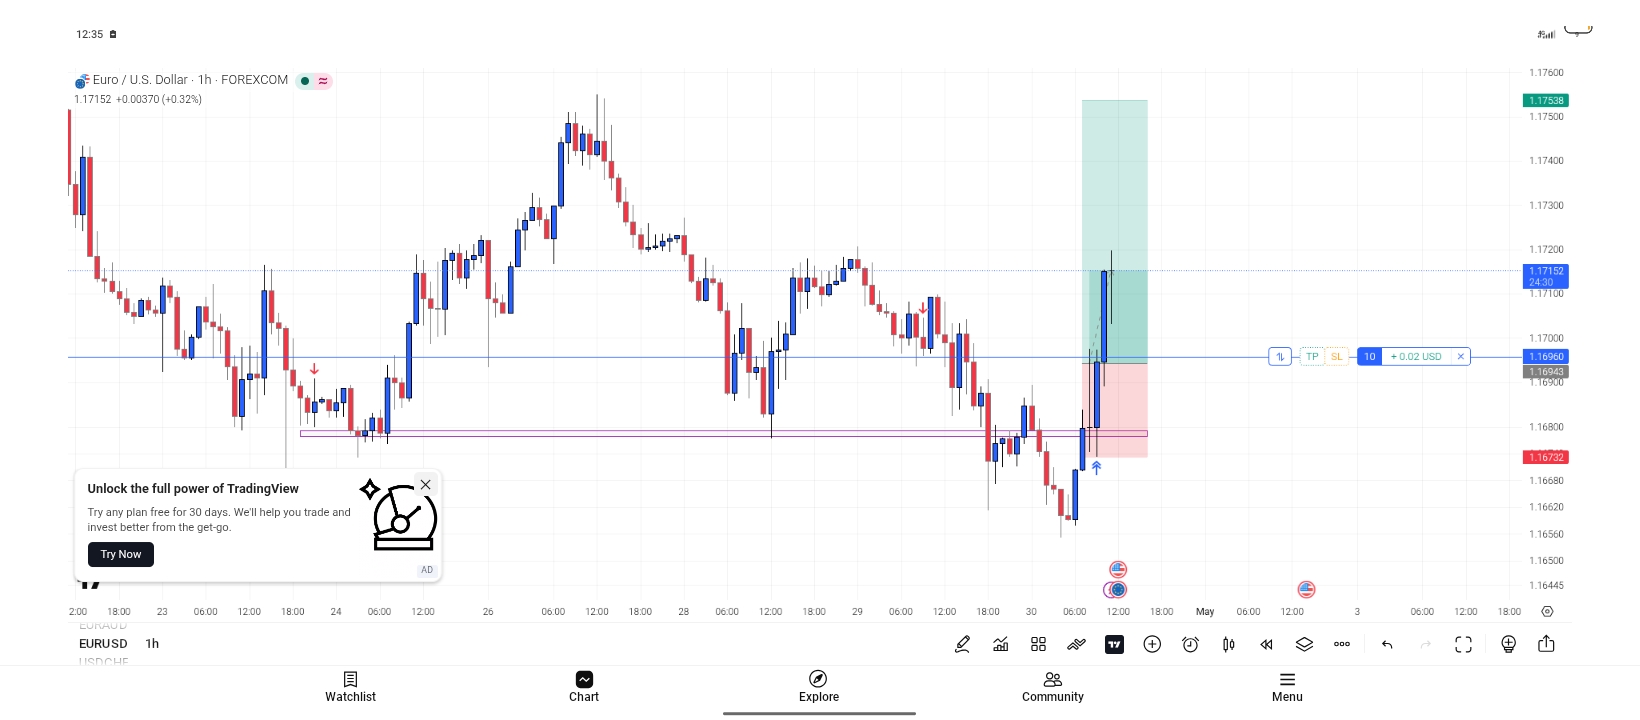
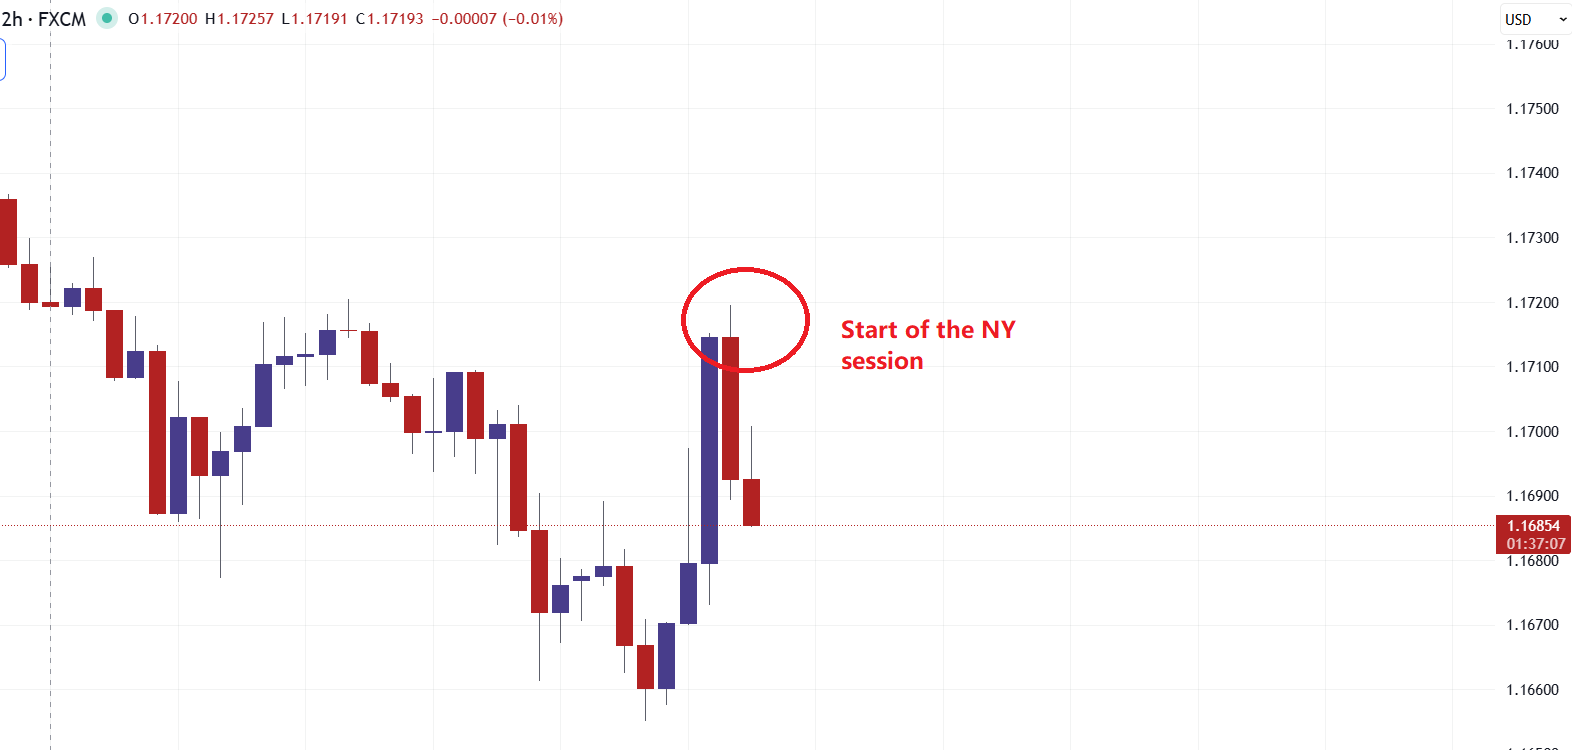
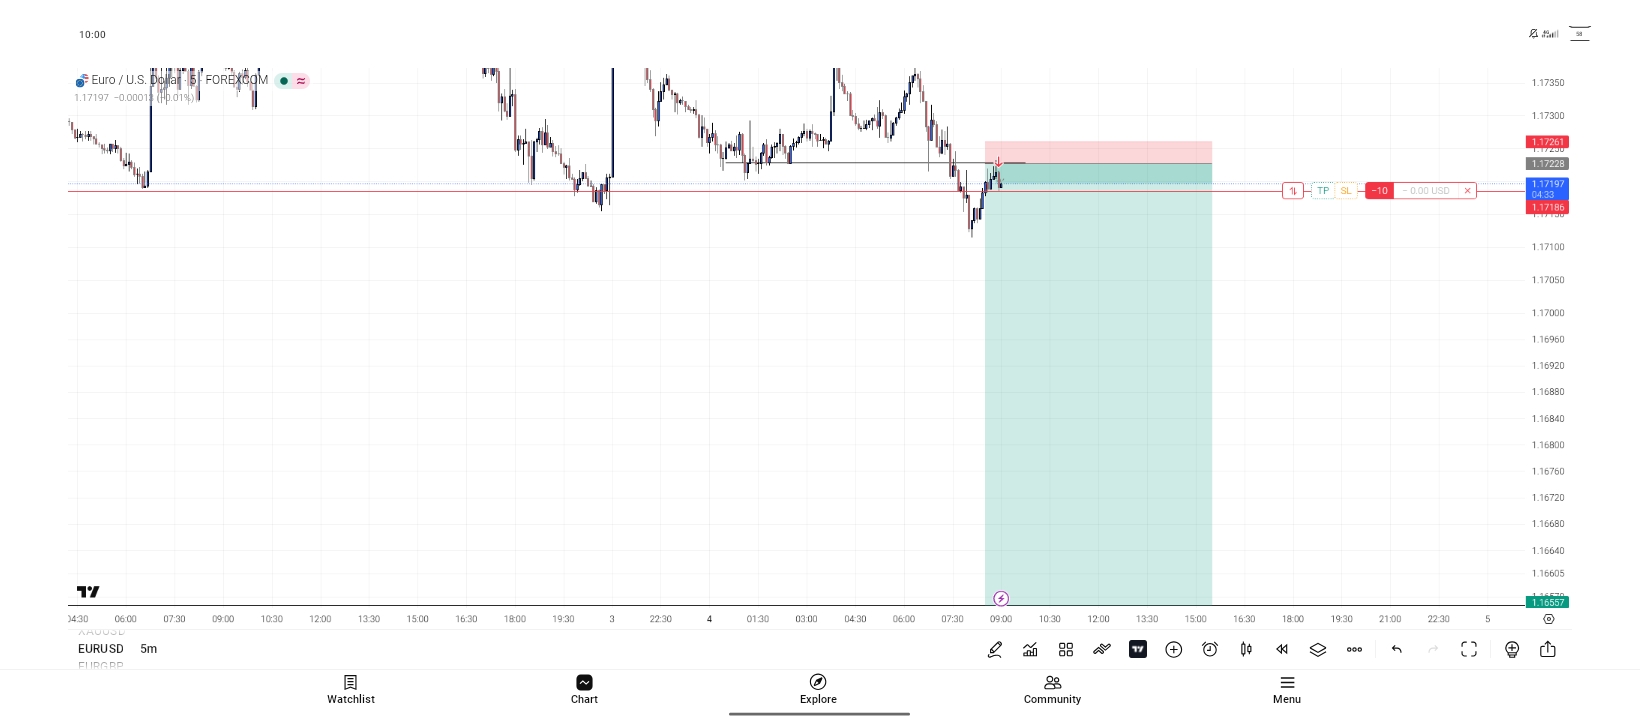
EURUSD quick scalp

ยซ Previous 1 2

Directional Bias on higher timeframe.

Entry on 15 minutes resistance zone

London session

TP at resent high

G
@godswillfx - 2 months ago

I will be dropping updates on this trade.

G
@godswillfx - 2 months ago

Took a loss on this

G
@godswillfx - 1 month ago

A quick setup up on EURUSD

1:13 RR

I Saw a two hour break of structure, market came back to react on our zone and gave a 15 minutes Mss liquidity and our POI

G
@godswillfx - 1 month ago

๐Ÿ“Š EUR/USD 15-Minute Trade Setup โ€” Buy Opportunity

Pair: EUR/USD (Euro vs US Dollar)

Timeframe: 15 Minutes

๐Ÿ” What's Happening?

The market has been moving downward, but there are strong signs it's getting ready to bounce back up. Here's how I spotted this opportunity:

๐Ÿ“ The Analysis (Step by Step)

Step 1 โ€” Start with the Big Picture (1-Hour Chart)

Before jumping into any trade, I zoomed out to the 1-hour chart. Price was sitting right at a key support zone โ€” a price level where buyers have historically stepped in and pushed the market back up. The market *rejected* that level, meaning sellers tried to push lower but failed. That was my first green light. ๐ŸŸข

Step 2 โ€” Drop Down to the 15-Minute Chart

After confirming the direction on the higher timeframe, I came down to the 15-minute chart to find a precise entry. Here, I spotted another strong support zone that formed after a previous breakout this adds extra confirmation that buyers are defending this area.

G
@godswillfx - 1 month ago

1 hour timeframe resistance

Engulfing candle on the 1 hour timeframe.

Taking sells

G
@godswillfx - 1 month ago

๐Ÿ“Š Quick Trade Explanation

I took this trade from a 1-hour resistance zone.

What is a resistance zone?

Itโ€™s like an invisible ceiling on the chart. Price has hit that level multiple times and struggled to go higher.

I waited for price to reach this ceiling on the 1-hour chart, saw it get rejected, and entered a sell trade expecting the price to drop.

Simple rules I followed:

- Clear resistance level on 1H chart

- Waited for rejection

- Proper stop-loss above the zone

- Good risk-reward target

Key lesson: Trade from important zones instead of random entries.

K
@karbin - 1 month ago
Quoted - godswillfx

Trade is moving in my direction... TP hopefully

Each session can follow or fade the previous session. Attached is the 2H chart. The next session at it's start is just fading the Franky/London move.

I am seeing that your entry is during late London session, is there a reason for it?

Franky faded the Asian session move. In my experience & as per data, most edges of the day are set of Frankfurt & London pair. Today the low of the day was during Asian, Franky did not even challenge or fake that low, so I would have faded at 12PM. I don't trust the Asian lows. I could be wrong.

I don't trade the NY session, so I did not short it, but that is the high for now. 12PM London time is the start of NY session (pre NY).

G
@godswillfx - 1 month ago
Quoted - godswillfx

Trade is moving in my direction... TP hopefully

On the entry timing (late London session):

My entry was placed during late London because that's where the price action showed the clearest setup completion based on the structure we were watching specifically, the failure to sustain the upside after testing key levels from the Franky/London push.

G
@godswillfx - 1 month ago
Quoted - karbin

Each session can follow or fade the previous session. Attached is the 2H chart. The next session at it's start is just fading the Franky/London move.

I am seeing that your entry is during late London session, is there a reason for it?

Franky faded the Asian session move. In my experience & as per data, most edges of the day are set of Frankfurt & London pair. Today the low of the day was during Asian, Franky did not even challenge or fake that low, so I would have faded at 12PM. I don't trust the Asian lows. I could be wrong.

I don't trade the NY session, so I did not short it, but that is the high for now. 12PM London time is the start of NY session (pre NY).

The Frankfurt + early/mid London window often sets the day's primary edge (as you noted from your data/experience), and today the pair didn't even properly challenge or fake the Asian low, which aligns with your point about not trusting Asian extremes. That reduced the conviction for an earlier fade at the 12 PM London / pre-NY mark for me. Instead, the late London period gave a cleaner reaction at resistance, with better risk definition relative to the recent swing.

I prioritize where the discretionary confirmation lines up (candle structure, volume profile at that time, or order flow signs) over strictly forcing an entry at session open, especially on a fade play. Late London can still carry solid liquidity before the NY handover, though I completely get preferring to stay out of pure NY action if that's your style.

G
@godswillfx - 1 month ago

๐Ÿšจ EUR/USD Trade Breakdown | CRT Strategy (Continuation Entry)

Trade Direction: Short

Timeframes Used: 2H (for direction & structure) โ†’ 15M + 5M (for entry)

Strategy: Candle Range Theory (CRT) โ€“ Liquidity Sweep + POI

G
@godswillfx - 1 month ago
Quoted - godswillfx

๐Ÿšจ EUR/USD Trade Breakdown | CRT Strategy (Continuation Entry)

Trade Direction: Short

Timeframes Used: 2H (for direction & structure) โ†’ 15M + 5M (for entry)

Strategy: Candle Range Theory (CRT) โ€“ Liquidity Sweep + POI

Why I took this trade:

1. Higher Timeframe Structure โ€“ Clear resistance level on the 2H timeframe

2. Double Break of Structure โ€“ Confirmed on both 15-minute and 2-hour for bearish continuation.

3. Liquidity Sweepโ€“ Price swept above the resistance, taking out buy-side liquidity (classic inducement).

4. POI + Market Structure โ€“ High-probability reversal zone after the sweep.

5. Continuation Entry โ€“ Entered on the lower timeframe (5M) after displacement and confirmation.

Entry: Around 1.1720 - 1.1719 zone (after the sweep and BOS)

Stop Loss: Above the breaker Block

Take Profit: Targeting next liquidity pool below (marked on chart)

The big green zone you see is the profit area running after price broke down strongly.

G
@godswillfx - 1 month ago
Quoted - godswillfx

๐Ÿšจ EUR/USD Trade Breakdown | CRT Strategy (Continuation Entry)

Trade Direction: Short

Timeframes Used: 2H (for direction & structure) โ†’ 15M + 5M (for entry)

Strategy: Candle Range Theory (CRT) โ€“ Liquidity Sweep + POI

This was a textbook CRT setup: Liquidity grab โ†’ Fair Value Gap / POI reaction โ†’ Strong displacement lower.

Risk Management: 1:20 RR+ (very favorable due to the sweep and structure)

G
@godswillfx - 1 month ago
Quoted - godswillfx

Our trade so far

Market is now gifting us another sell opportunity

ยซ Previous 1 2

Disclaimer:

At MyTradingLand.com, we connect you with forex brokers and provide a community for traders. While we offer valuable information and resources, please note that we are not financial advisors and cannot provide personalized financial advice. Always conduct your own research and invest responsibly.

Community Guidelines: The MyTradingLand.com community is designed as a resource for forex traders, promoting respectful and constructive discussions. We reserve the right to remove any content that is misleading, abusive, or violates our terms of service.

Broker Information: While we may receive commissions or advertising income from some of the brokers listed, this does not imply an endorsement of any broker, nor does it affect our review process. Our evaluations are based solely on objective criteria and user feedback.

Always verify the regulatory status of any broker with your local financial authority, along with their terms and privacy policies, before engaging with them. It is crucial to conduct thorough research to ensure that you are making informed decisions.

Risk Warning: At MyTradingLand.com, we strive to provide accurate information; however, the forex market is highly volatile and can change rapidly. It is essential to verify any information before making investment decisions.

Please be aware that trading in forex involves substantial risk, and it is possible to lose more than your trading equity/investment capital. 70-90% of retail CFD traders incur losses in their trading activities as per information from various brokers.

You are solely responsible for your use of MyTradingLand.com and any trading decisions you make. We encourage all users to educate themselves thoroughly about forex trading and to consider seeking advice from qualified financial professionals.

Advertising Disclosure: We may earn commissions from recommended brokers, but our reviews are independent (not influenced by potential earnings). Sponsored content is clearly marked and doesn't reflect our views.

©2026 ยฉ2025 All rights reserved Mytradingland.com