FUG MTL COMMUNITY ๐Ÿฆ…

S
@stevmega - 9 hours ago

Let's start with support.

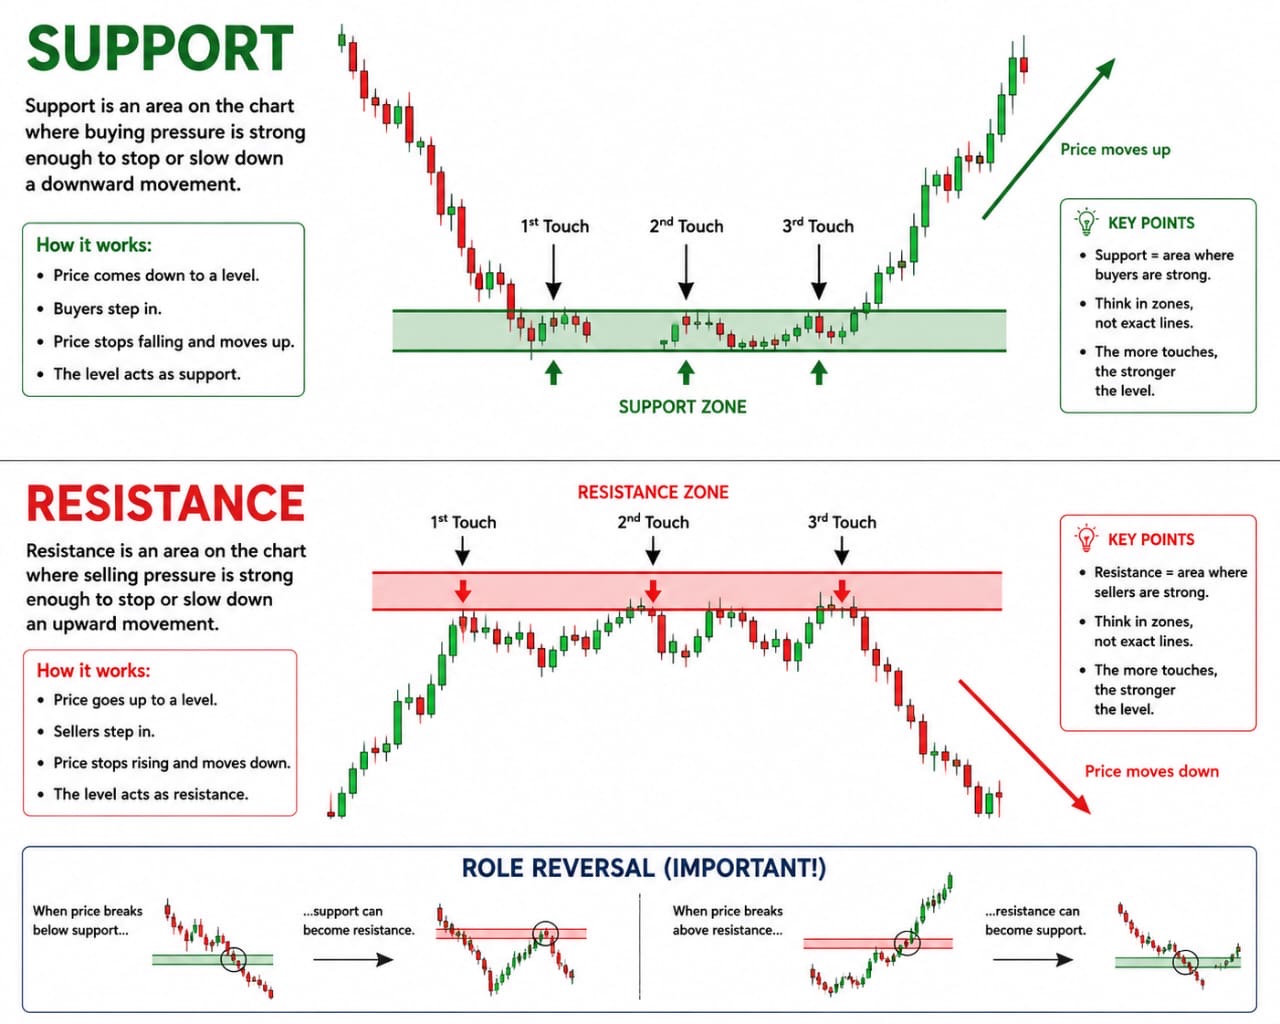
Support is basically an area on the chart where buying pressure has previously been strong enough to stop or slow down a downward movement.

Think about a ball.

If you throw a ball down, it hits the ground and bounces back up.

The ground is acting like support.

In the market, price comes down into a particular area, buyers step in aggressively, and price reacts upward.

That area becomes a potential support zone.

So I want you to remember this simple definition:

Support is an area where buyers are expected to become stronger than sellers.

For example, imagine EUR/USD is moving downward.

Price comes to 1.1000.

It touches that area and moves up.

Later, price comes back to 1.1000 again and moves up.

And maybe a third time, price comes close to 1.1000 and buyers push the market upward again.

What does that tell us?

It tells us that there is buying interest around that area.

Therefore, we can mark 1.1000 as a potential support area.

But notice that I said area, not necessarily one exact price.

This is very important.

Beginners often draw one perfect horizontal line and respect

"Price must respect this exact line."

No.

The market doesn't know that you drew a line on your TradingView chart. ๐Ÿ˜‚

Price can enter the area slightly, sweep below it, or react above it.

That's why we generally think of support as a zone, rather than an exact number.

So:

Support = buying interest below current price.

E
@enoch06 - 9 hours ago
Quoted - stevmega

Let's start with support.

Support is basically an area on the chart where buying pressure has previously been strong enough to stop or slow down a downward movement.

Think about a ball.

If you throw a ball down, it hits the ground and bounces back up.

The ground is acting like support.

In the market, price comes down into a particular area, buyers step in aggressively, and price reacts upward.

That area becomes a potential support zone.

So I want you to remember this simple definition:

Support is an area where buyers are expected to become stronger than sellers.

For example, imagine EUR/USD is moving downward.

Price comes to 1.1000.

It touches that area and moves up.

Later, price comes back to 1.1000 again and moves up.

And maybe a third time, price comes close to 1.1000 and buyers push the market upward again.

What does that tell us?

It tells us that there is buying interest around that area.

Therefore, we can mark 1.1000 as a potential support area.

But notice that I said area, not necessarily one exact price.

This is very important.

Beginners often draw one perfect horizontal line and respect

"Price must respect this exact line."

No.

The market doesn't know that you drew a line on your TradingView chart. ๐Ÿ˜‚

Price can enter the area slightly, sweep below it, or react above it.

That's why we generally think of support as a zone, rather than an exact number.

So:

Support = buying interest below current price.
Why will the market not know I draw line ๐Ÿคฃ๐Ÿฅน

Noted sir โœ๏ธ

S
@stevmega - 9 hours ago

Now let's talk about resistance.

Resistance is basically the opposite of support.

Resistance is an area where selling pressure has previously been strong enough to stop or slow down an upward movement.

Think about a ceiling.

If you throw a ball upward, eventually it reaches the ceiling and comes back down.

That ceiling is acting like resistance.

In the market, price moves upward into an area, sellers step in, and price gets pushed downward.

That area becomes potential resistance.

So remember:

Resistance is an area where sellers are expected to become stronger than buyers.

For example:

Imagine GBP/USD moves upward and reaches 1.3000.

Price gets rejected and falls.

Later, price comes back to 1.3000 and falls again.

Then another time, price reaches that area and sellers push it down again.

What do we have?

We have evidence that sellers are interested around that area.

So we can mark 1.3000 as a resistance zone.

Again, don't think:

1.3000 is a magical number.

Think:

"There is a region around 1.3000 where sellers have previously shown strength."

That's the correct mindset.

So:

Support = area where buyers have shown strength.

Resistance = area where sellers have shown strength.

S
@stevmega - 9 hours ago

For those of you following, check the WhatsApp group for the image illustration

E
@enoch06 - 9 hours ago

Here is the image

S
@stevmega - 9 hours ago

So let's summarize everything.

I want you to remember these four things.

Number one: Support.

Support is an area where buyers have previously shown strength and may defend price again.

Number two: Resistance.

Resistance is an area where sellers have previously shown strength and may defend price again.

Number three: Think in zones, not perfect lines.

The market doesn't always react to one exact price.

Give your levels some room.

Number four: Don't trade the level blindly.

Support doesn't mean:

"BUY!"

And resistance doesn't automatically mean:

"SELL!"

๐Ÿ˜‚

They are areas of interest.

We still need confirmation and proper risk management.

So when you open your chart, don't ask:

"Where can I enter?"

First ask:

Where has price reacted strongly before?

Where are the important highs?

Where are the important lows?

Where are buyers likely to be interested?

Where are sellers likely to be interested?

Once you can identify those areas, your chart will start making much more sense.

And that's the foundation of support and resistance.

Thank you everyone.

Good night ๐Ÿ˜ด

S
@stevmega - 9 hours ago
Quoted - enoch06

Here is the image

Thank you admin

I tries uploading it here but is not doing

Thank you

S
@stevmega - 9 hours ago

Before I leave finally, you all should go to BTC chart

And mark out the support and resistance there

And it should be submitted tmr

Disclaimer:

At MyTradingLand.com, we connect you with forex brokers and provide a community for traders. While we offer valuable information and resources, please note that we are not financial advisors and cannot provide personalized financial advice. Always conduct your own research and invest responsibly.

Community Guidelines: The MyTradingLand.com community is designed as a resource for forex traders, promoting respectful and constructive discussions. We reserve the right to remove any content that is misleading, abusive, or violates our terms of service.

Broker Information: While we may receive commissions or advertising income from some of the brokers listed, this does not imply an endorsement of any broker, nor does it affect our review process. Our evaluations are based solely on objective criteria and user feedback.

Always verify the regulatory status of any broker with your local financial authority, along with their terms and privacy policies, before engaging with them. It is crucial to conduct thorough research to ensure that you are making informed decisions.

Risk Warning: At MyTradingLand.com, we strive to provide accurate information; however, the forex market is highly volatile and can change rapidly. It is essential to verify any information before making investment decisions.

Please be aware that trading in forex involves substantial risk, and it is possible to lose more than your trading equity/investment capital. 70-90% of retail CFD traders incur losses in their trading activities as per information from various brokers.

You are solely responsible for your use of MyTradingLand.com and any trading decisions you make. We encourage all users to educate themselves thoroughly about forex trading and to consider seeking advice from qualified financial professionals.

Advertising Disclosure: We may earn commissions from recommended brokers, but our reviews are independent (not influenced by potential earnings). Sponsored content is clearly marked and doesn't reflect our views.

©2026 ยฉ2025 All rights reserved Mytradingland.com