Gold Analysis
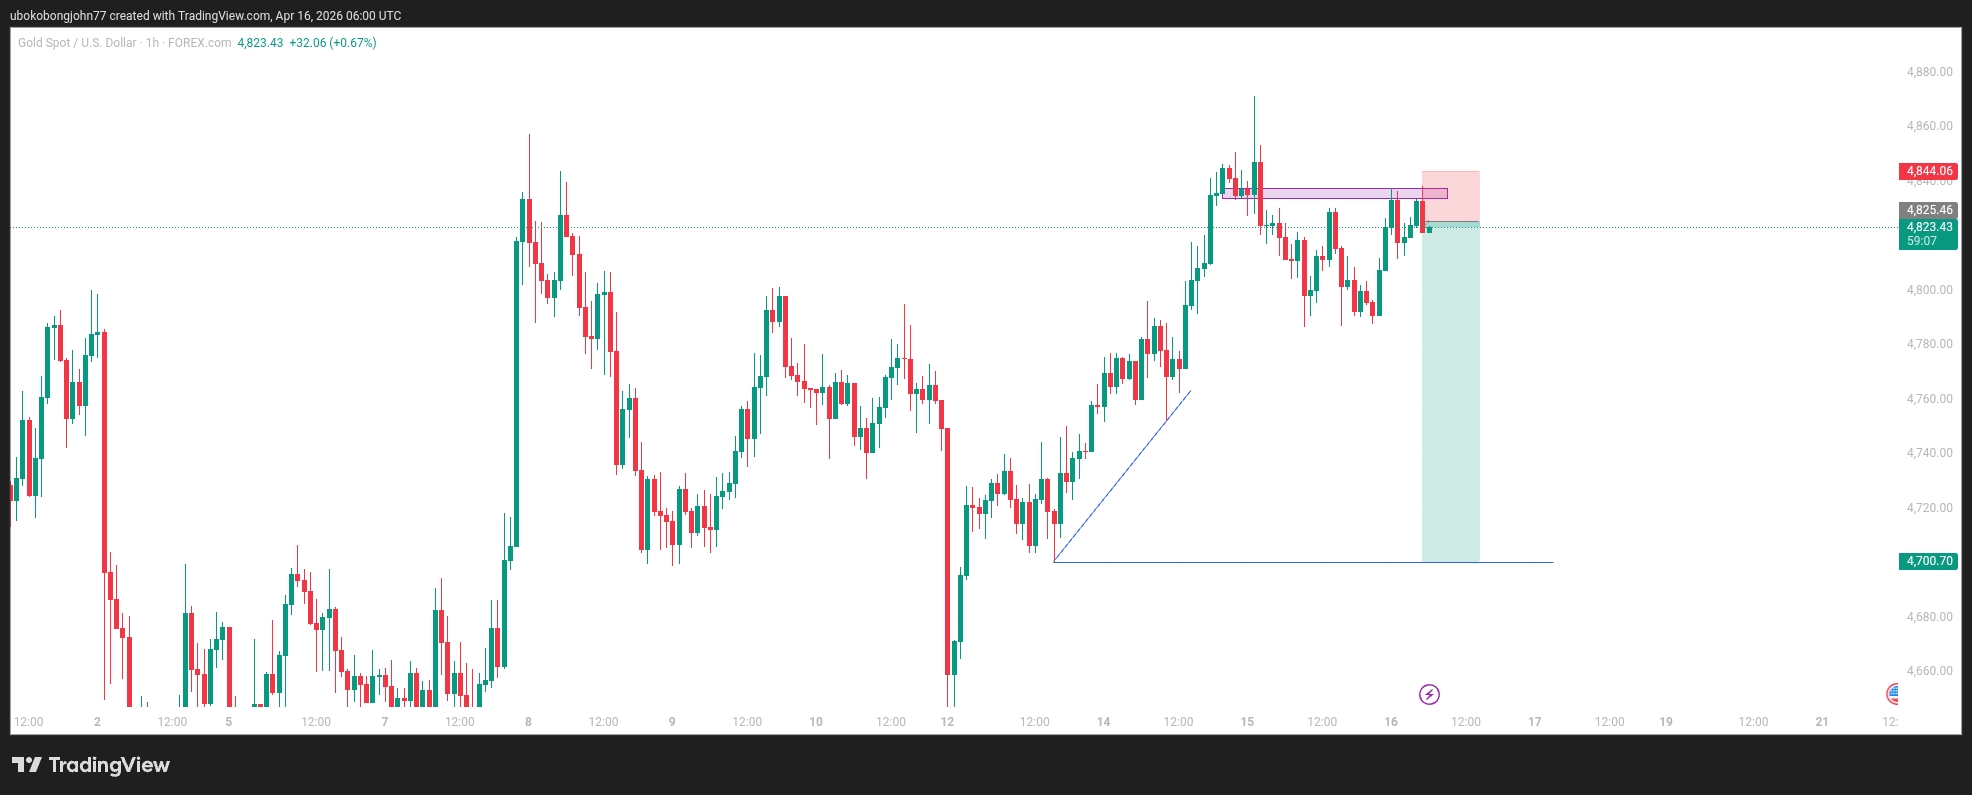
Pair : XAUUSD
Strategy: SLP (Structure, Liquidity and POI)
Analysis:
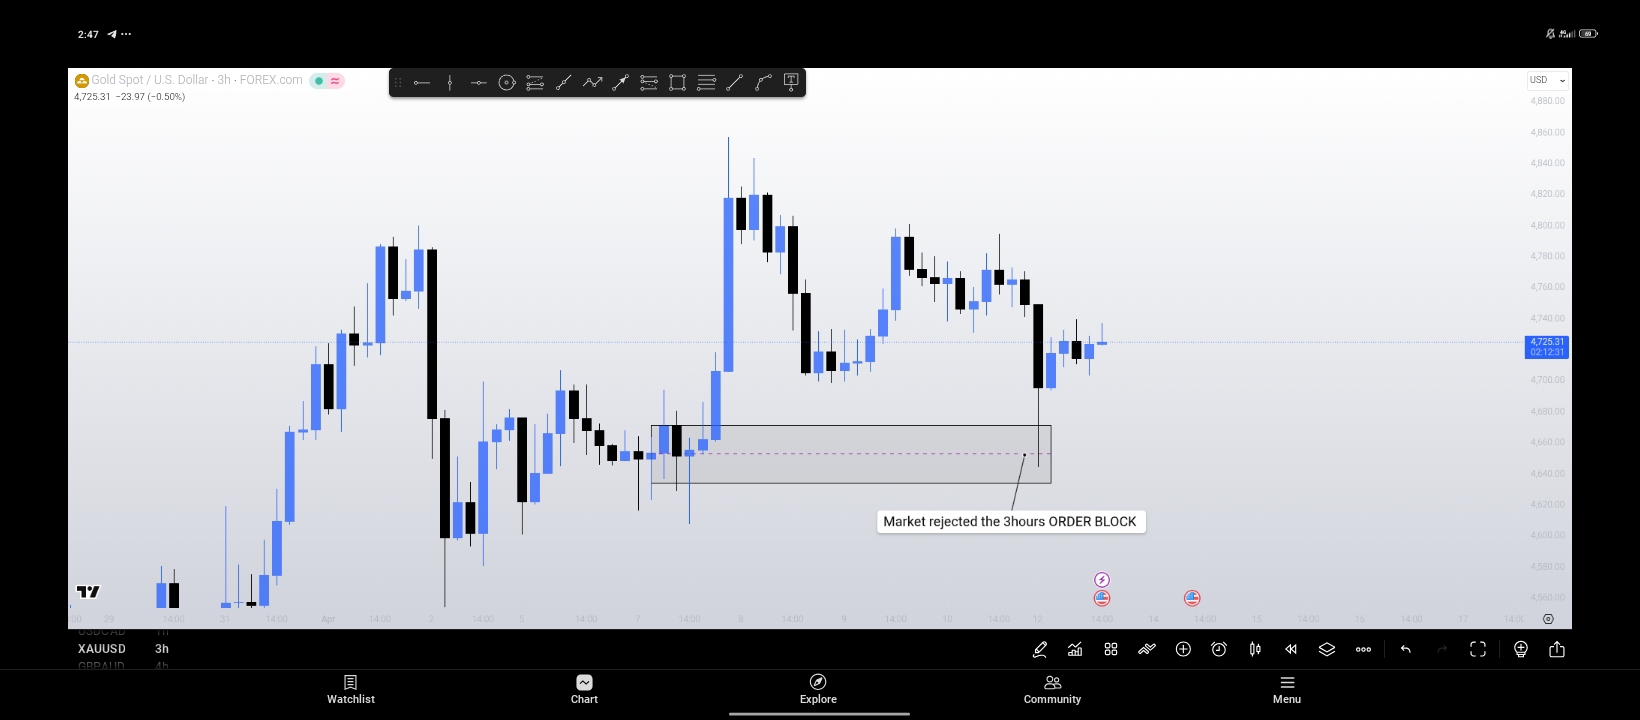
1.) STRUCTURE; Market rejected at the 3hr timeframe ORDER BLOCK level.
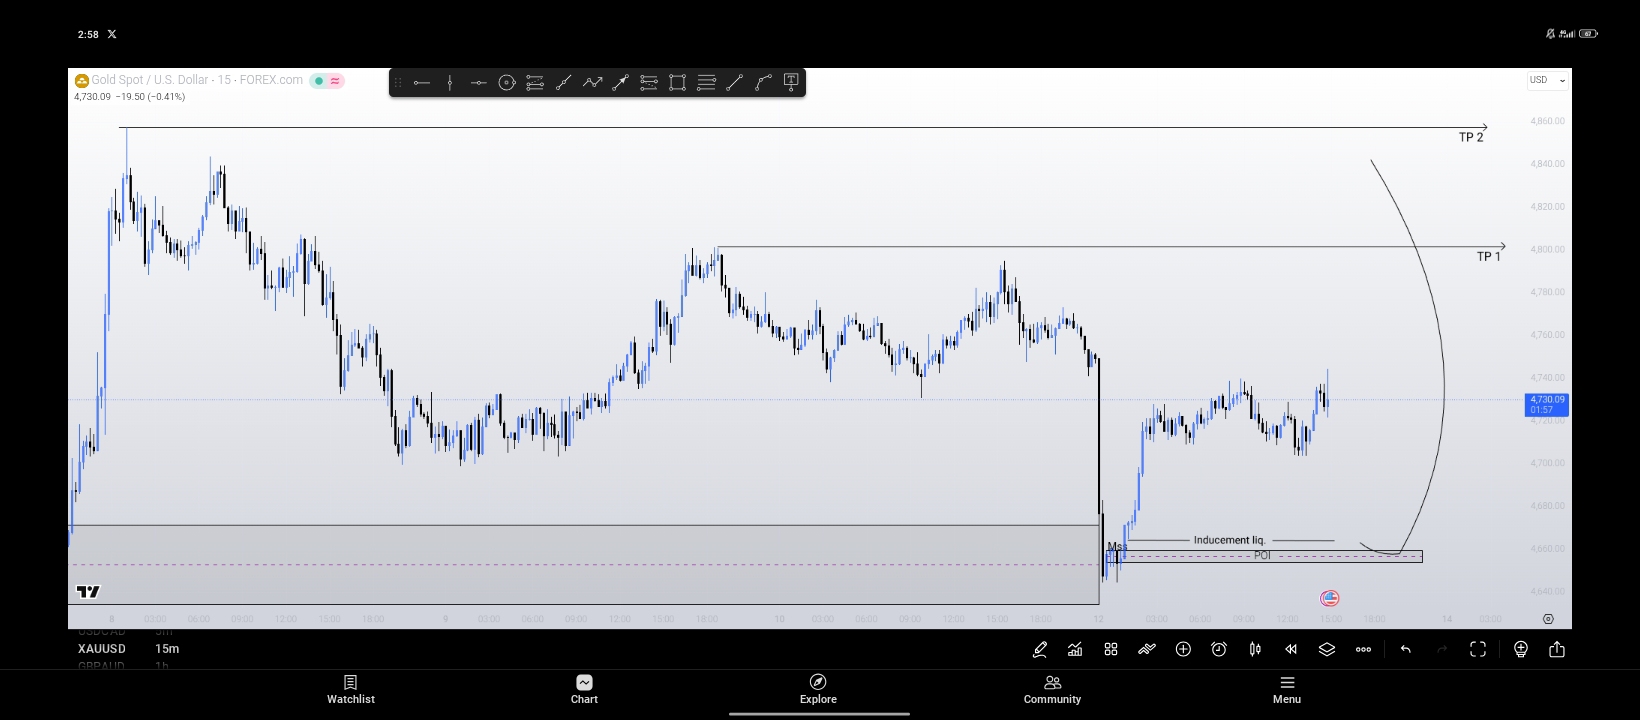
The rejection on the 3hr timeframe led to a Market structure shift (MSS) on the 15 minutes timeframe.
2.) LIQUIDITY: The MSS was accompanied by a single candle inducement liquidity.
3) POI : The only poi that was the closest to liquidity was the ORDER BLOCK.
This is an educative thread @godswill I am subscribing to it
More trade outlook to would be published stay tuned
Gold is looking bearish right nw
Yeah..I'm expecting gold to sell to my 15 minutes area of interest for a potential buy .
I'm doing this because my overall DIRECTIONAL BIAS is bullish
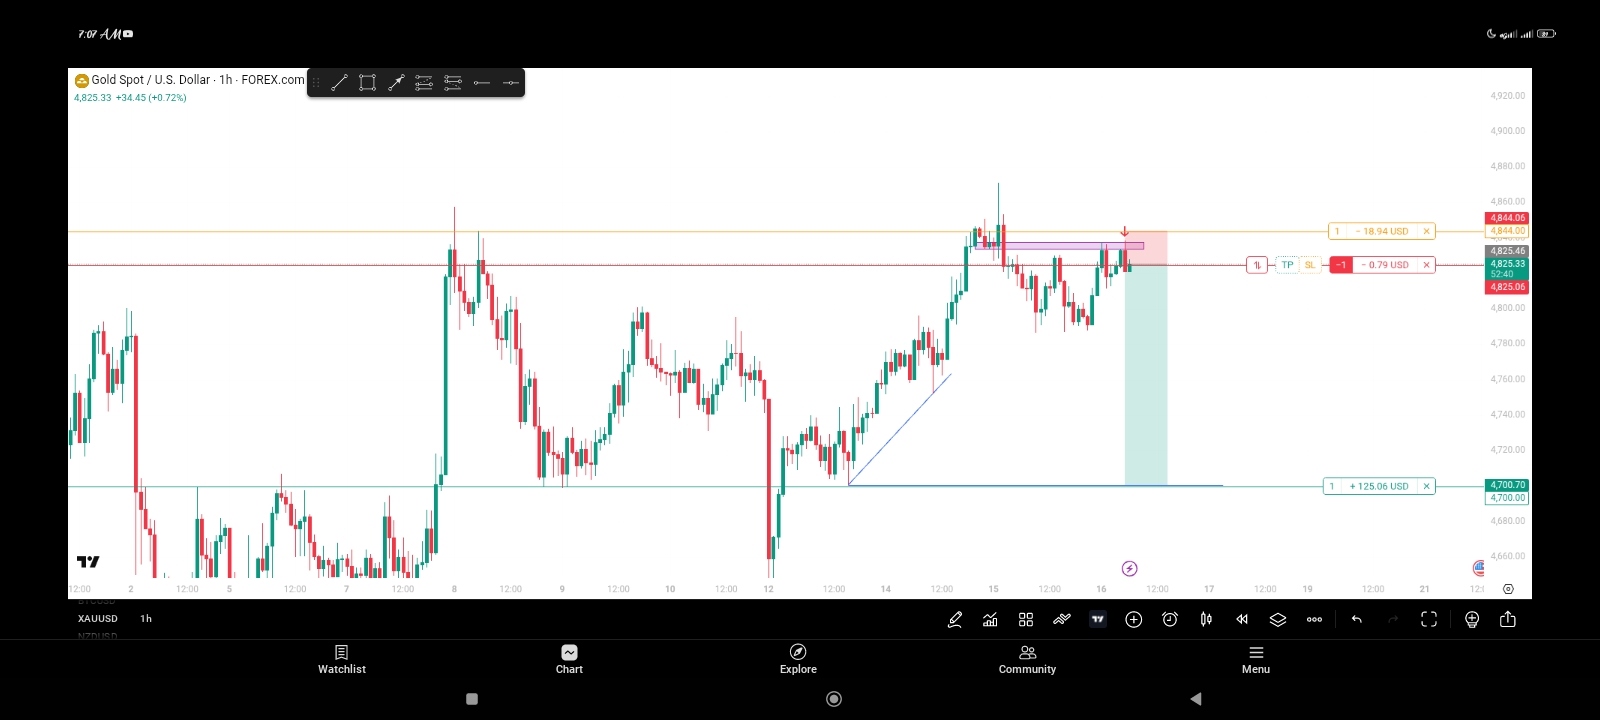
Market is reacting from a 1hour resistance,s .
Take profit is at the closest trendline liquidity
Market is reacting from a 1hour resistance,s .
Take profit is at the closest trendline liquidity
Selling from here
Selling from here
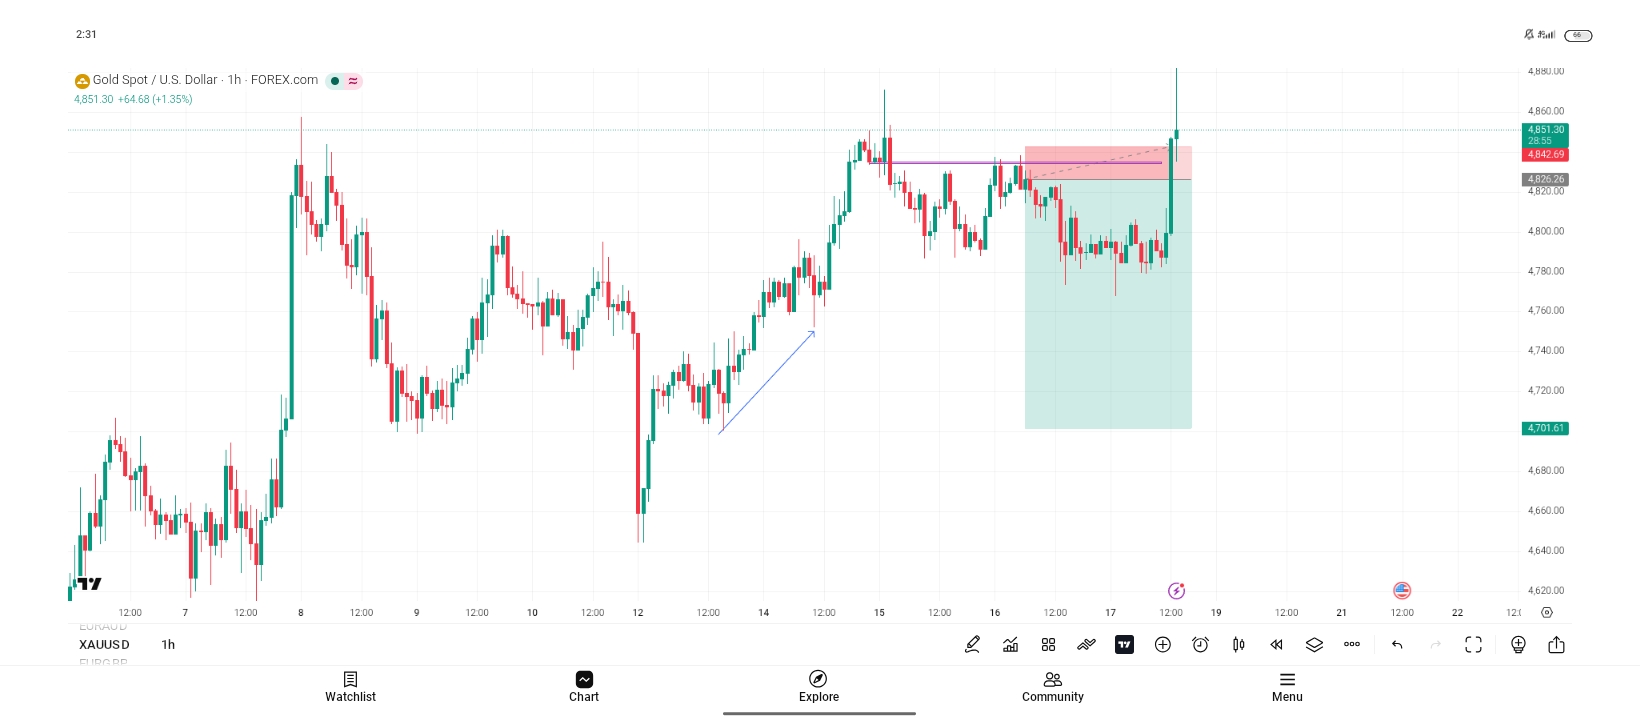
Looks bullish to me, but its a good thing your stop it tight so if it goes up you dont lose too much
Yes definitely...
Overall bullish but bearish scalp
Selling from here
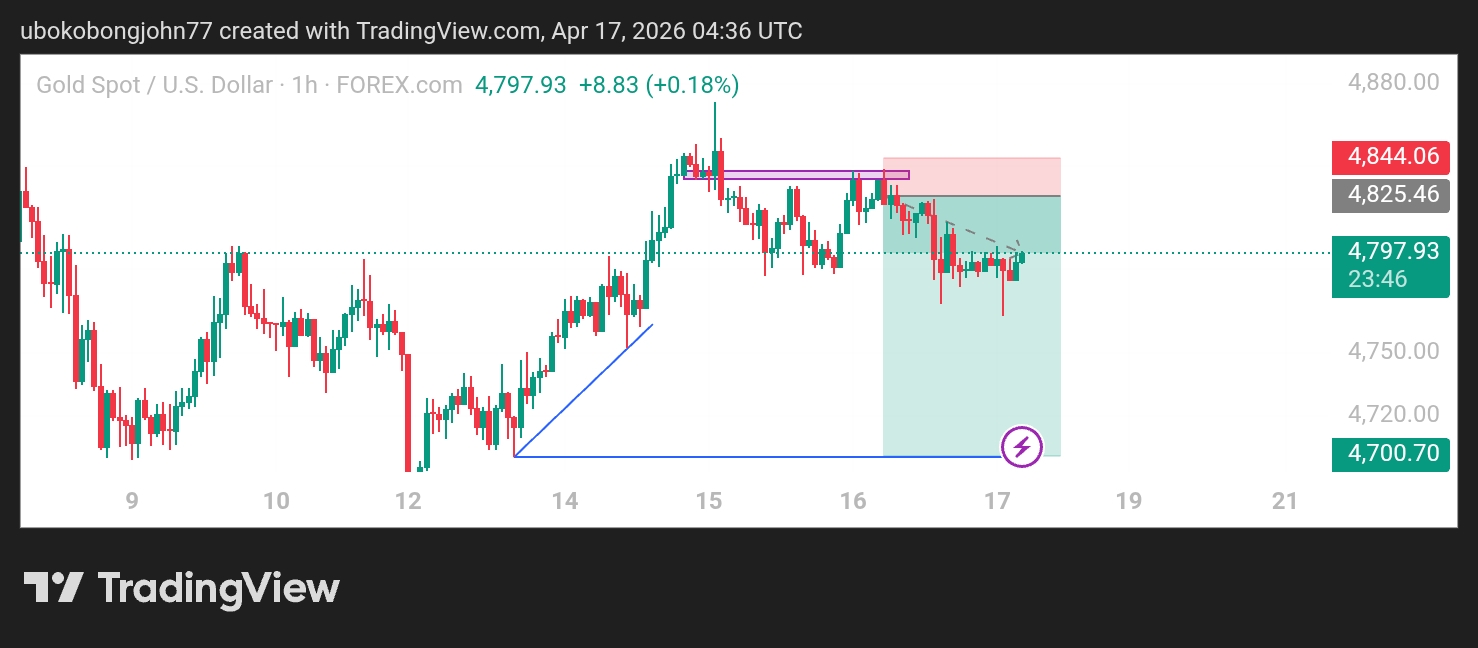
Still running on profit.
Will keep you updated.
Still running on profit.
Will keep you updated.
Ps what's the RR
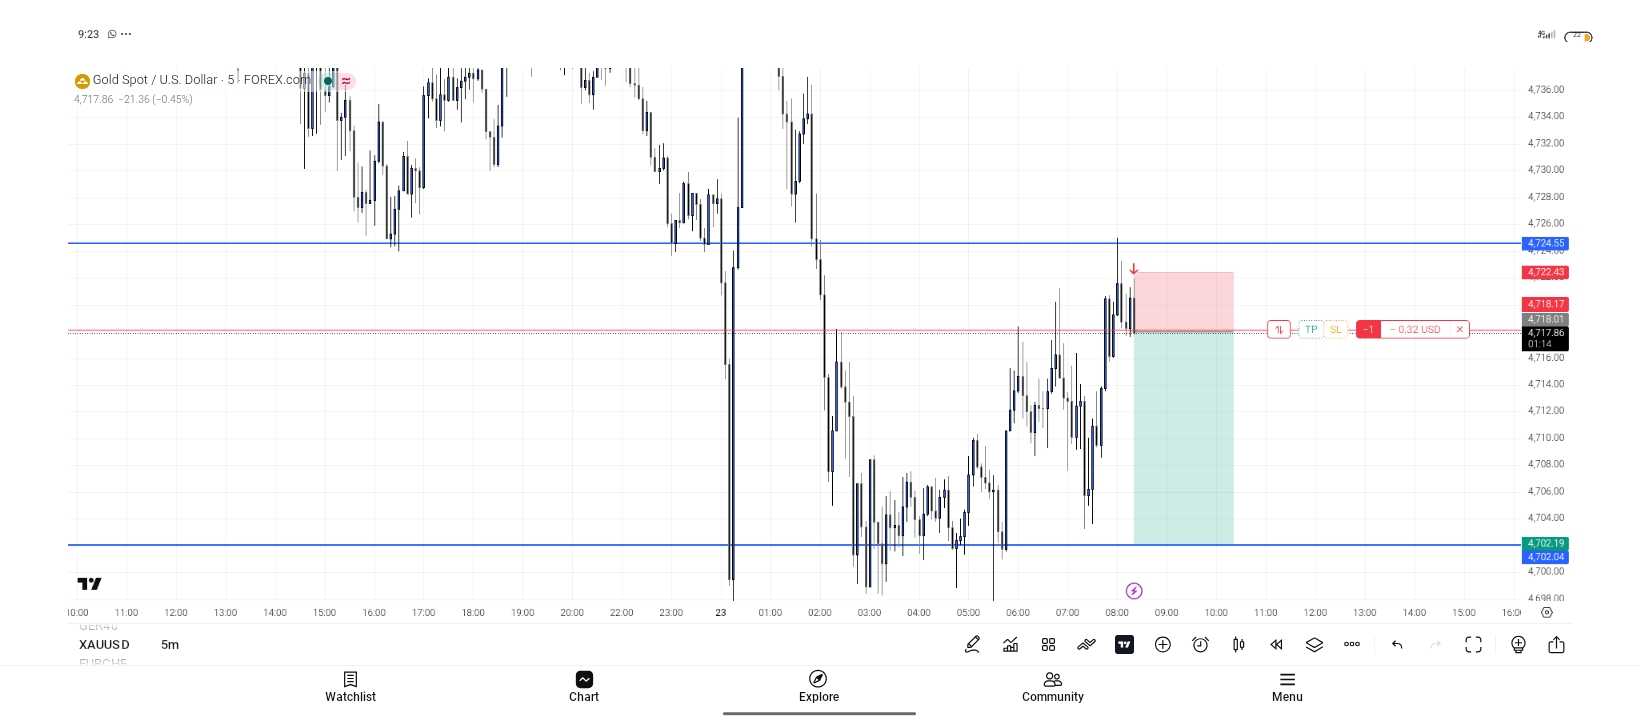
XAUUSD (Gold) Sell Setup 5-Minute Chart Breakdown
Think of price like a bouncing ball. When it hits a ceiling (resistance), it tends to fall back down. That's exactly what we're seeing on Gold right now.
Why I'm Taking a SELL; Step by Step
1️⃣ The 1-Hour Resistance is the Boss LevelThe most important reason for this sell is that Gold just tapped into a strong 1-Hour resistance zone (the upper blue line around 4,724.55). This level isn't random — it's a price where sellers have shown up multiple times in the past on a higher timeframe. Higher timeframe levels carry more weight, so when price reaches them, we pay attention.
XAUUSD (Gold) Sell Setup 5-Minute Chart Breakdown
Think of price like a bouncing ball. When it hits a ceiling (resistance), it tends to fall back down. That's exactly what we're seeing on Gold right now.
Why I'm Taking a SELL; Step by Step
1️⃣ The 1-Hour Resistance is the Boss LevelThe most important reason for this sell is that Gold just tapped into a strong 1-Hour resistance zone (the upper blue line around 4,724.55). This level isn't random — it's a price where sellers have shown up multiple times in the past on a higher timeframe. Higher timeframe levels carry more weight, so when price reaches them, we pay attention.
2️⃣ Price Got Rejected Instantly
See that red arrow pointing down on the chart? That's the moment price touched the resistance and immediately got pushed back down, a classic rejection signal. The market didn't even try to push through. That tells us sellers are in control at that level.
2️⃣ Price Got Rejected Instantly
See that red arrow pointing down on the chart? That's the moment price touched the resistance and immediately got pushed back down, a classic rejection signal. The market didn't even try to push through. That tells us sellers are in control at that level.
Which broker is best for gold brother?
2️⃣ Price Got Rejected Instantly
See that red arrow pointing down on the chart? That's the moment price touched the resistance and immediately got pushed back down, a classic rejection signal. The market didn't even try to push through. That tells us sellers are in control at that level.
After the rejection, I'm entering the sell around 4,718. This is a refined entry not chasing the move, but waiting for price to confirm the rejection before getting in.
Which broker is best for gold brother?
Forex.com broker for analysis on trading view.
Octafx and exness
After the rejection, I'm entering the sell around 4,718. This is a refined entry not chasing the move, but waiting for price to confirm the rejection before getting in.
4️⃣ The Trade Layout (Pink & Green Boxes)
- 🟥 Pink box (above entry) = Stop Loss zone — where the trade is wrong
- 🟩 Green box (below entry) = Take Profit zone — where we're targeting around 4,702
- The lower blue line at 4,702.19 is the target/support level, a logical place to take profit
Forex.com broker for analysis on trading view.
Octafx and exness
Why Octafx and Exness? What makes them the best? these are B-Book brokers
That's what I use