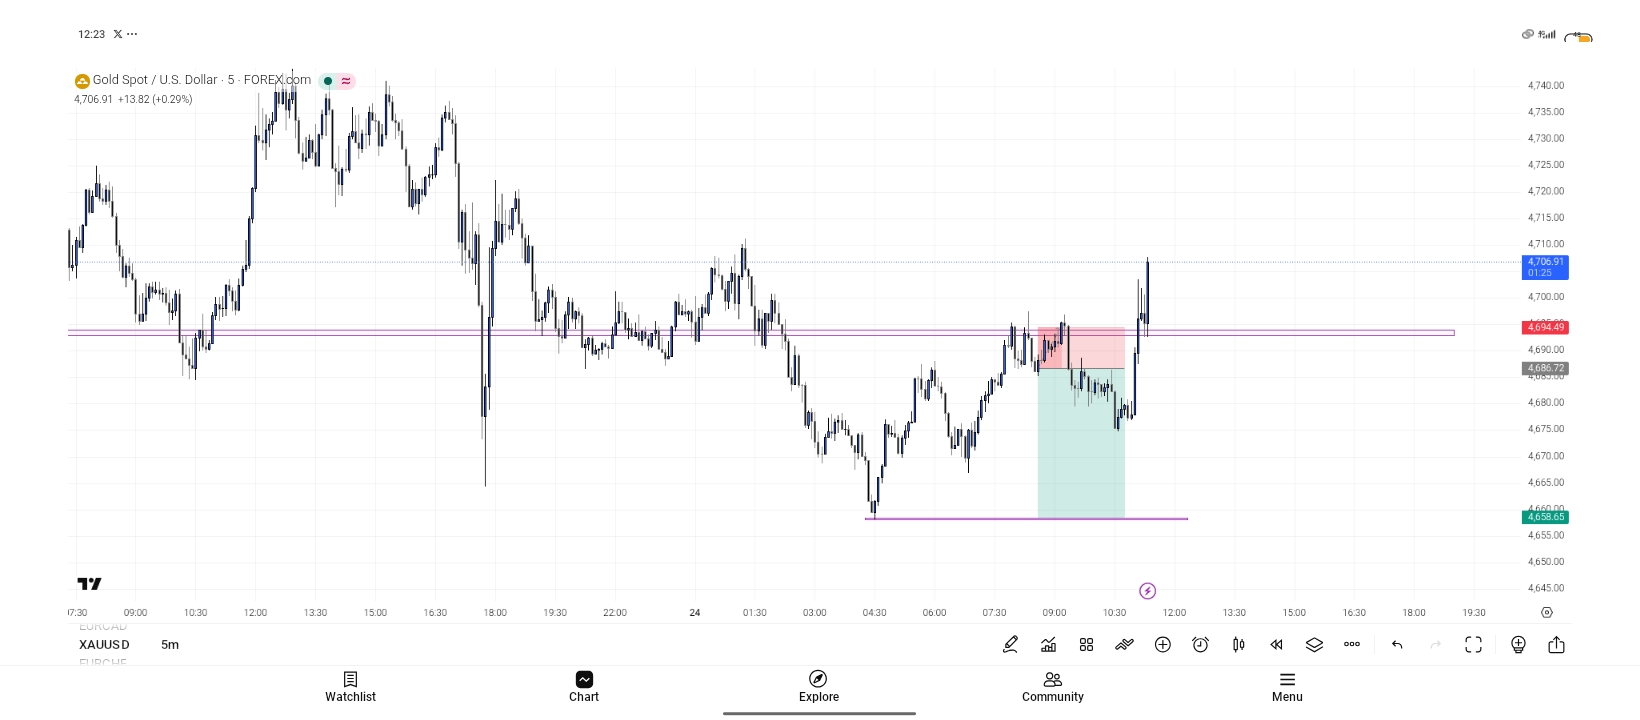
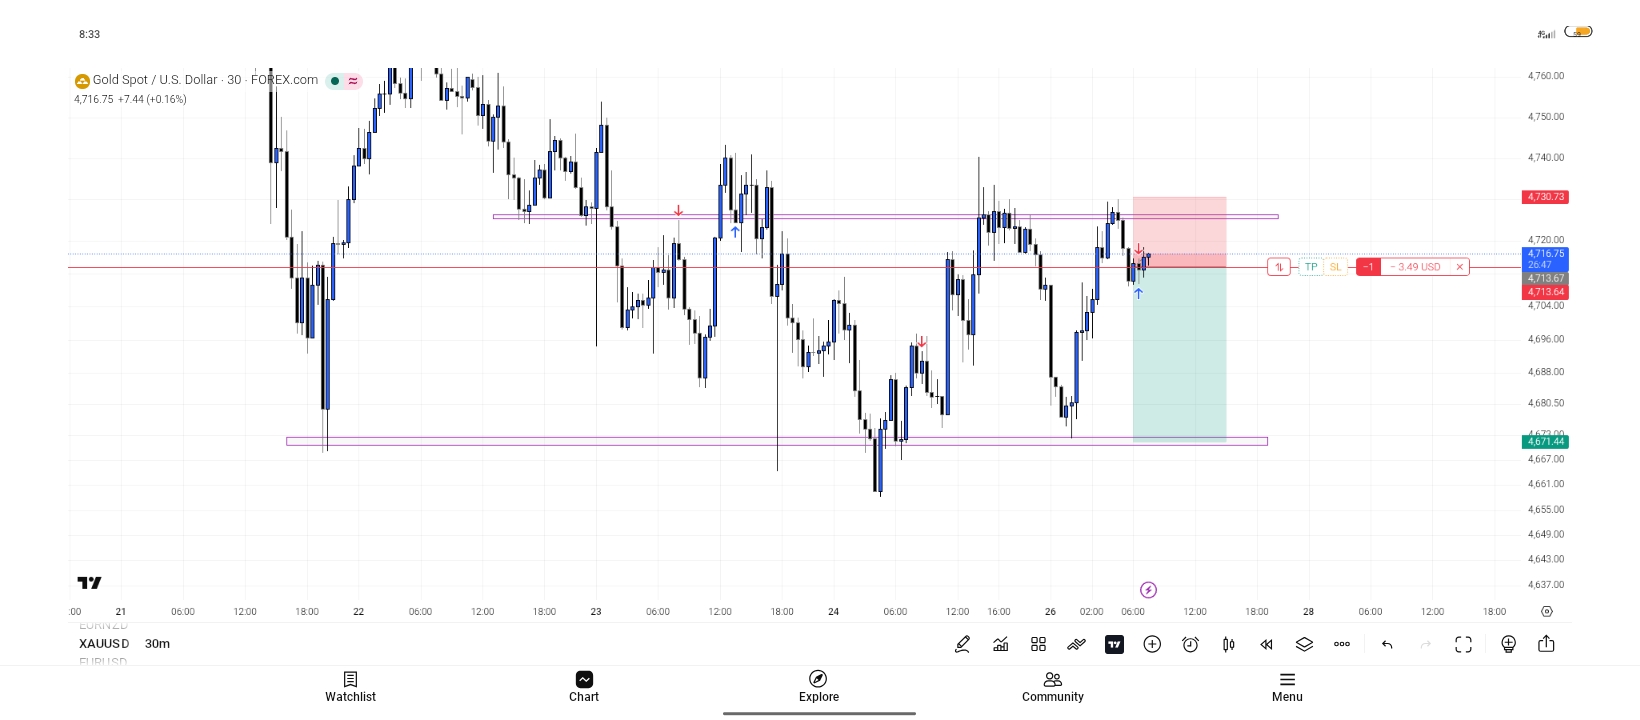
Gold Analysis
That's what I use
"that's what I use" is not a reason bro, if you use these brokers you must find something attractive about them such as their spread on gold, leverage etc. if you say these are the best brokers for gold trading you should have a solid reason. For me I trade gold with SAXO Bank because of their quick execution
The most important thing to consider when trading gold is the spread, dont just use any broker because someone said they are good. Most brokers charge very high spreads on gold and manipulate the spreads too. Stick with Tier-1 regulated brokers when trading gold so you don't get ripped off.
Exness in particular has very terrible spreads on commodities including gold, Exness is only average for trading major fx pairs.
XAUUSD (Gold) Sell Setup 5-Minute Chart Breakdown
Think of price like a bouncing ball. When it hits a ceiling (resistance), it tends to fall back down. That's exactly what we're seeing on Gold right now.
Why I'm Taking a SELL; Step by Step
1️⃣ The 1-Hour Resistance is the Boss LevelThe most important reason for this sell is that Gold just tapped into a strong 1-Hour resistance zone (the upper blue line around 4,724.55). This level isn't random — it's a price where sellers have shown up multiple times in the past on a higher timeframe. Higher timeframe levels carry more weight, so when price reaches them, we pay attention.
Second trade Today and the result was huge..
Resistance to support, support to resistance
It's all amazing
Trade Overview
Instrument: XAU/USD (Gold Spot / US Dollar)
Timeframe 5-Minute (Entry) | 1-Hour (Bias)
Direction: Short (Sell)
Entry Price: ~4,686.44
Trade Reasoning — Multi-Timeframe Analysis (MTF)
Step 1: The 1-Hour Timeframe: Identifying the Key Level
Before touching the 5-minute chart, the higher timeframe was consulted first. On the 1-hour chart, a clear horizontal resistance zone was identified around the 4,694 – 4,696 area marked by the purple/pink horizontal lines visible across the entire chart.
This level is significant because:
- It has been tested multiple times, confirming it as a well-respected supply zone
- Price has repeatedly failed to close above it, showing consistent seller pressure at that level
- Higher timeframe levels carry more weight, as they represent the decisions of institutional and larger retail participants
Step 2 — The 5-Minute Timeframe: Timing the Entry
Rather than entering blindly at the resistance zone on the 1H, the 5-minute chart was used to refine the entry. This is where patience and precision come into play.
Looking at the chart, price action around the 08:00 – 09:00 window shows:
- Price rallied sharply into the resistance zone, tagging the 4,694–4,696 area
- A bearish reaction formed right at that level sellers stepped in and rejected price
- The 5M candles at that zone showed rejection wicks and bearish momentum, confirming the 1H resistance was holding
This is the entry trigger the 1H level did the heavy lifting in terms of where to trade, and the 5M gave the signal for when to pull the trigger.
Trade Overview
Instrument: XAU/USD (Gold Spot / US Dollar)
Timeframe 5-Minute (Entry) | 1-Hour (Bias)
Direction: Short (Sell)
Entry Price: ~4,686.44
Trade Reasoning — Multi-Timeframe Analysis (MTF)
Step 1: The 1-Hour Timeframe: Identifying the Key Level
Before touching the 5-minute chart, the higher timeframe was consulted first. On the 1-hour chart, a clear horizontal resistance zone was identified around the 4,694 – 4,696 area marked by the purple/pink horizontal lines visible across the entire chart.
This level is significant because:
- It has been tested multiple times, confirming it as a well-respected supply zone
- Price has repeatedly failed to close above it, showing consistent seller pressure at that level
- Higher timeframe levels carry more weight, as they represent the decisions of institutional and larger retail participants
Trade Structure
The entry was taken at ~4,686.44, with the stop loss placed above the resistance zone at ~4,694–4,696 the level where the thesis would be invalidated if price broke and closed above it. The take profit is targeted at the 4,638–4,660 support area, which was previously established as a key demand zone earlier in the session. The pink shaded area on the chart represents the risk zone above entry, while the green shaded area represents the reward zone below.
✅ Confluence Factors
1. 1-Hour Resistance Level: Well-tested, multi-touch zone adding high probability
2. Multi-Timeframe Alignment: Higher TF bias (bearish at resistance) confirmed on lower TF execution
3. Clean Price Rejection: 5M candles showed clear bearish response, not just price touching the level
4. Defined Risk: Stop loss placed logically above the zone, not arbitrarily
5. Clear Target: Take profit anchored to a visible structural support level
Trade Overview
Instrument: XAU/USD (Gold Spot / US Dollar)
Timeframe 5-Minute (Entry) | 1-Hour (Bias)
Direction: Short (Sell)
Entry Price: ~4,686.44
Trade Reasoning — Multi-Timeframe Analysis (MTF)
Step 1: The 1-Hour Timeframe: Identifying the Key Level
Before touching the 5-minute chart, the higher timeframe was consulted first. On the 1-hour chart, a clear horizontal resistance zone was identified around the 4,694 – 4,696 area marked by the purple/pink horizontal lines visible across the entire chart.
This level is significant because:
- It has been tested multiple times, confirming it as a well-respected supply zone
- Price has repeatedly failed to close above it, showing consistent seller pressure at that level
- Higher timeframe levels carry more weight, as they represent the decisions of institutional and larger retail participants
Key Takeaway
This trade is a textbook example of top-down analysis, using the 1-hour chart to identify where price is likely to react, then dropping to the 5-minute chart to find a precise, low-risk entry. The result is a trade with a well-defined risk, logical structure, and a confluent reason behind every decision.
"The 1H tells you the story. The 5M tells you when to act."