how do i spot volatility on charts without using indicators?

Hi all, I know there are several indicators used to spot volatility on the charts but whats the old school way of doing it without using indicators?

M
@melody_nk - 1 year ago

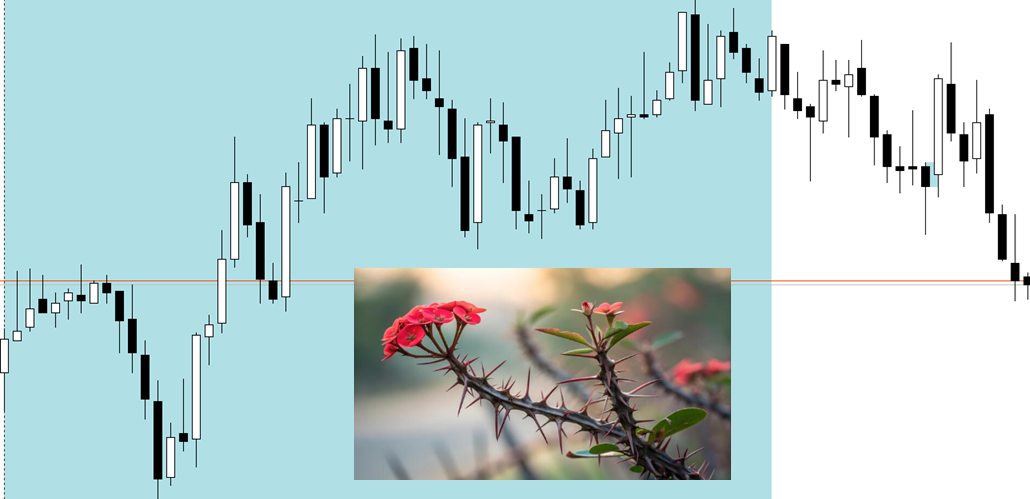
I look out for "scattered charts"; when i see a lot of wicks making the charts look like a thorn field i know theres some volatility in the market.

Quoted - melody_nk

I look out for "scattered charts"; when i see a lot of wicks making the charts look like a thorn field i know theres some volatility in the market.

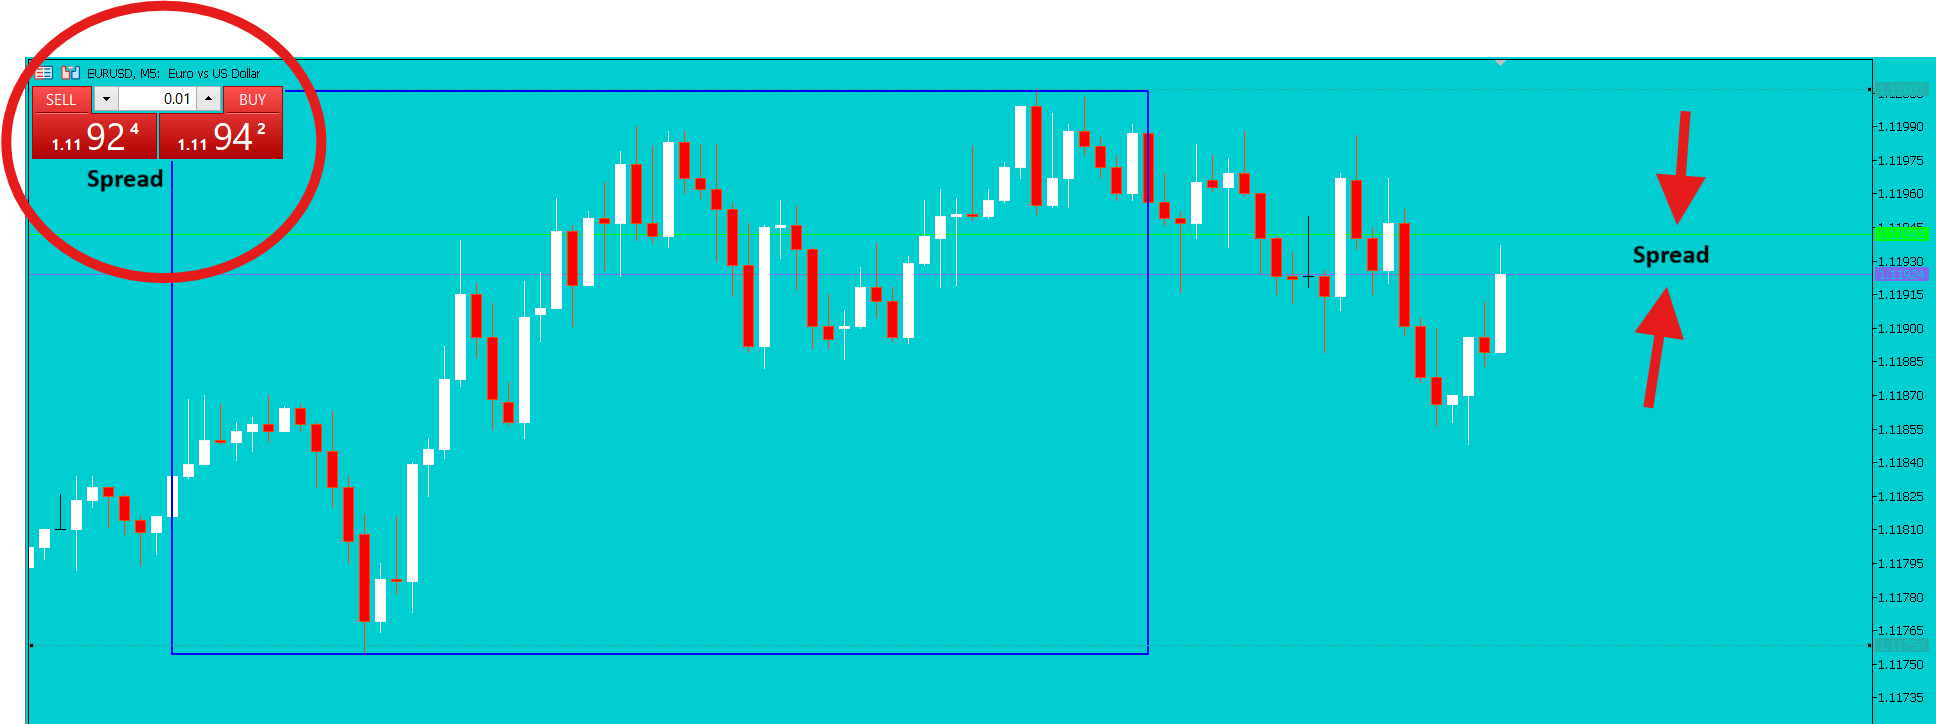
When volatility is high, forex brokers ususally increase their spread as seen on the charts. On your chart, the space between the bid and ask price lines is the spread so you will notice the space becomes unusually wider.

Y
@yokoyi - 1 year ago
Quoted - maasai_princess

When volatility is high, forex brokers ususally increase their spread as seen on the charts. On your chart, the space between the bid and ask price lines is the spread so you will notice the space becomes unusually wider.

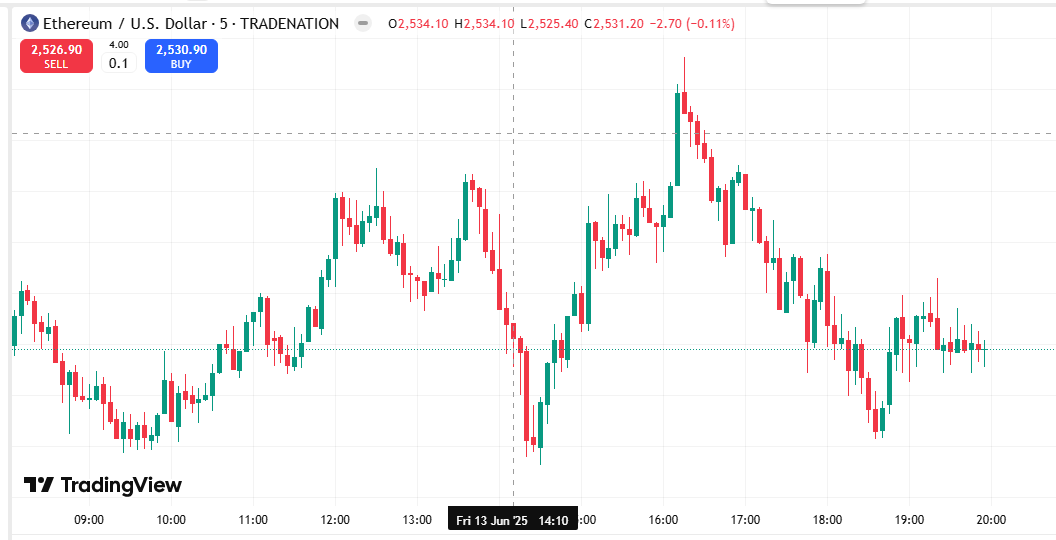
Just like @melody said, a volatile market will have a lot of wicks on candlesticks. This is an Ethereum/USD chart and cryptocurrency pairs are always very volatile so you can see that almost every candle is accompanied by a wick.

These long wicks mean you face a higher chance of your stop loss getting hit so you need to place a wide stop when trading volatile pairs

F
@fizy12 - 1 year ago

Nice one 👌

Y
@yokoyi - 10 months ago
Quoted - fizy12

Nice one 👌

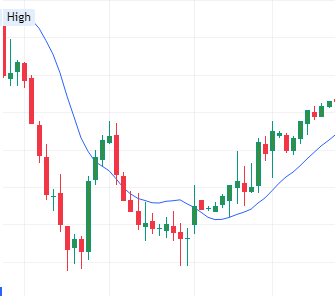
Normal Volatility

You can also use the SMA indicator as a guide. When volatility is normal, price tends to stay above or below the Simple Moving Average (SMA) line.

Y
@yokoyi - 10 months ago

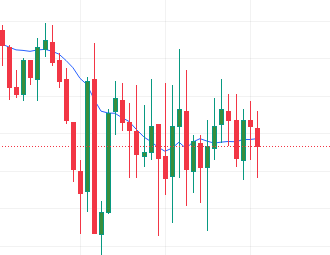
High/Excessive Volatility

When volatility is excessive, price tends to engulf the Simple Moving Average line

P
@paul_petit - 6 months ago

Sometimes you just need to look at the spread on the instrument you are trading, if you notice your broker has increased/widened the spread, it means they know something you dont; theres probably incoming volatiility.

When volatility is high, your broker could reduce leverage. On the charts you also see unusually tall candlesticks

Y
@yokoyi - 4 months ago

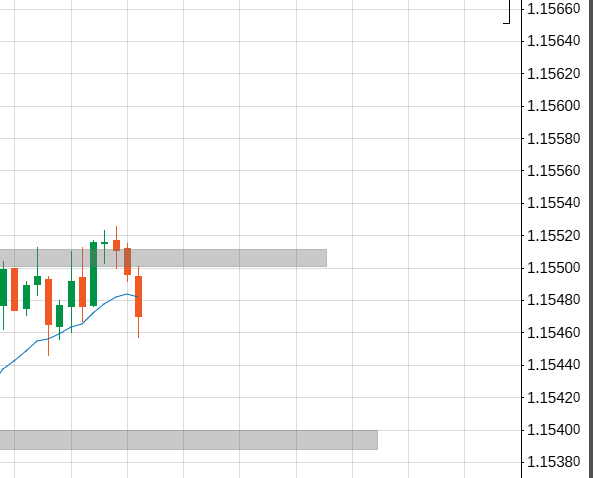
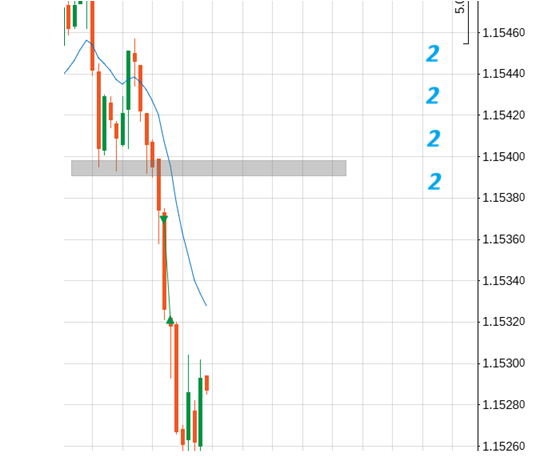
You could also activate "grid lines" on your chart and check pip value the spacing between each box. From the image I attached the pip spacing is 2 pips which is small and indicates low volatility. On some highly volatile days the spacing between the grids could be as high as 10 pips. To calculate the spacing between the grids just subtract the prices between two boxes

Y
@yokoyi - 4 months ago

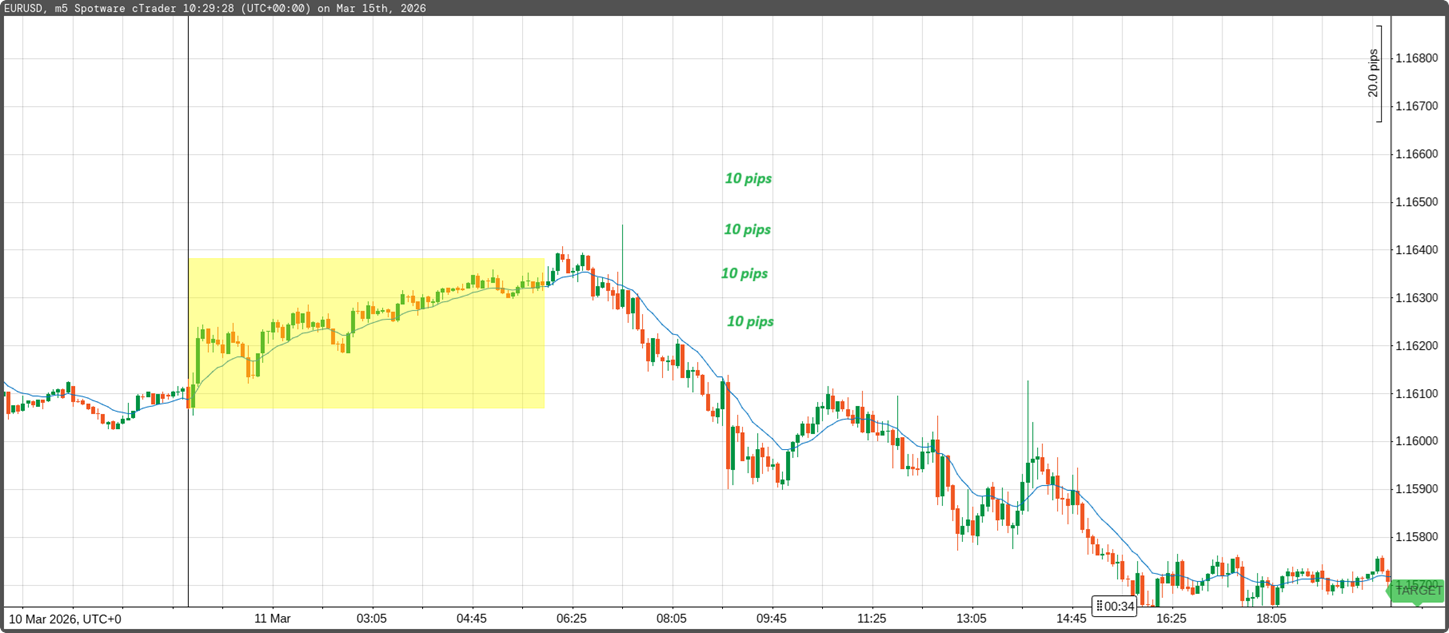
In this chart image the grid line spacing is 10 pips each which indicates higher volatility.

B
@brenda_lesotho - 3 months ago
Quoted - yokoyi

In this chart image the grid line spacing is 10 pips each which indicates higher volatility.

So, basically as volatility increases the difference between the prices for each grid box becomes bigger.

Y
@yokoyi - 3 months ago
Quoted - brenda_lesotho

So, basically as volatility increases the difference between the prices for each grid box becomes bigger.

Yes @brenda. Today volatility is low so even though the candles look big when you check the difference between the price it will give you 2 pips per box. Example 1.15460 - 1.15440 = 2 pip

Disclaimer:

At MyTradingLand.com, we connect you with forex brokers and provide a community for traders. While we offer valuable information and resources, please note that we are not financial advisors and cannot provide personalized financial advice. Always conduct your own research and invest responsibly.

Community Guidelines: The MyTradingLand.com community is designed as a resource for forex traders, promoting respectful and constructive discussions. We reserve the right to remove any content that is misleading, abusive, or violates our terms of service.

Broker Information: While we may receive commissions or advertising income from some of the brokers listed, this does not imply an endorsement of any broker, nor does it affect our review process. Our evaluations are based solely on objective criteria and user feedback.

Always verify the regulatory status of any broker with your local financial authority, along with their terms and privacy policies, before engaging with them. It is crucial to conduct thorough research to ensure that you are making informed decisions.

Risk Warning: At MyTradingLand.com, we strive to provide accurate information; however, the forex market is highly volatile and can change rapidly. It is essential to verify any information before making investment decisions.

Please be aware that trading in forex involves substantial risk, and it is possible to lose more than your trading equity/investment capital. 70-90% of retail CFD traders incur losses in their trading activities as per information from various brokers.

You are solely responsible for your use of MyTradingLand.com and any trading decisions you make. We encourage all users to educate themselves thoroughly about forex trading and to consider seeking advice from qualified financial professionals.

Advertising Disclosure: We may earn commissions from recommended brokers, but our reviews are independent (not influenced by potential earnings). Sponsored content is clearly marked and doesn't reflect our views.

©2026 ©2025 All rights reserved Mytradingland.com