📚 Understanding Market Structure Through the Lens of Smart Money Concepts (SMC)
Most traders define market structure as simply higher highs, higher lows, lower highs, and lower lows. While that's correct, advanced SMC traders look much deeper.
Market structure is the footprint of institutional order flow.
🔹 The Market Doesn't Move Randomly
Every move in price is driven by one objective:
Seeking liquidity.
Institutions require liquidity to execute large positions, which is why price constantly moves from one liquidity pool to another.
🔹 Break of Structure (BOS)
A Break of Structure occurs when price successfully breaks a protected swing point in the direction of the trend.
In a bearish market:
✔ Lower highs form
✔ Price breaks previous lows
✔ Sellers maintain control
A BOS confirms continuation of institutional order flow.
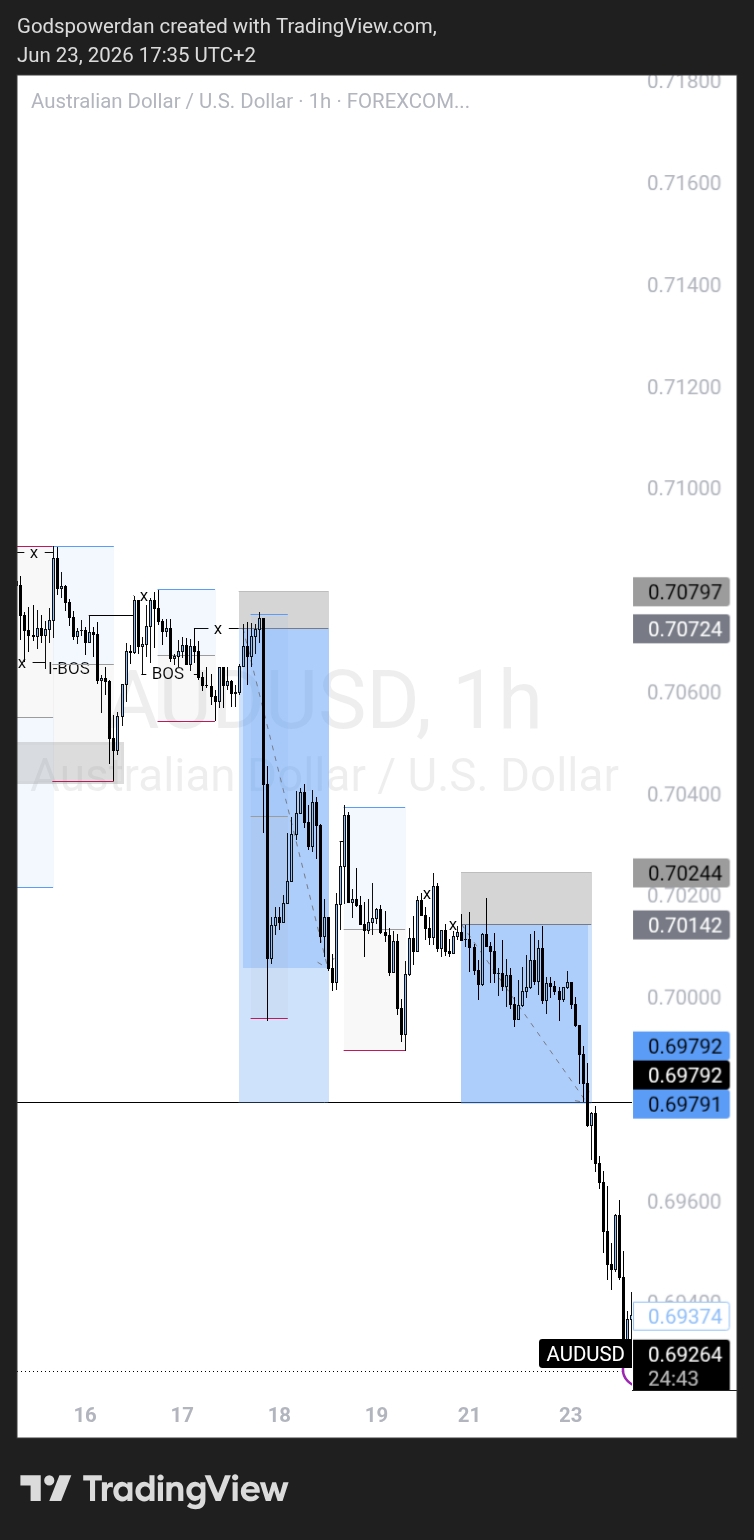
On the AUD/USD chart, multiple bearish BOS formations can be seen as price continuously breaks previous support levels.
🔹 Change of Character (CHOCH)
A CHOCH is often the first warning sign that the current trend may be ending.
For example:
Bearish Trend:
Lower High
Lower Low
Lower High
Then price suddenly breaks a significant Lower High.
This creates a bullish CHOCH.
A CHOCH doesn't confirm a reversal—it simply alerts traders that order flow may be shifting.
🔹 Internal vs External Structure
Advanced SMC traders separate structure into:
Internal Structure
Smaller moves occurring within a larger trend.
External Structure
Major swing highs and lows that define the broader market direction.
Many retail traders get trapped by focusing only on internal structure while institutions trade from external liquidity objectives.
🔹 Protected Highs and Protected Lows
In SMC, every trend has protected levels.
In a bearish market: 🔹 Protected High = Last Lower High
In a bullish market: 🔹 Protected Low = Last Higher Low
Until these levels are violated, the trend remains intact.
Looking at AUD/USD, sellers continue defending protected highs, keeping bearish order flow valid.
🔹 Displacement
One of the strongest signs of institutional activity is displacement.
Characteristics include:
✅ Large impulsive candles
✅ Strong imbalance creation
✅ Aggressive break of structure
Notice how AUD/USD created strong bearish displacement through multiple support levels.
This suggests significant selling pressure rather than random market movement.
🔹 Fair Value Gaps (FVGs)
When displacement occurs, inefficiencies are created.
These inefficiencies are called Fair Value Gaps.
Institutions often revisit these areas before continuing the trend.
The bearish moves on AUD/USD have left several imbalances that may later serve as points of interest.
🔹 The Narrative Behind This Chart
The chart tells a simple institutional story:
1️⃣ Liquidity was engineered above short-term highs.
2️⃣ Price delivered bearish displacement.
3️⃣ Multiple bearish BOS formations confirmed continuation.
4️⃣ Sellers continued defending premium areas.
5️⃣ Price aggressively repriced lower toward external liquidity.
This is not simply "price going down."
This is a sequence of liquidity engineering, displacement, structure breaks, and repricing.
🎯 Advanced SMC Takeaway
The question isn't:
❌ "Is the market bullish or bearish?"
The better question is:
✅ "Where is the next liquidity objective, and what structure is price using to reach it?"
Market structure is simply the roadmap institutions leave behind while pursuing liquidity.