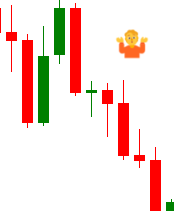
for a beginner how would you explain what candlesticks mean on a chart?
It will depend on the timeframe on which you are viewing the charts, this is very important.
For example if you are viewing the charts on a 5 Minute time frame, then every candlestick represents 5 minutes of price movement, etc.
Just like Sandy has said, the candlestick is a representation of the timeframe which you are analyzing the charts through. Set it to 1 hour time frame and each candle will show you the past opening and closing price for every 1 hour that passed.