are wicks important in trading?
wicks are tail-like shapes that appear above or below a candle. Wicks show you that price went a certain direction but met a resistance and was pushed back. Wicks that appear at the end of an uptrend or bottom of a down trend may signify a trend reversal (but not in every case).
In this image you can see the little wicks followed by a trend reversal. The wicks are most useful when they appear at the top or bottom of a trend.
Wicks are extremely important in trading. Wicks tell you a story of how buyers and sellers reacted to price reaching a particular level.
Whenever I see several wicks assemble around the same price level, chances are a trend reversal is about to happen.
I consider wicks as part of a candlestick. I pay a lot of attention to them .
Wicks are important especially when trying to mark out trading sessions on the chart
Wicks show you the highest and lowest levels price has reached during a certain period of time. If you are into technicals, wicks cannot be overlooked.
In technical analysis, traders often focus on the body of a candlestick to determine market direction, strength, and sentiment. However, the wick—also called the shadow—is equally significant and often far more informative. Wicks provide insight into market psychology, institutional activity, and the underlying battle between buyers and sellers. While the candle’s body reveals where price opened and closed, the wick reveals what happened in between. This “hidden information” makes wicks a crucial component in understanding price behavior.
@headies you are right, the body of a candle is what you use to determine the open and closing prices but the wick is what you use to determine the highest and lowest prices.
In technical analysis, traders often focus on the body of a candlestick to determine market direction, strength, and sentiment. However, the wick—also called the shadow—is equally significant and often far more informative. Wicks provide insight into market psychology, institutional activity, and the underlying battle between buyers and sellers. While the candle’s body reveals where price opened and closed, the wick reveals what happened in between. This “hidden information” makes wicks a crucial component in understanding price behavior.
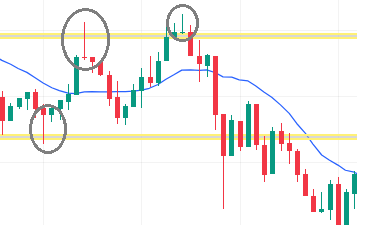
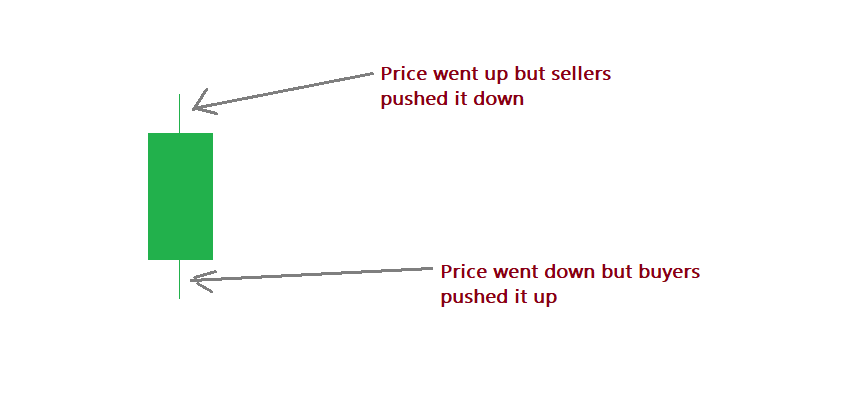
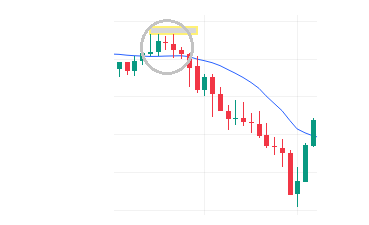
To begin with, wicks convey the concept of price rejection. A long upper wick suggests that buyers attempted to push price higher but were overpowered by sellers, resulting in a rejection of higher prices. Conversely, a long lower wick indicates that sellers attempted to force price down, but buyers absorbed that pressure and caused price to rise again before the candle closed. These rejections are not random; they reflect the emotional and strategic decisions of participants in the market. As traders react to news, key levels, or liquidity areas, wicks represent the points where one side attempted to gain control but ultimately failed. Thus, wicks often warn of potential reversals or weakening momentum.
Beyond simple rejection, wicks provide critical clues about liquidity and institutional order flow. Large market participants—often called “smart money”—tend to execute orders in areas where liquidity is concentrated. These areas are commonly found above previous highs and below previous lows. When price briefly spikes into such levels and immediately retreats, it often forms a distinctive wick. This behavior may signal a liquidity grab or stop hunt, where the market collects resting orders before moving in the opposite direction. For traders who understand this concept, wicks can serve as confirmation that a key liquidity event has occurred, often preceding significant directional moves.