BTC FUNDAMENTAL AND TECHNICAL ANALYSIS
N
@nsg_usd - 1 month ago
Quoted - asuquokelvin

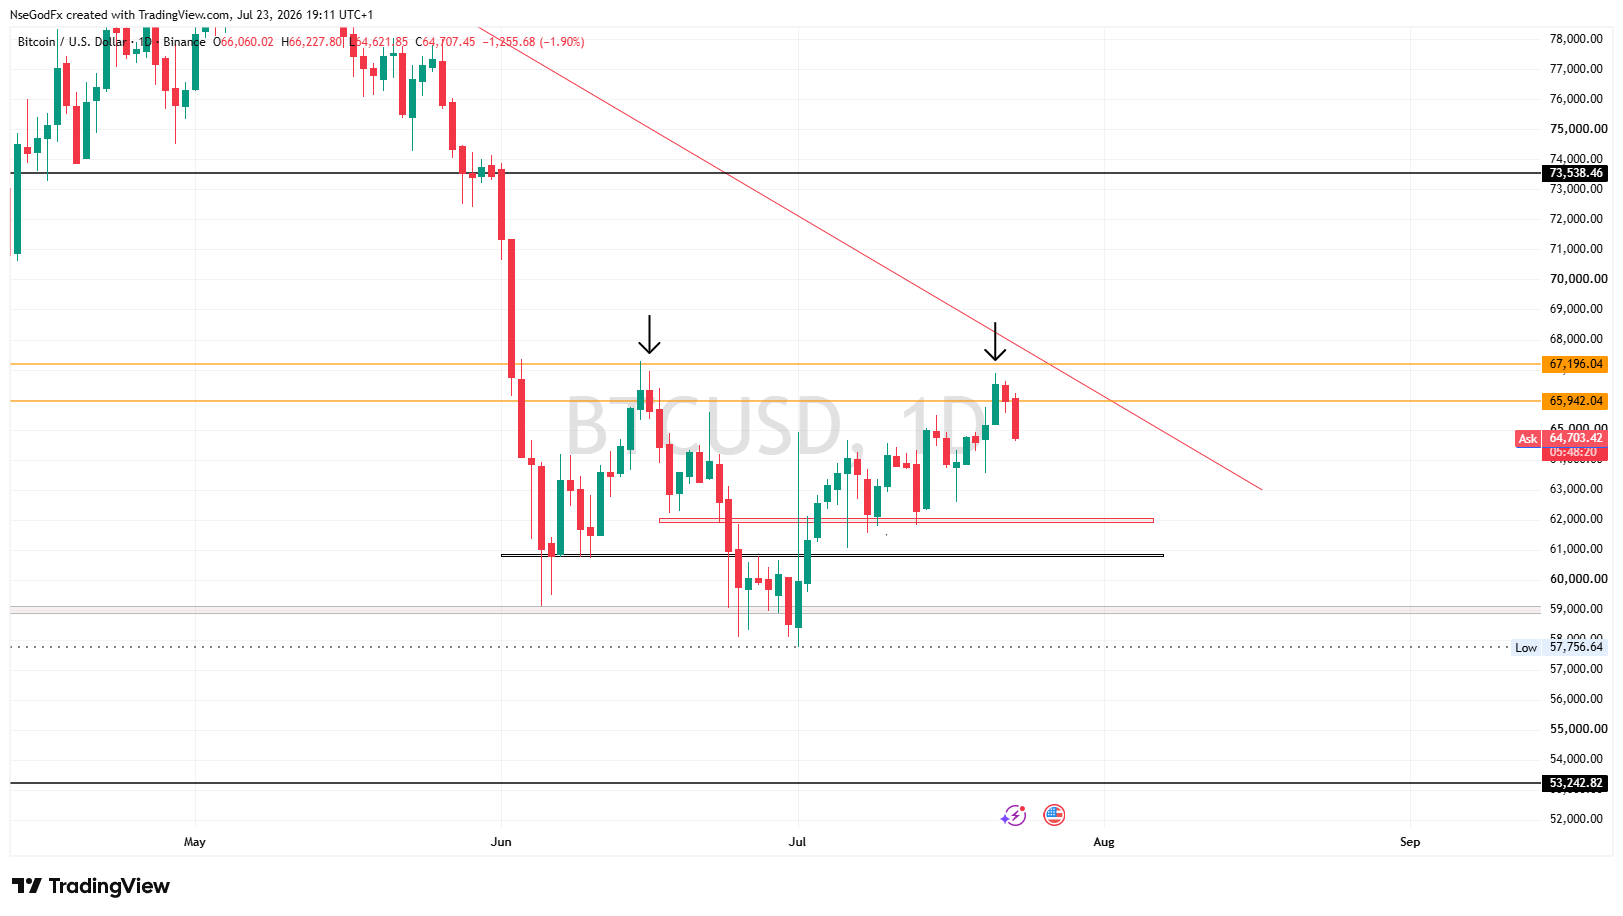
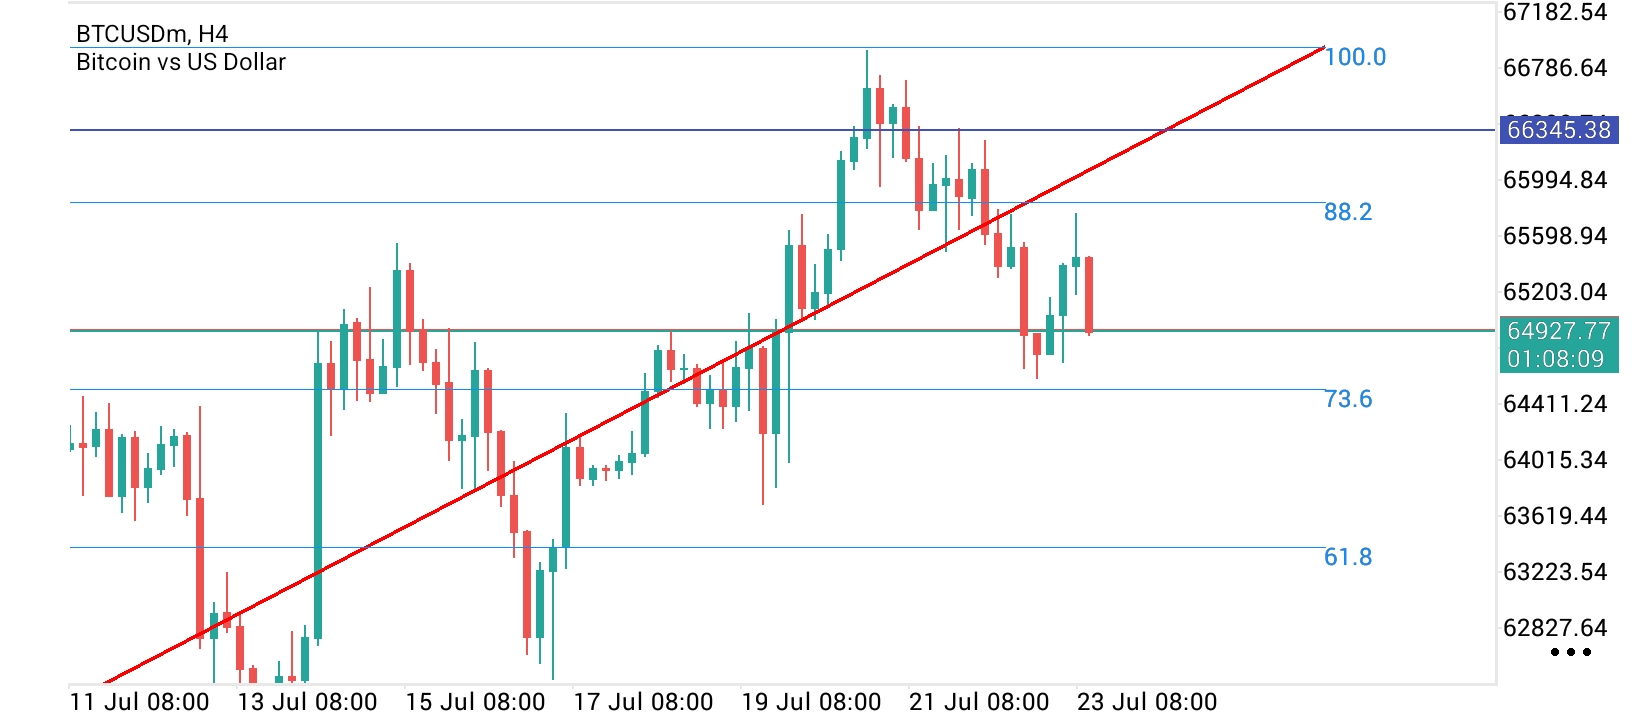
Price may not necessarily form a double top at that daily level, but can reverse because it is in the supply level of the entire daily bearish move I marked using the red trend line

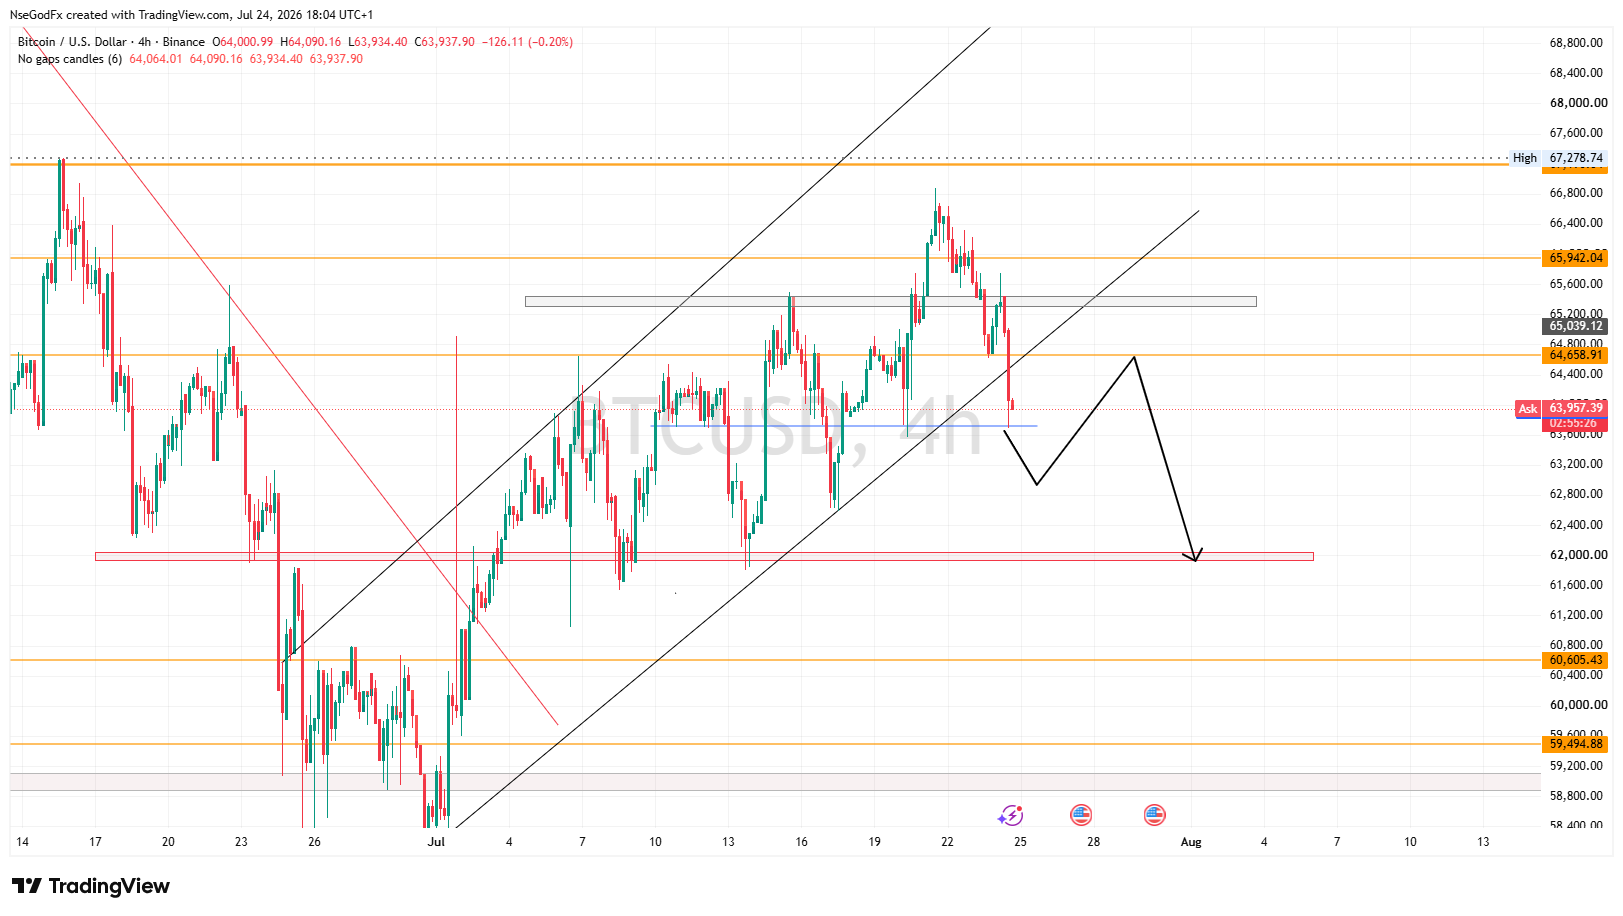
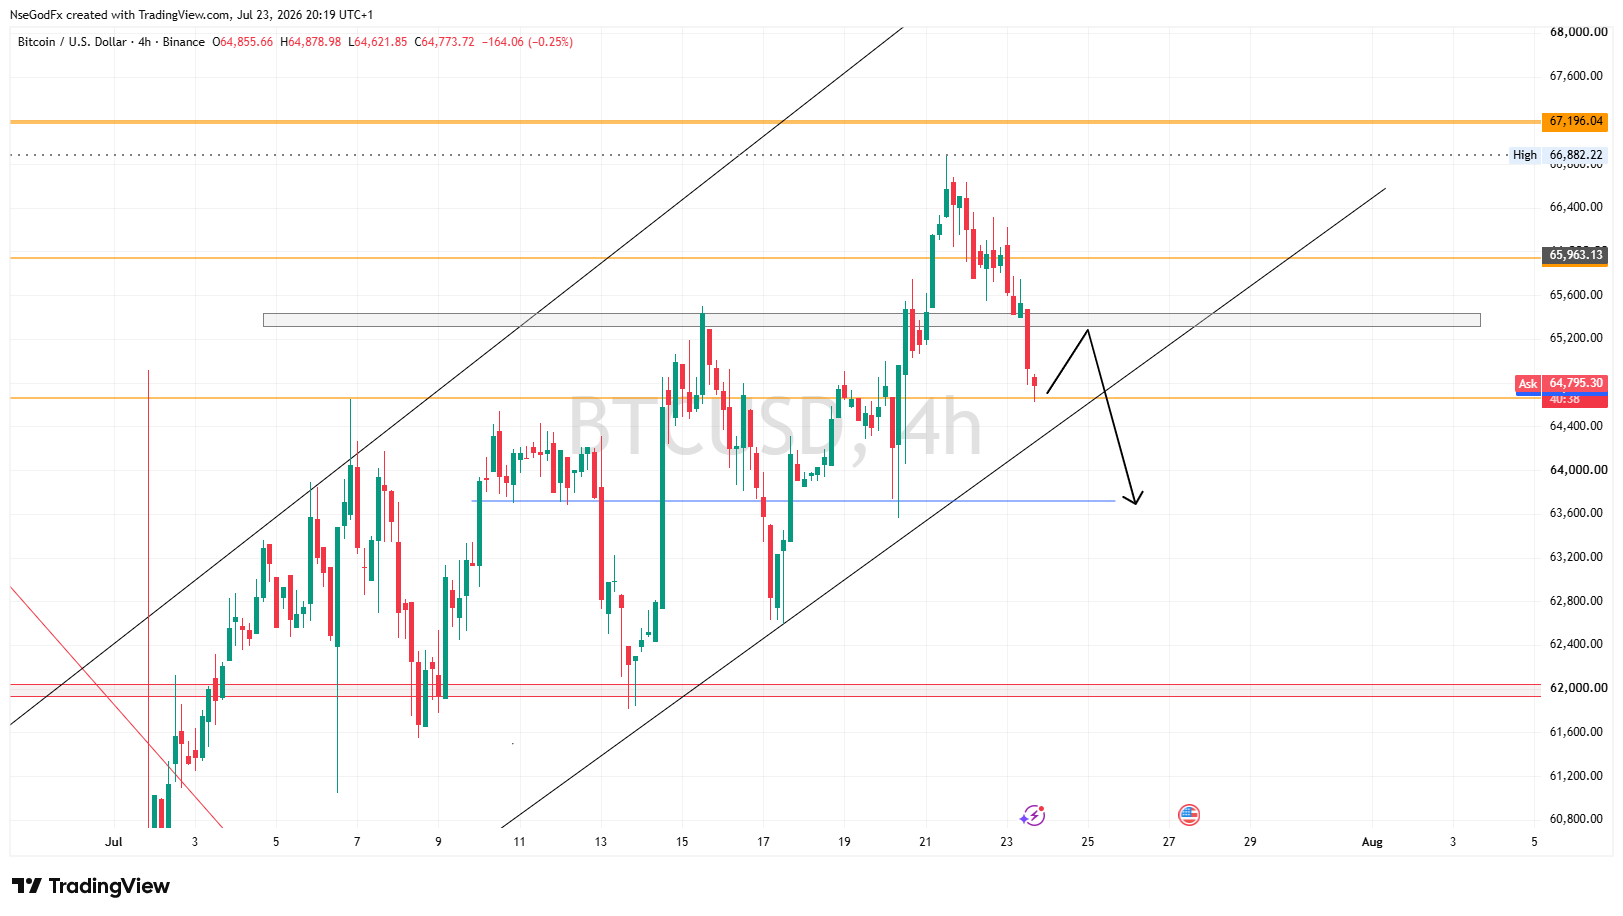
BTC- The double top has been formed. Expecting a Dip back to 62,000 or 60,000.
Without invalidation of the double top, hopes of continuing the buys the month is slim, will expect the buys next month.

N
@nsg_usd - 1 month ago
Quoted - asuquokelvin

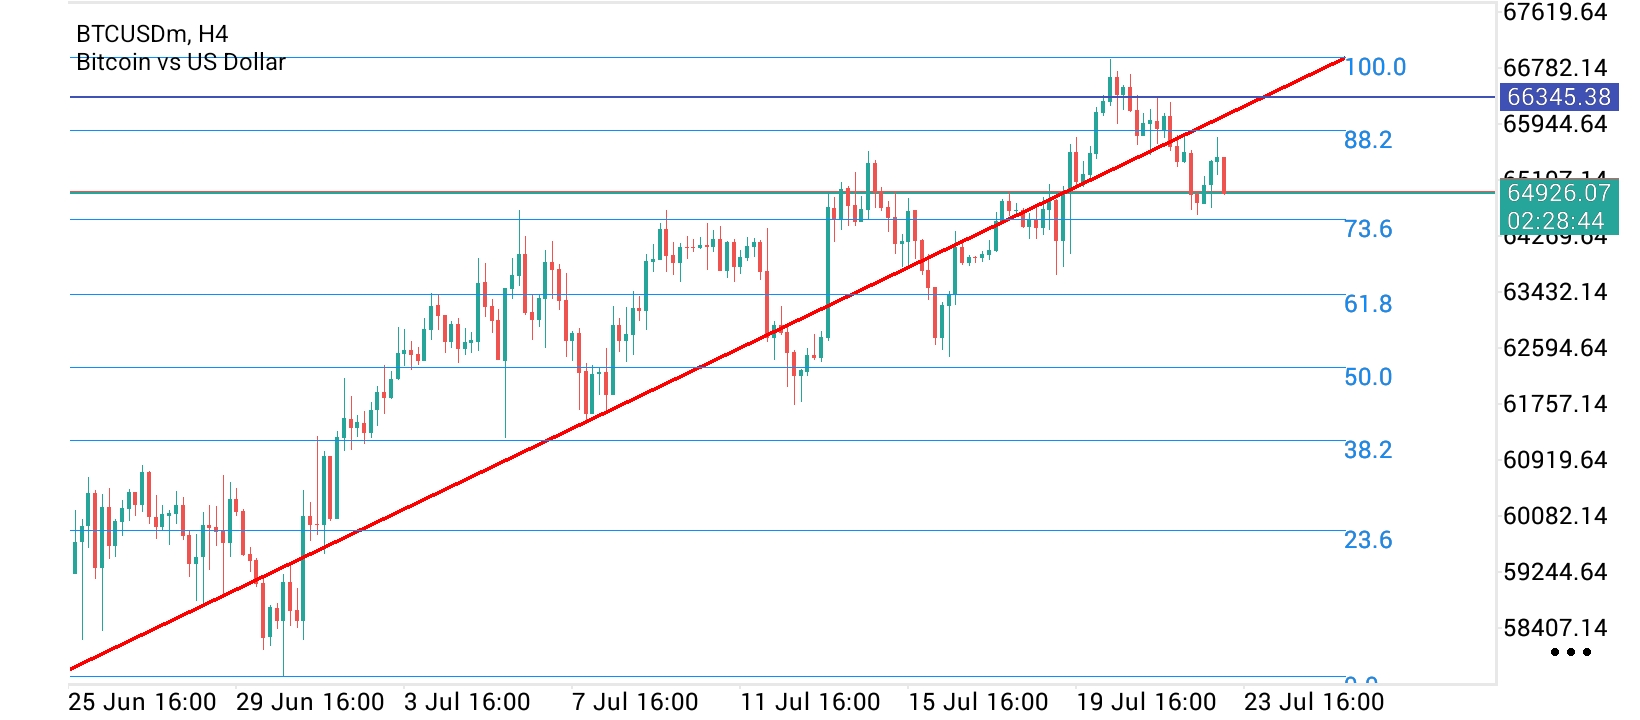
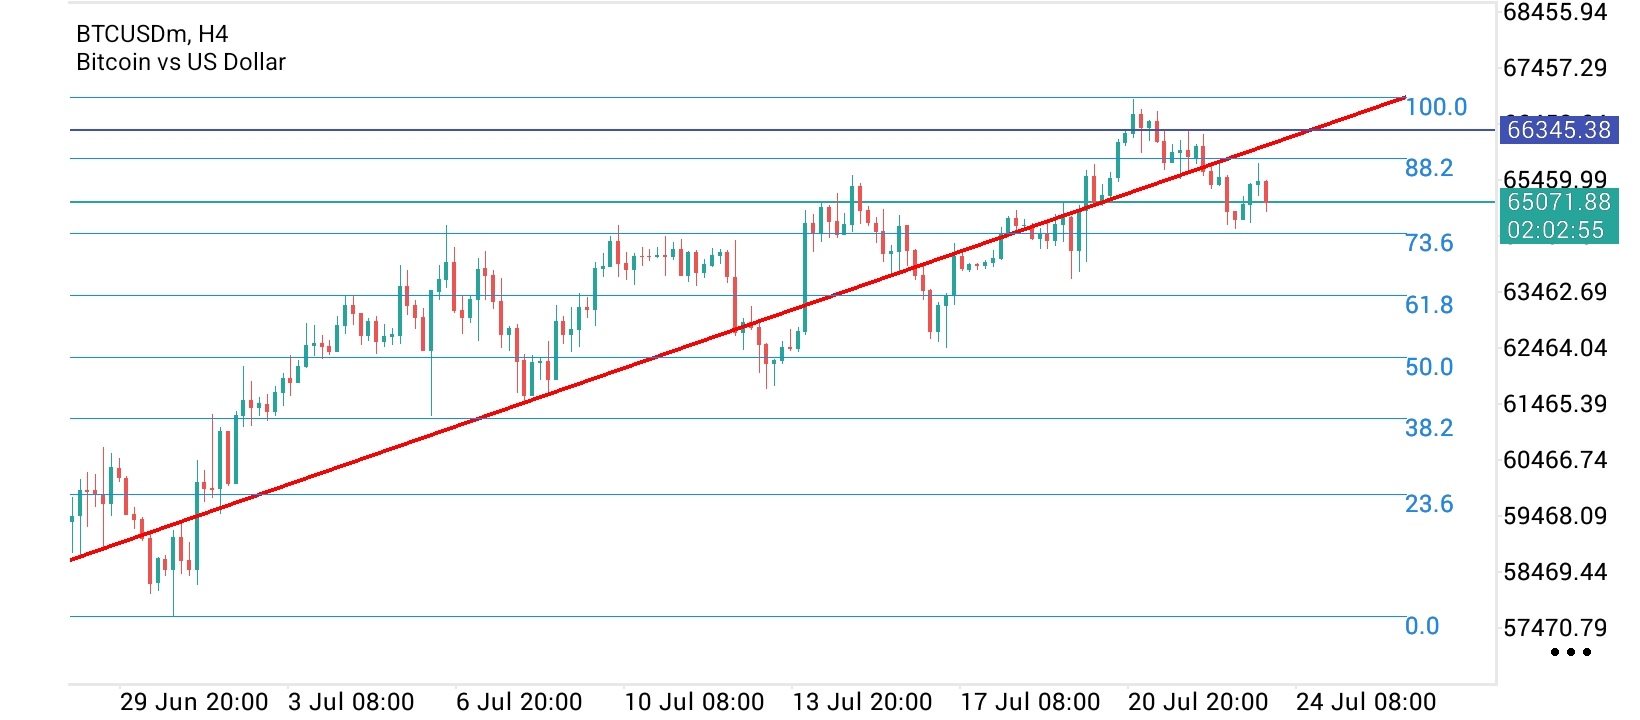
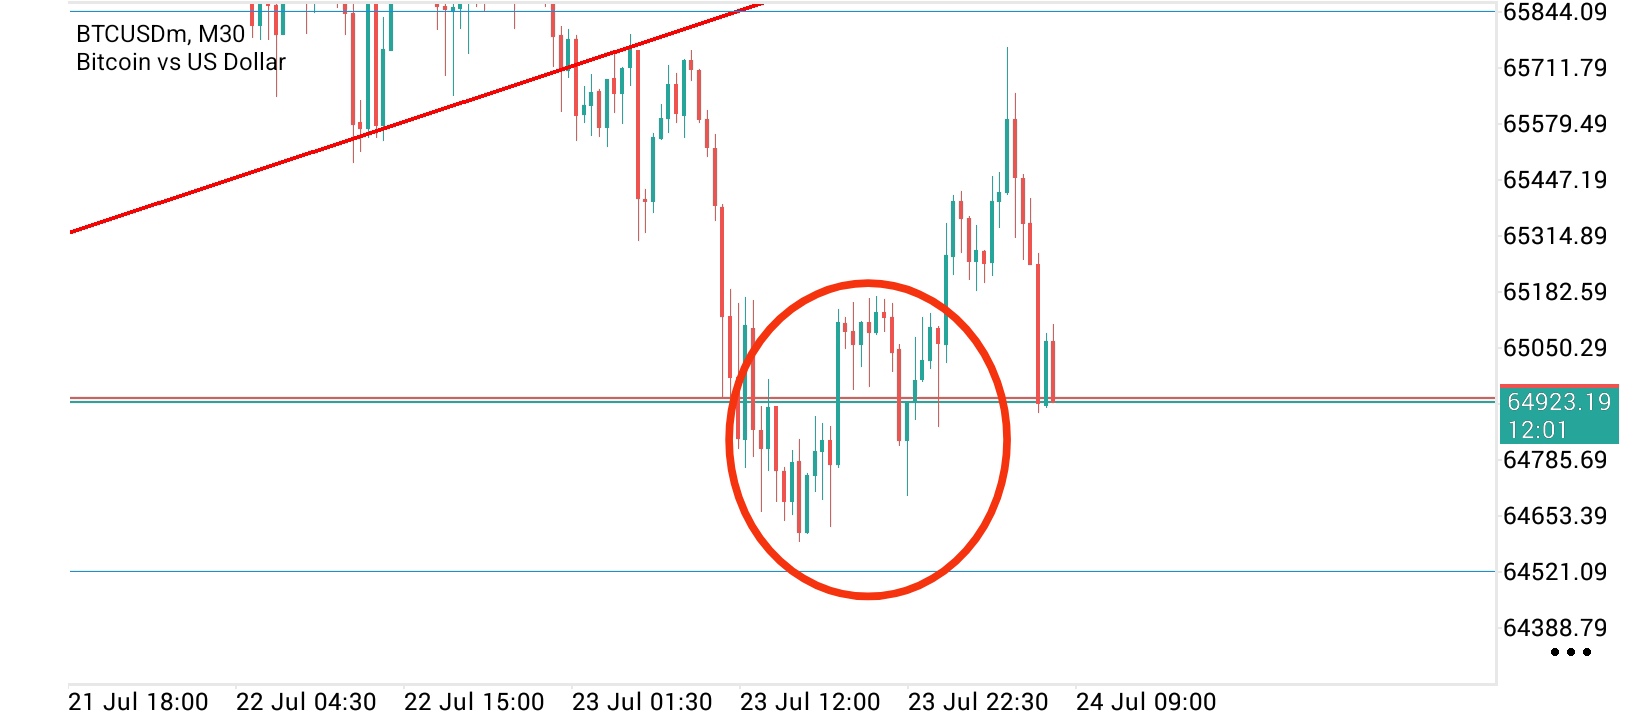
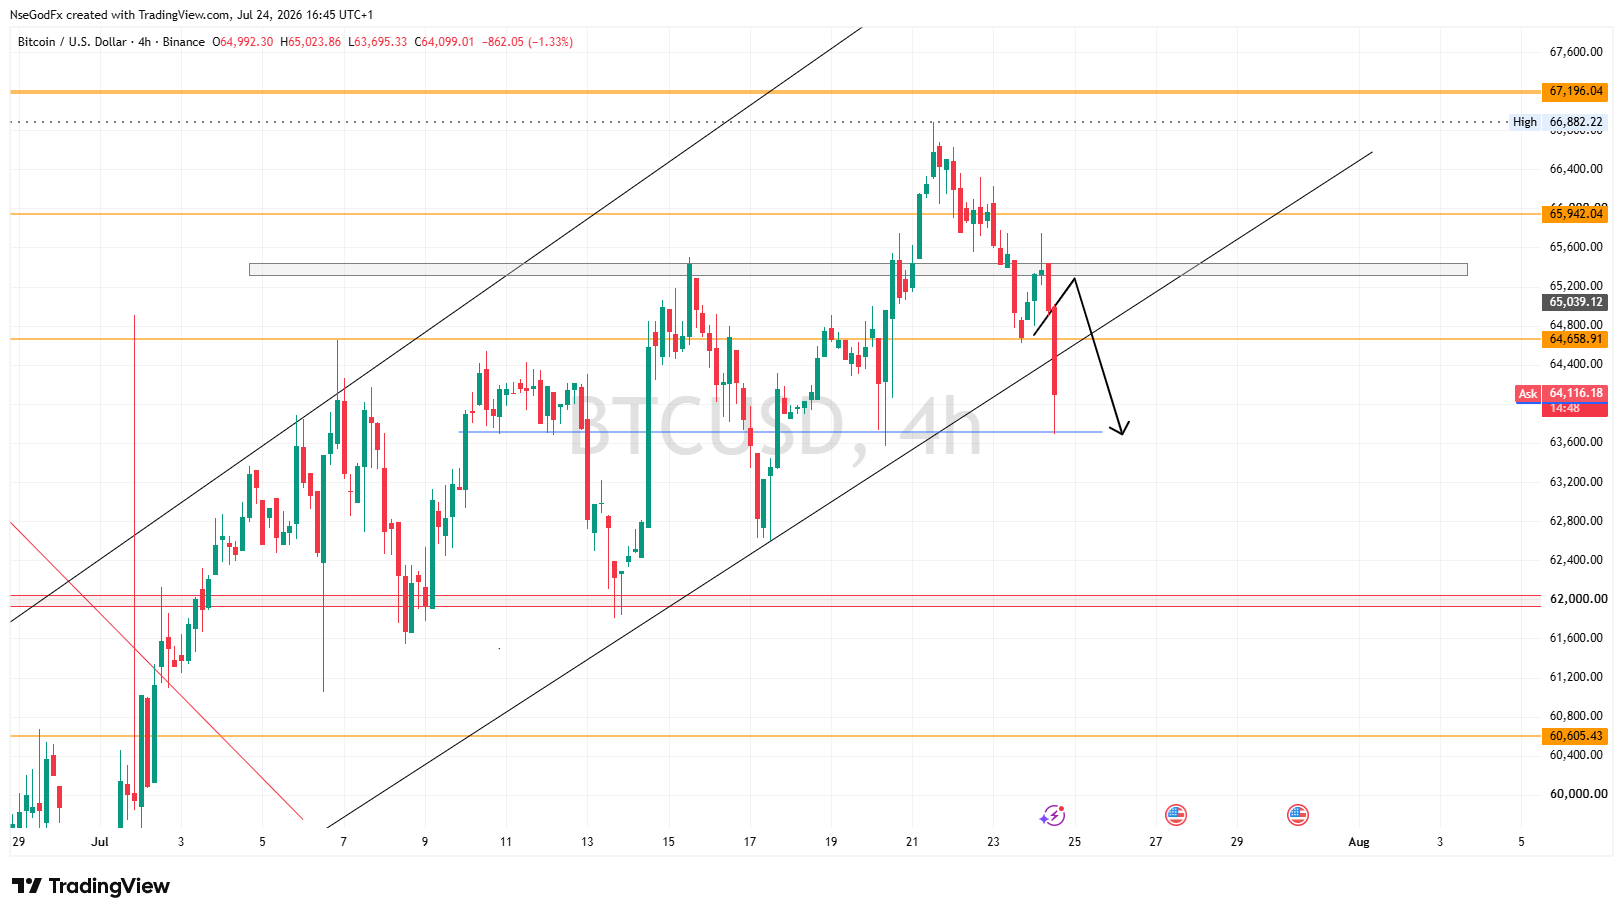
BTC right now is showing Reversal on the 4hr the yellow marker region is showing a mitigation, which signifies that the trend is weak and becoming bearish it's only a close above the recent highs that can prove otherwise

BTC- I'm not convinced the first reaction zone will hold for long. will expect it to drive the buys to 65,400 and then the sells will continue. Except it invalidates that 65400 price level again, then I'll expect the rally to continue.

G
@godspowerdan - 1 month ago
Quoted - asuquokelvin

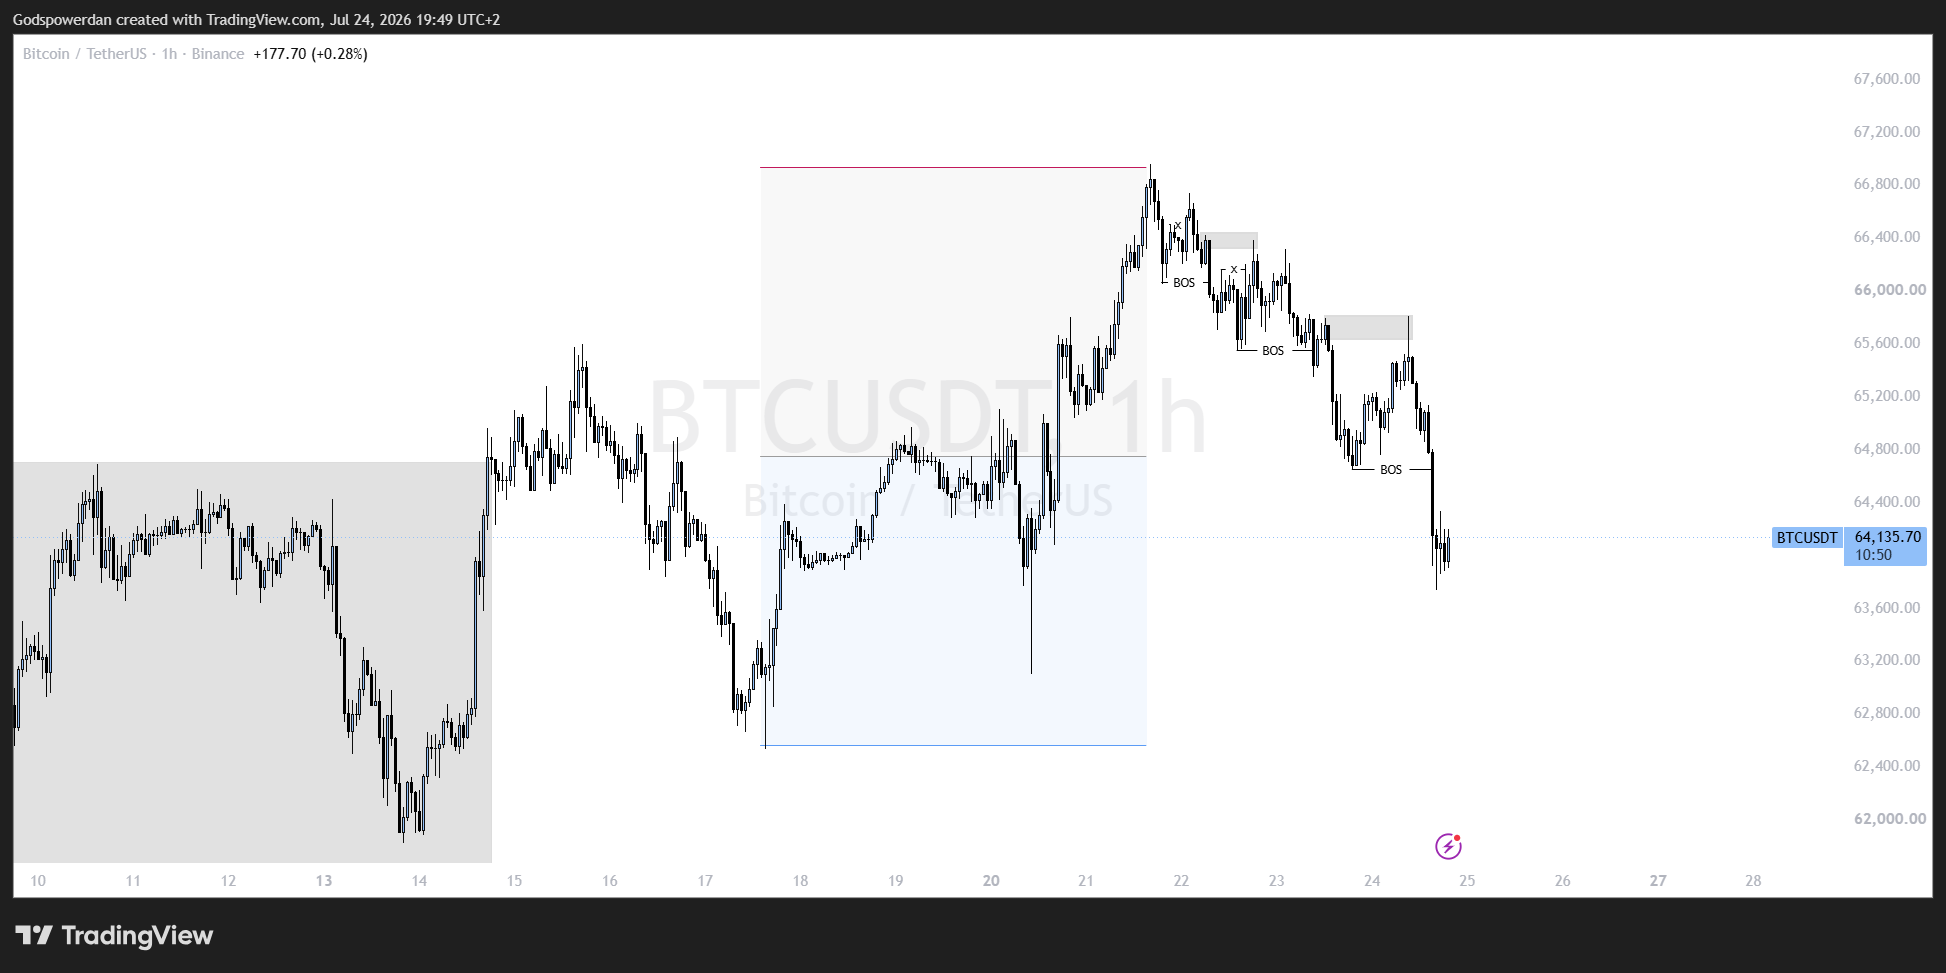
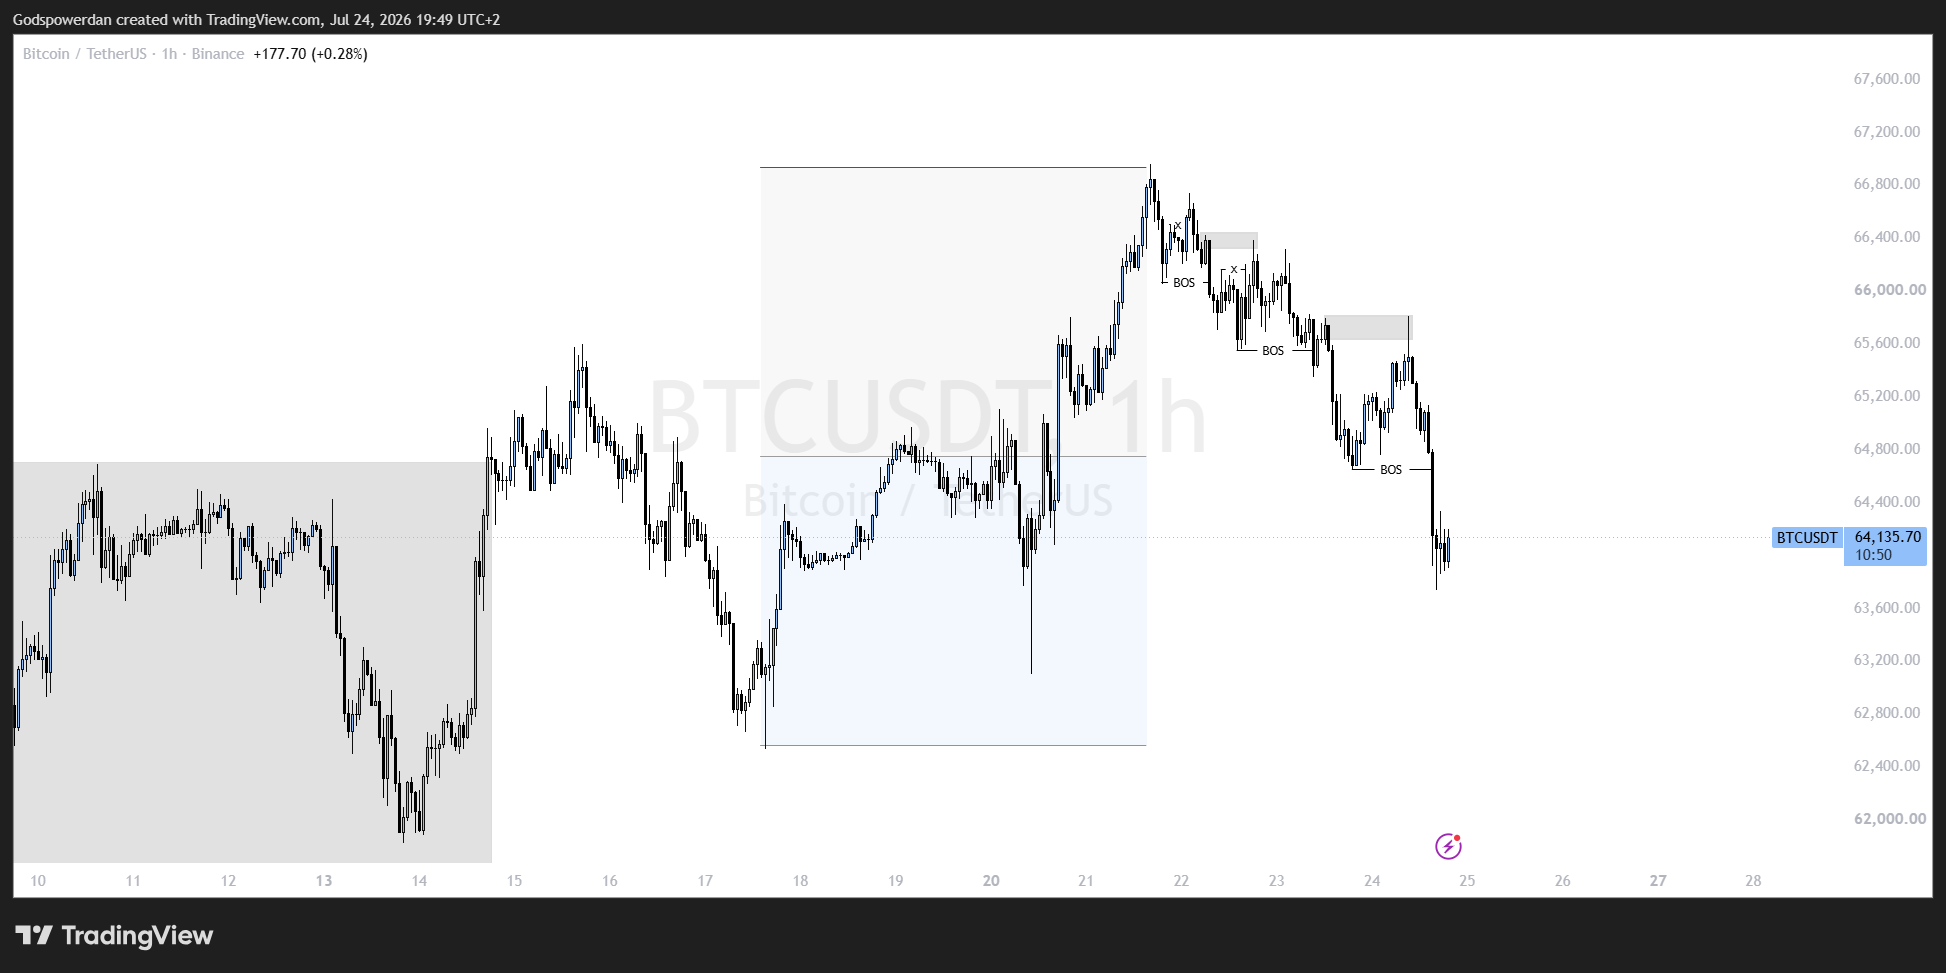
Price is still trading below that protected high that I marked with the yellow box

You should be looking for sells then. As long as the highs are protected, the sells will keep coming in

A
@asuquokelvin - 1 month ago
Quoted - godspowerdan

You should be looking for sells then. As long as the highs are protected, the sells will keep coming in

I have marked the entire swing level, I would sell if I have opportunities because that is still the premium level of the sell swing, but haven't seen a good opportunity

A
@asuquokelvin - 1 month ago
Quoted - nsg_usd

BTC- The double top has been formed. Expecting a Dip back to 62,000 or 60,000.
Without invalidation of the double top, hopes of continuing the buys the month is slim, will expect the buys next month.

What you are marking sorry but it's not a double top at least I have done pattern for a year, but what you are marking is not a double top at all, what I mark is a double top, check the chart image

A
@asuquokelvin - 1 month ago
Quoted - nsg_usd

BTC- The double top has been formed. Expecting a Dip back to 62,000 or 60,000.
Without invalidation of the double top, hopes of continuing the buys the month is slim, will expect the buys next month.

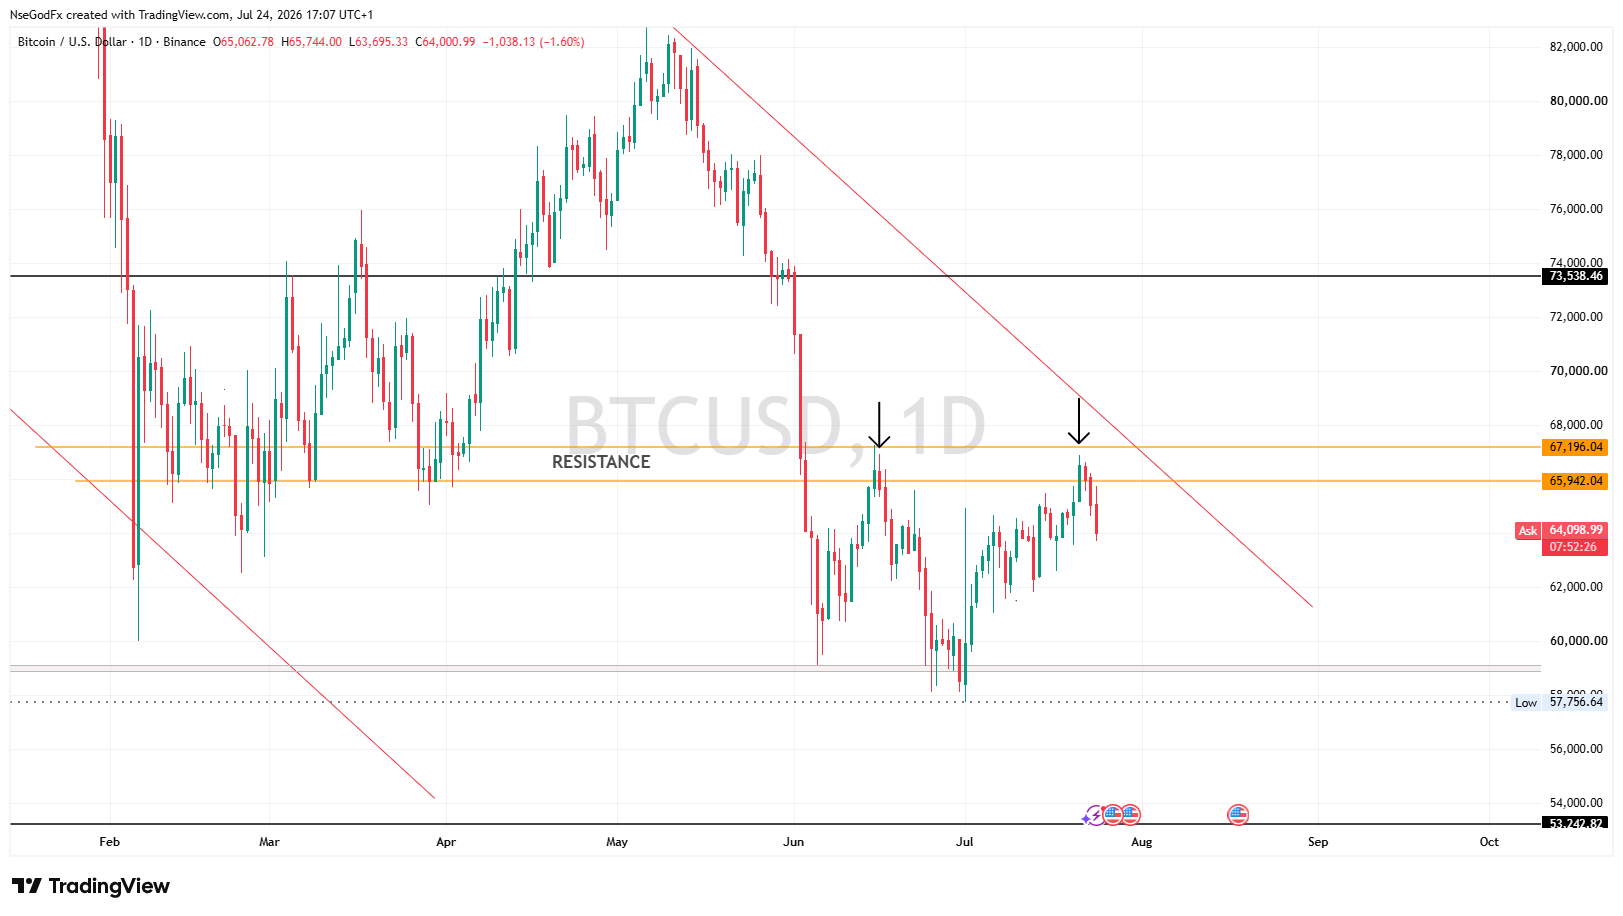
Sorry sir but that is not double top let me break it down , the first arrow is a bearish order block, then the second arrow is a pullback to that bearish order block level, now double top is for reversal and in a bearish trend you can't see a double top in the middle of the trend what you can see is a failed double bottom I have done pattern for a year, so I know how it works, double top and double bottom are strong reversal patterns but must only form at trend exhaustion levels and also have an external or engineering liquidity to confirm it's validation, for example what I just marked in that chart is a double bottom but it's forming in a wrong level which is a supply level and yiu can see that price is breaking below it already so you can call it a failed double bottom, you can't see a double top in a bearish trend it's not possible, I know you will still argue it, but a true double top pattern only forms in a bullish trend like I showed you, describing the both of them, double top occurs after a pullback to a bullish order block and price fails to break above the highs that made the pullback and it now becomes a mitigation block breaking below the neck line, same for double bottom, it is when price makes a pullback into a bearish order block and reverse back but cannot break below the lows that made the pullback and become a mitigation block breaking above the neck, am really taking my time to explain this and they are only known for reversals not continuation, check the chart image for example, the trend levels where they forms actually matter a lot take note

A
@asuquokelvin - 1 month ago
Quoted - nsg_usd

BTC- I'm not convinced the first reaction zone will hold for long. will expect it to drive the buys to 65,400 and then the sells will continue. Except it invalidates that 65400 price level again, then I'll expect the rally to continue.

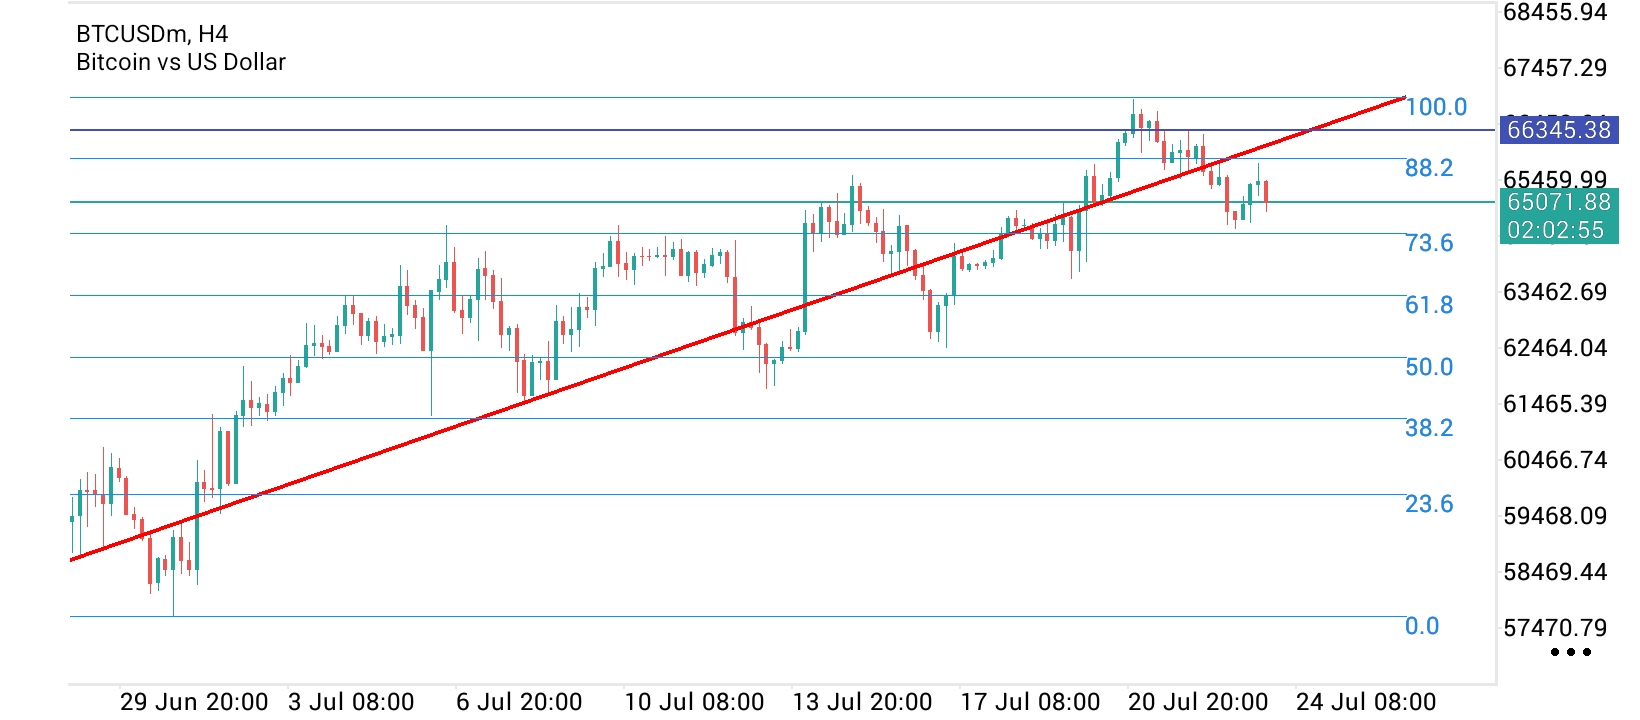
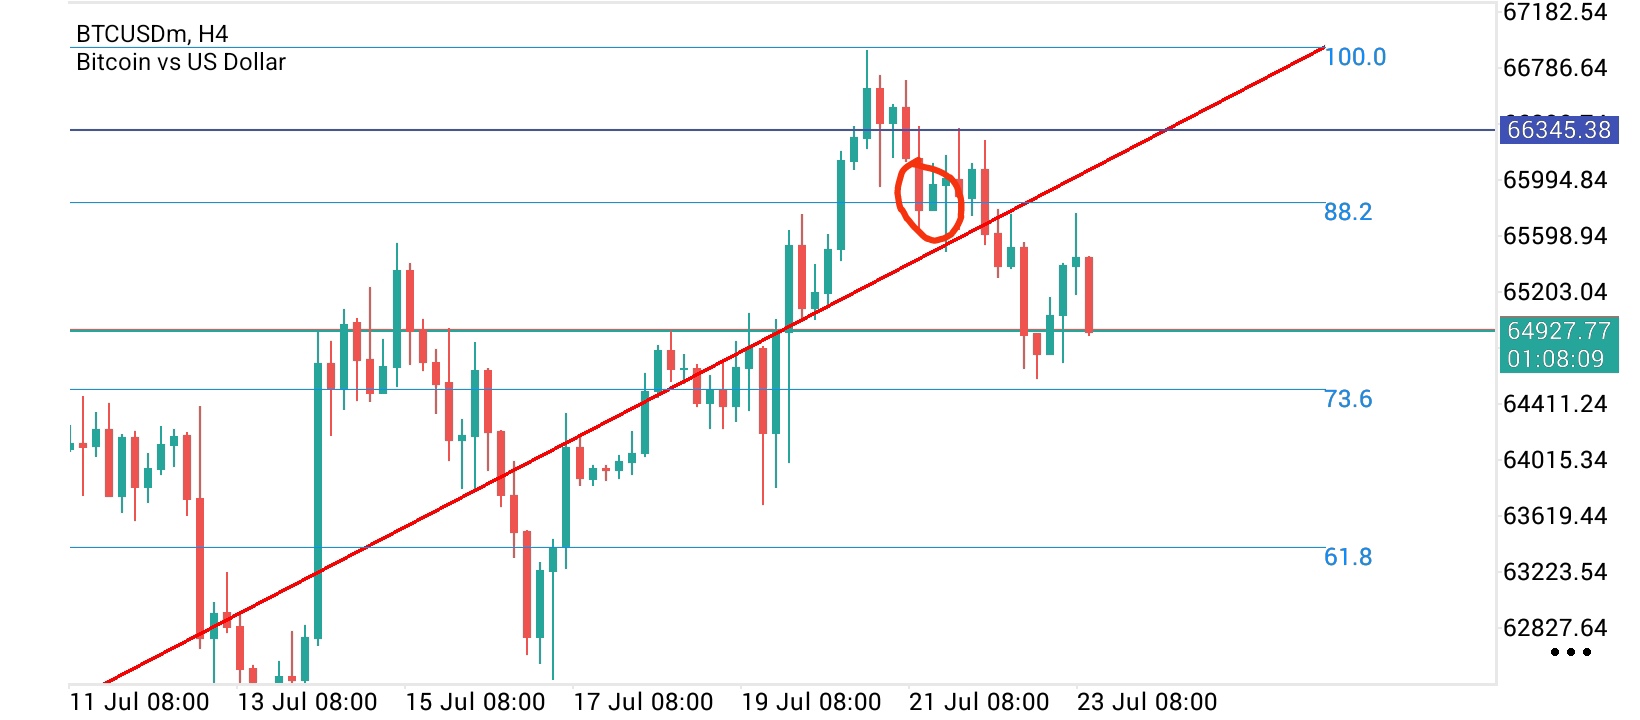
My bias has also changed because of the mitigation block formed on 4hr timeframe which I circled in the image, price tried to break above that previous high but failed and broke below the bulilish candle that started the move, which gives us both a mitigation block to trade from

N
@nsg_usd - 1 month ago
Quoted - asuquokelvin

Sorry sir but that is not double top let me break it down , the first arrow is a bearish order block, then the second arrow is a pullback to that bearish order block level, now double top is for reversal and in a bearish trend you can't see a double top in the middle of the trend what you can see is a failed double bottom I have done pattern for a year, so I know how it works, double top and double bottom are strong reversal patterns but must only form at trend exhaustion levels and also have an external or engineering liquidity to confirm it's validation, for example what I just marked in that chart is a double bottom but it's forming in a wrong level which is a supply level and yiu can see that price is breaking below it already so you can call it a failed double bottom, you can't see a double top in a bearish trend it's not possible, I know you will still argue it, but a true double top pattern only forms in a bullish trend like I showed you, describing the both of them, double top occurs after a pullback to a bullish order block and price fails to break above the highs that made the pullback and it now becomes a mitigation block breaking below the neck line, same for double bottom, it is when price makes a pullback into a bearish order block and reverse back but cannot break below the lows that made the pullback and become a mitigation block breaking above the neck, am really taking my time to explain this and they are only known for reversals not continuation, check the chart image for example, the trend levels where they forms actually matter a lot take note

Okay. I understand the angle that you're coming from.
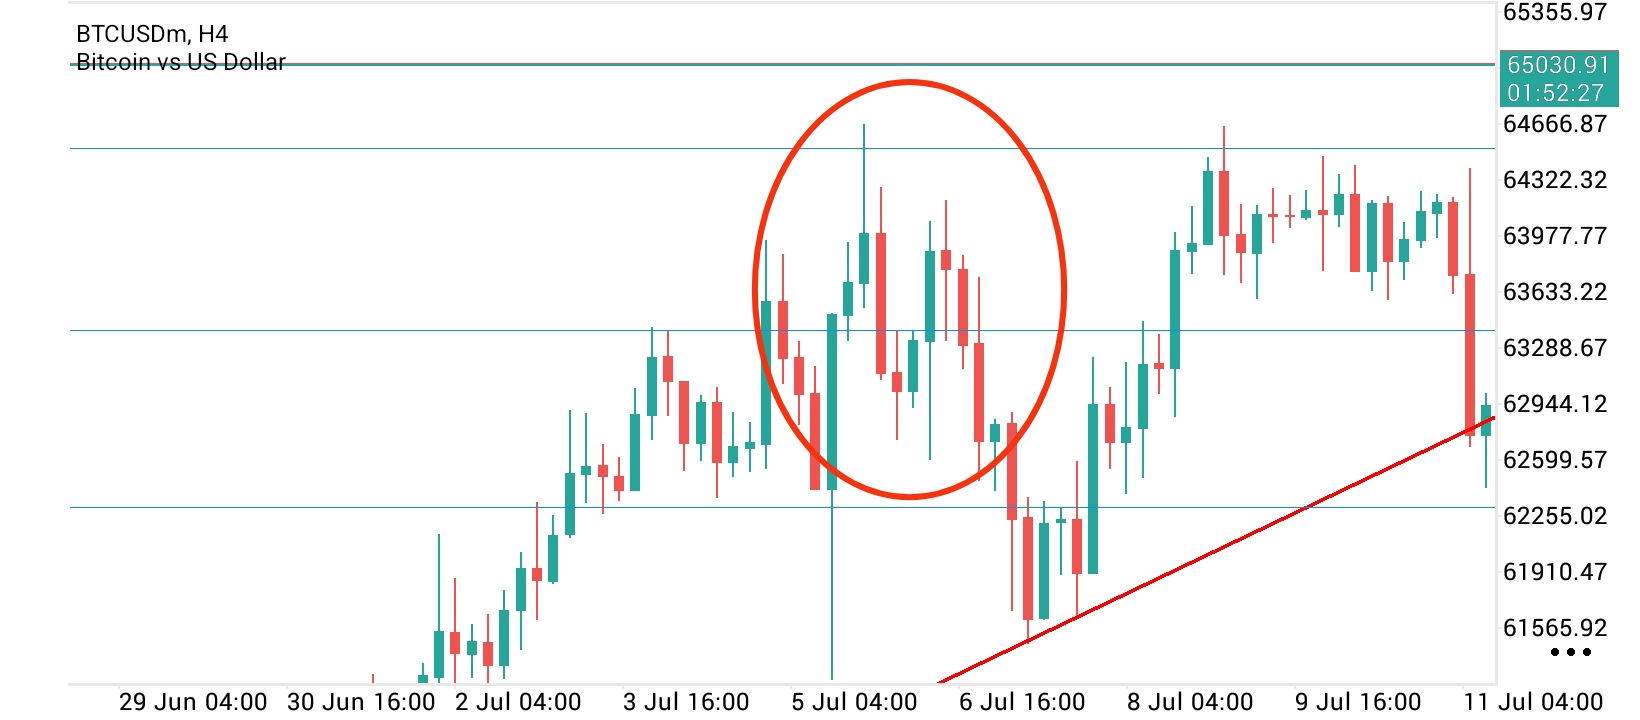
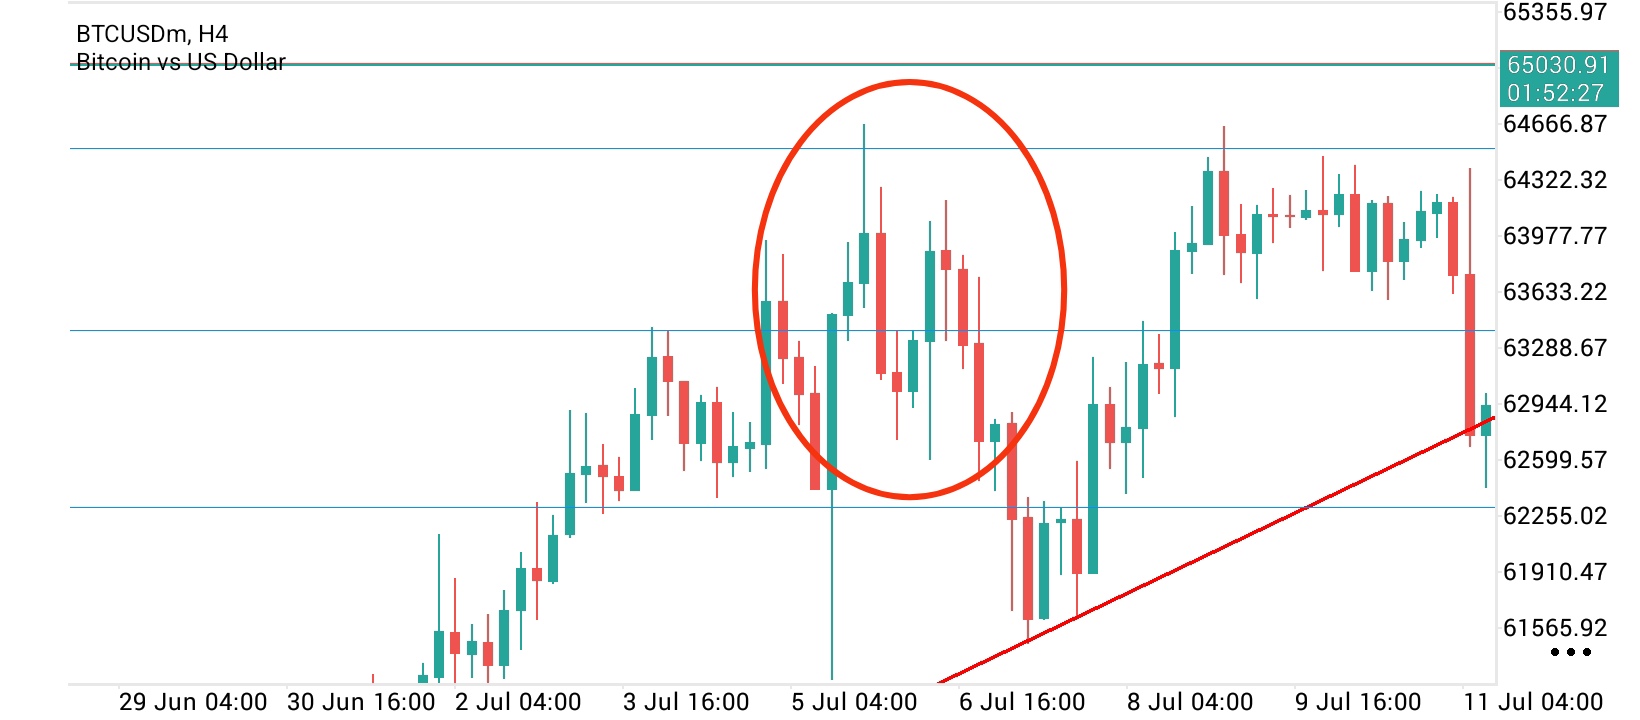
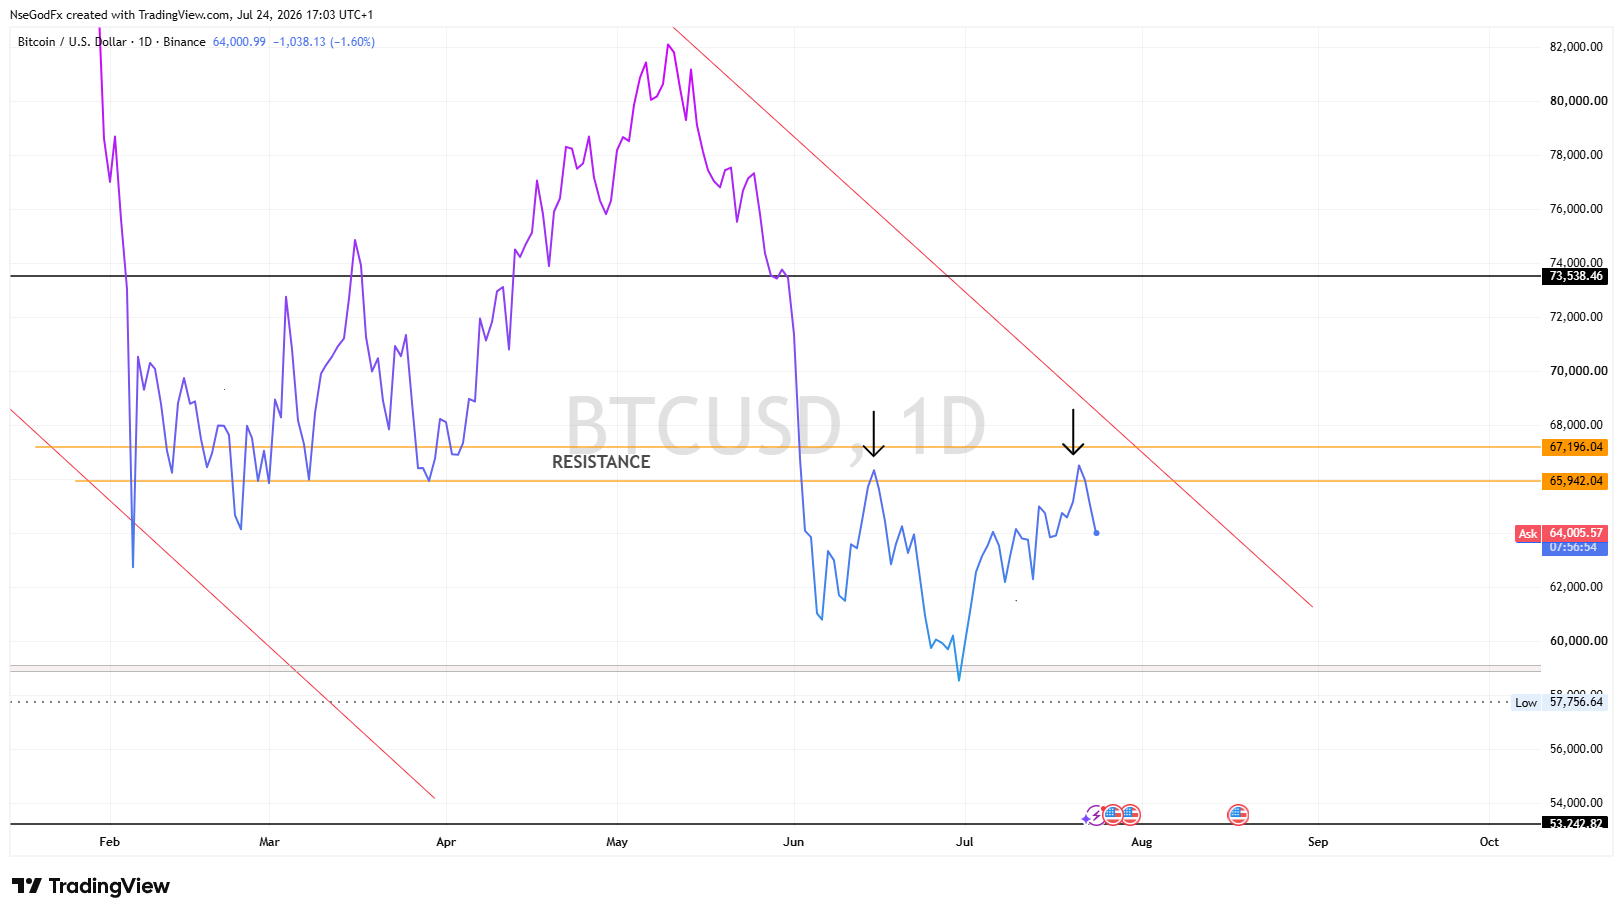
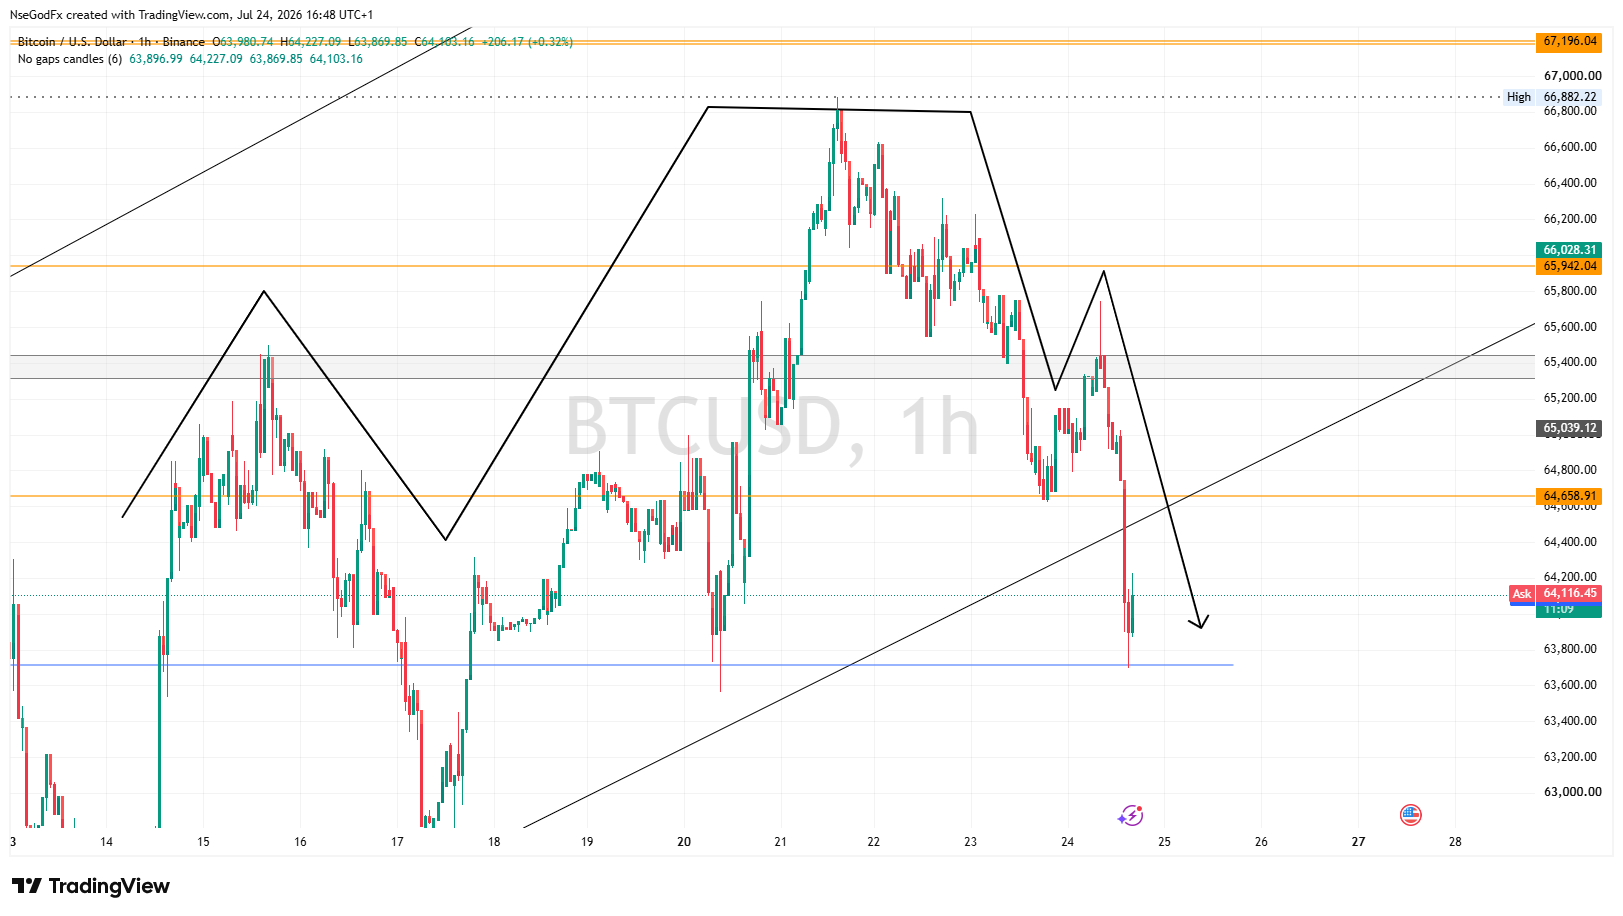
but On this BTC- What do you call equal highs like the one shown in the line chart below?
When they form at resistance zones what is expected of them?
What most people don't understand is that patterns have variations, but most of our basics we were taught just one style, and one variation.

Double tops or bottoms are not just for reversals, then can signify continuations. They can form as close range, they can form apart, but within same time range.

I believe If I had said equal highs, instead of double tops, you would have agreed more. But then will you say there's a difference between double tops and Equal highs?

N
@nsg_usd - 1 month ago
Quoted - israeljasspu

Btc to 60k esap

yeah. First bus stop at 62000. The sells will be stronger if it invalidates the internal level (blue) at 63700.

G
@godspowerdan - 1 month ago
Quoted - asuquokelvin

I have marked the entire swing level, I would sell if I have opportunities because that is still the premium level of the sell swing, but haven't seen a good opportunity

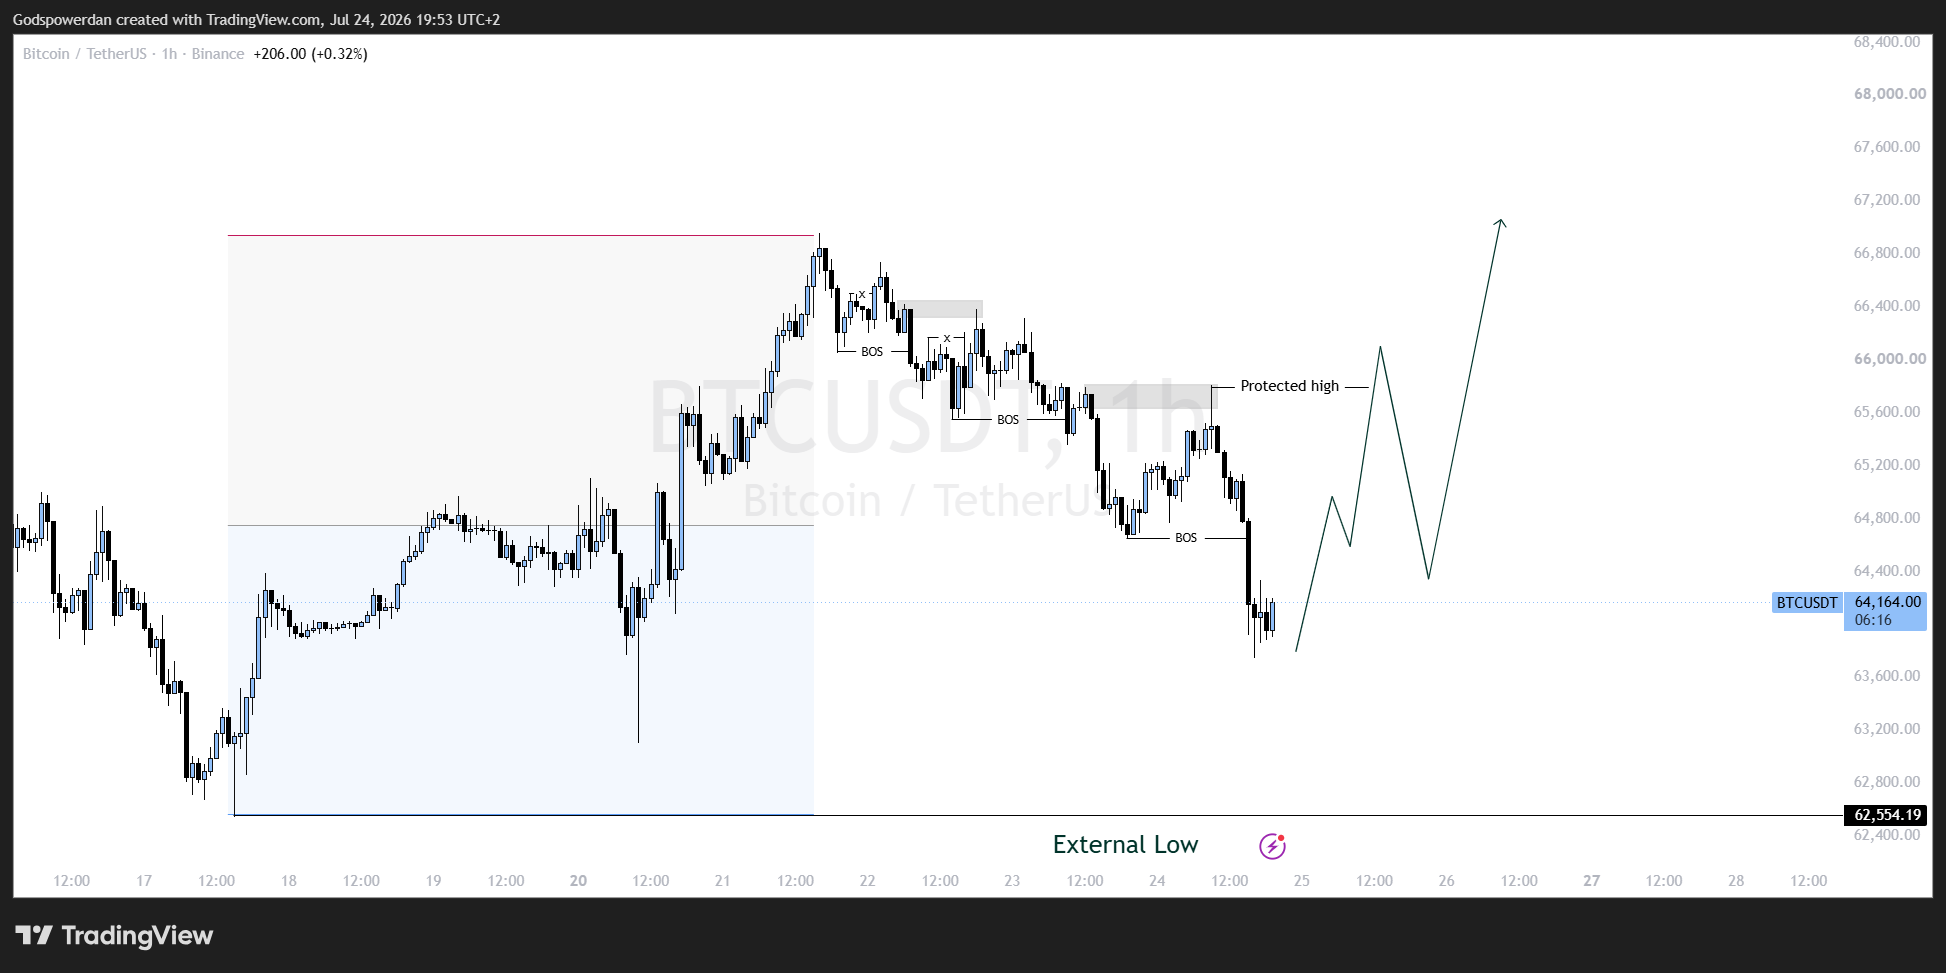
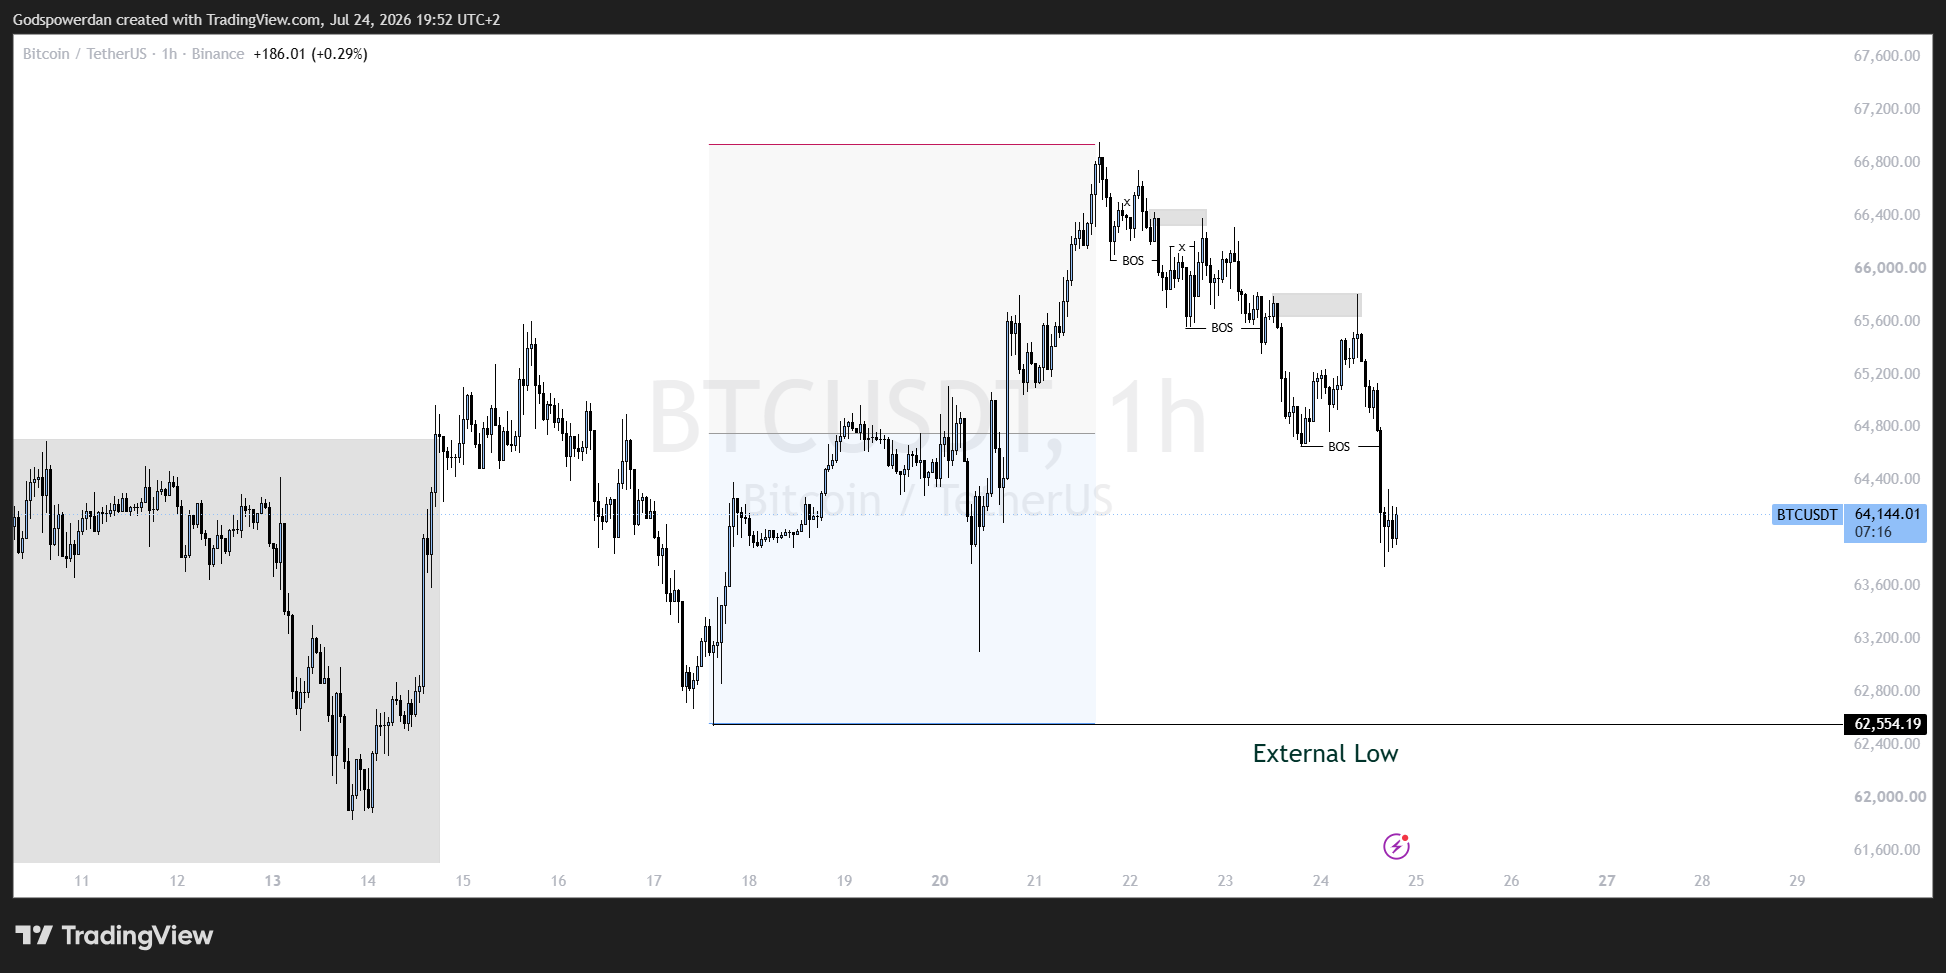
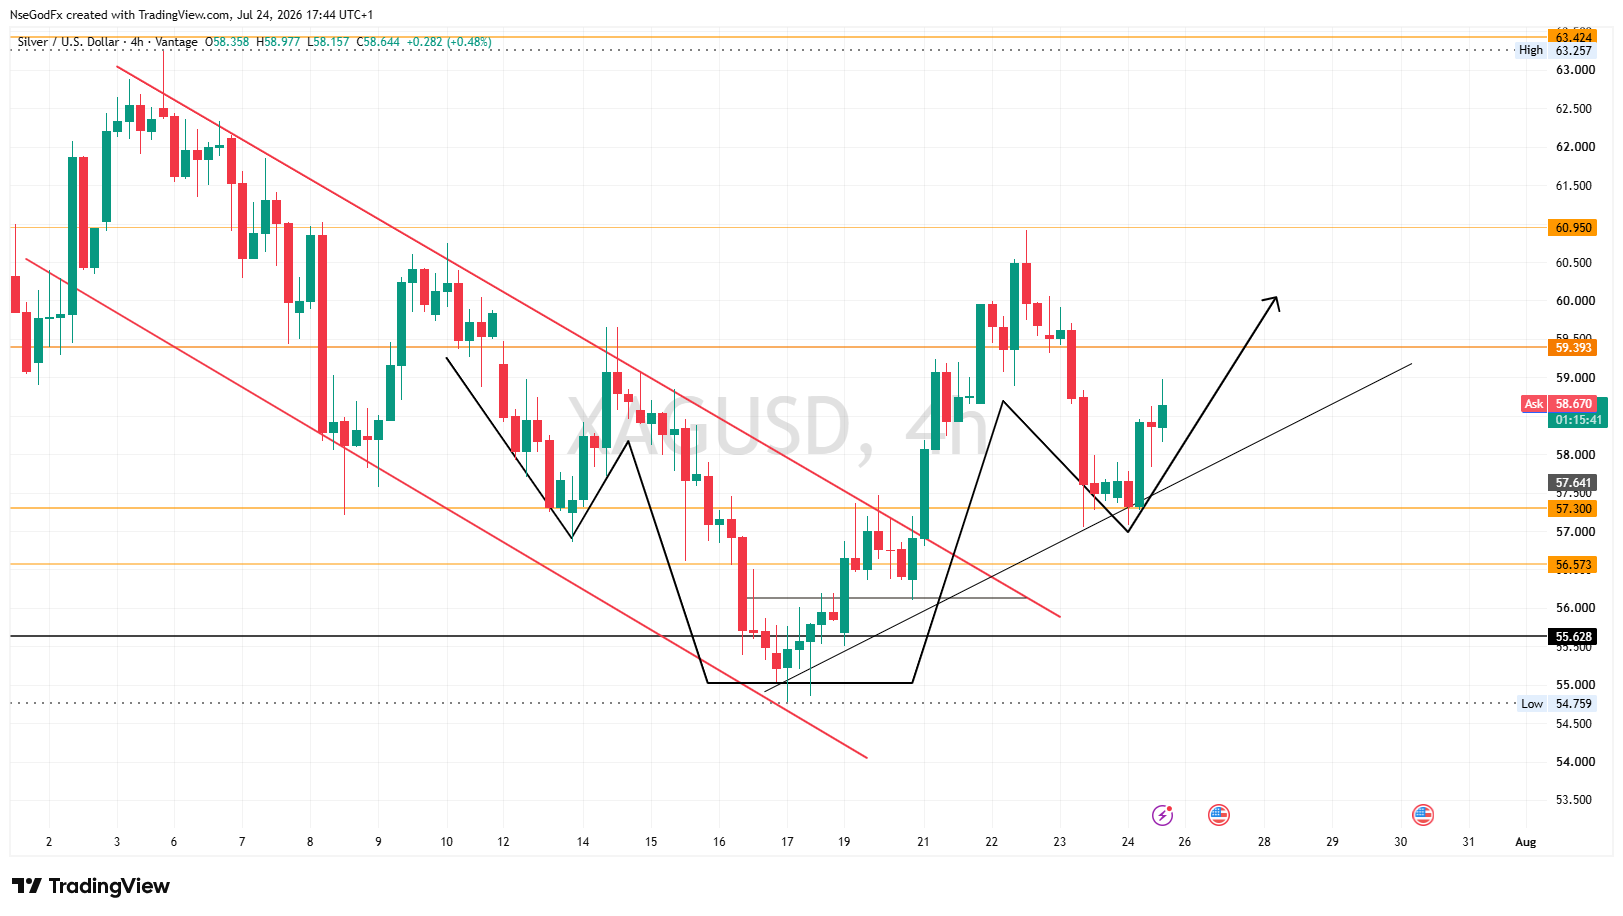
Price has traded into discount of that buying range, but with way price is protecting the highs on the retracement leg, it seems as though price will take out the external of that bullish range.

I will only look for buys when price takes out a protected high still inside that same range

G
@godspowerdan - 1 month ago
Quoted - asuquokelvin

I changed my bias to sells no more buying

You know the trend is still bullish right

Those sells are just retracement inside the bullish range irrespective of the protected highs

N
@nsg_usd - 1 month ago
Quoted - godspowerdan

It depends on the context though

Because i know that for a double top or bottom to be valid, it must have broken lower or higher, but equals highs or lows don't need to break structure to confirm it's equal highs or lows

Yeah, It's the context.

The thing is, I trade patterns differently; and mostly I trade them before they complete their formations. So, to now say they are valid I'll have to rather wait for it to break a neckline or follow textbook method before I can call it a top or bottom or HnS. I just outrightly call it as I've seen it.
But If I'm to be using the proper word, I'll call them potentials. Because patterns are meant to be traded after it is fully formed, but that is not the case for me.

Also, there are so many variations of chart patterns, but it's the most popular one as read on textbooks or seen in tutorial videos that people are acquainted with.

Disclaimer:

At MyTradingLand.com, we connect you with forex brokers and provide a community for traders. While we offer valuable information and resources, please note that we are not financial advisors and cannot provide personalized financial advice. Always conduct your own research and invest responsibly.

Community Guidelines: The MyTradingLand.com community is designed as a resource for forex traders, promoting respectful and constructive discussions. We reserve the right to remove any content that is misleading, abusive, or violates our terms of service.

Broker Information: While we may receive commissions or advertising income from some of the brokers listed, this does not imply an endorsement of any broker, nor does it affect our review process. Our evaluations are based solely on objective criteria and user feedback.

Always verify the regulatory status of any broker with your local financial authority, along with their terms and privacy policies, before engaging with them. It is crucial to conduct thorough research to ensure that you are making informed decisions.

Risk Warning: At MyTradingLand.com, we strive to provide accurate information; however, the forex market is highly volatile and can change rapidly. It is essential to verify any information before making investment decisions.

Please be aware that trading in forex involves substantial risk, and it is possible to lose more than your trading equity/investment capital. 70-90% of retail CFD traders incur losses in their trading activities as per information from various brokers.

You are solely responsible for your use of MyTradingLand.com and any trading decisions you make. We encourage all users to educate themselves thoroughly about forex trading and to consider seeking advice from qualified financial professionals.

Advertising Disclosure: We may earn commissions from recommended brokers, but our reviews are independent (not influenced by potential earnings). Sponsored content is clearly marked and doesn't reflect our views.

©2026 ©2025 All rights reserved Mytradingland.com