Casual FX discussion.
Backtesting means taking a trading strategy and testing it on past market data to see how it would have performed.
You’re basically asking:
“If I traded this strategy in the past, would it have made money or lost money?”
Backtesting helps you know whether your strategy actually works before risking real money.
How to Backtest
1.Pick your strategy – e.g., buy when price breaks above resistance.
2.Go back in time on a chart – scroll to old data.
3.Move forward one candle at a time – pretend you are trading live.
4.Mark your entry, stop-loss, and take-profit.
5.Record the result – win or loss, how many pips.
6.Repeat for many trades – at least 50–100 trades.
I thought backtesting was an automated process instead of a manual one?
Back testing isn’t all automated. You still have what to do. Playing the price is automated. You set the other parameters yourself.
But most times you cant view charts for more than a certain period on MetaTrader and TradingView. So what di you do in such a case? Like if you want to backtest data for the year 2005 how do you get the charts?
For trading view, you have to subscribe for the premium version. It gives you access to a larger data for backtesting.
But most times you cant view charts for more than a certain period on MetaTrader and TradingView. So what di you do in such a case? Like if you want to backtest data for the year 2005 how do you get the charts?
About Metatrader, I really don’t know if they have a premium package. I believe the data they provide is enough to backtest. If the data isn’t enough, backtest so many pairs .
Been hearing of backtesting but I have no idea how its done.
It's easy i was about to do a write up.It takes time to organize your thoughts.
MANUAL BACKTESTING OR FORWARD TESTING:
It is exactly as it sounds you are going to have to do the hardwork of staring at the charts and doing the evaluation.
1. Find a strategy or just create a random one.
2. create a selection criteria, or a grading criteria( if so and so happens). I will place a trade.
3. create the entry and exit criteria.
4. Calculate the return on the risk taken. over a period of the test period.
5. Tweak the strategy to maximize the reward and minimize the risk. Or create alternate entry and exit methods if you feel the criteria can be refined.
Example:
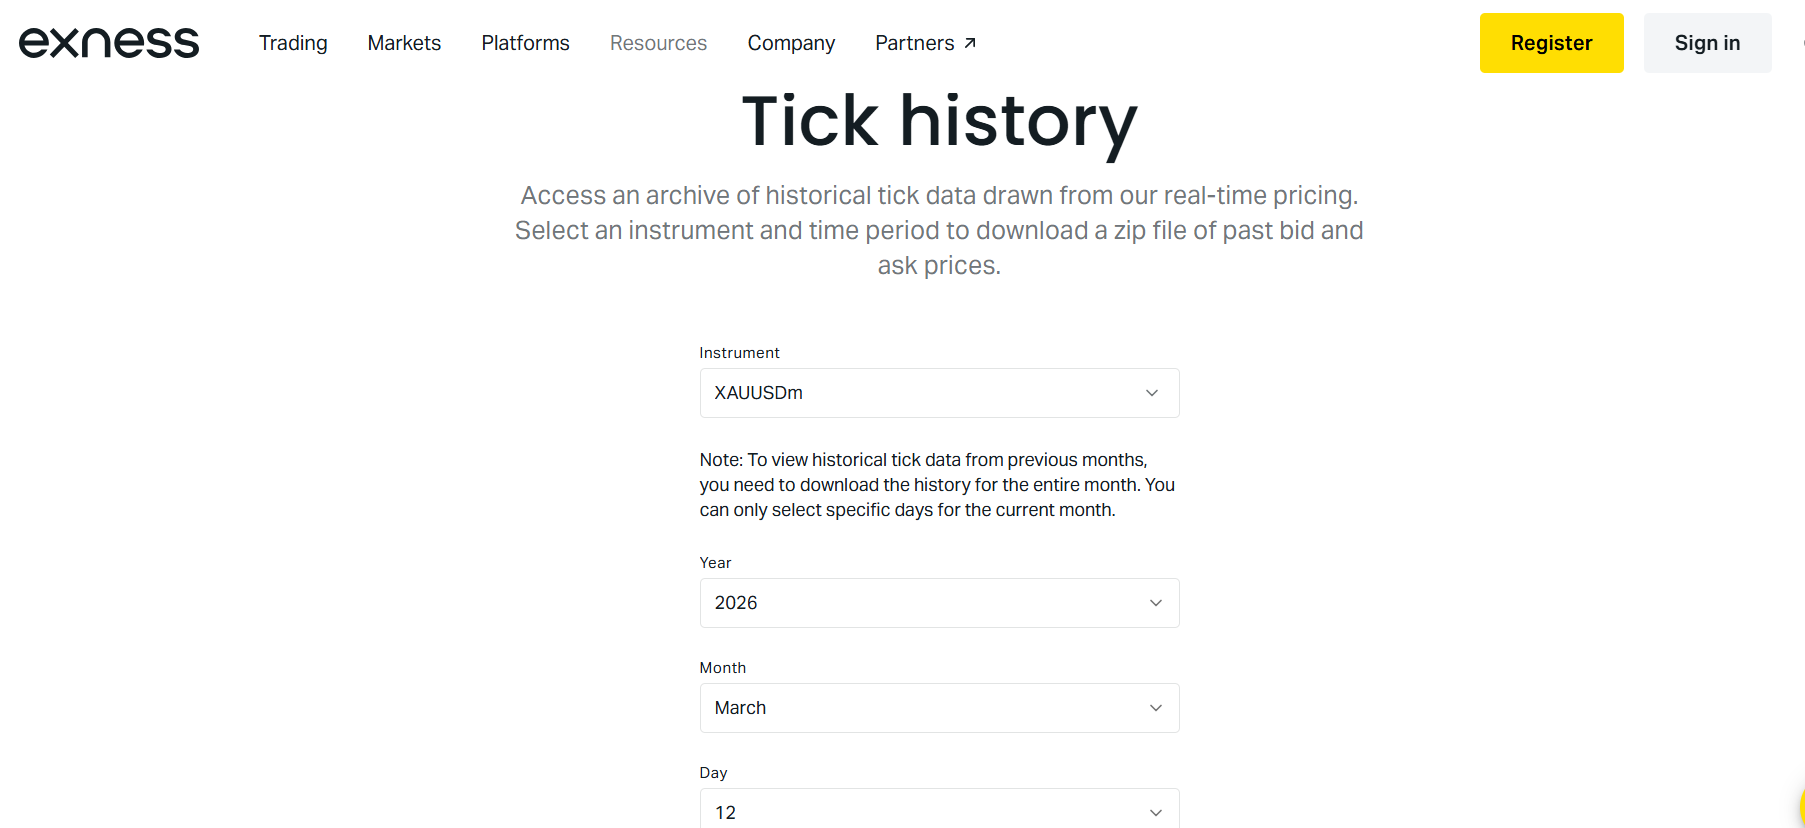
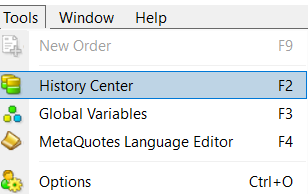
Say i wanna manually back test the hit rate of bullish engulfing pattern or pin bar pattern. These are the most common patterns in price action. I will pull up an old chart in a free demo mt4 account or if you have a paid trading view subscription and scroll back the chart and find my patterns and apply the above.
The strategy:
Find the bullish engulfing/bearish engulfing patterns on the weekly chart and see how they did.
Selection:
I will only trade the bullish or bearish or pin bar patterns of the major weekly S/R.
Entry and Exit:
I will enter when the price breaks below the pattern when it is a bearish engulfing and when it break above when its the a bullish engulfing. Or trade the break of the pin bar.
I will exit at the next weekly support and resistance area when the trade works or when my stop loss behind my trigger bar is hit.
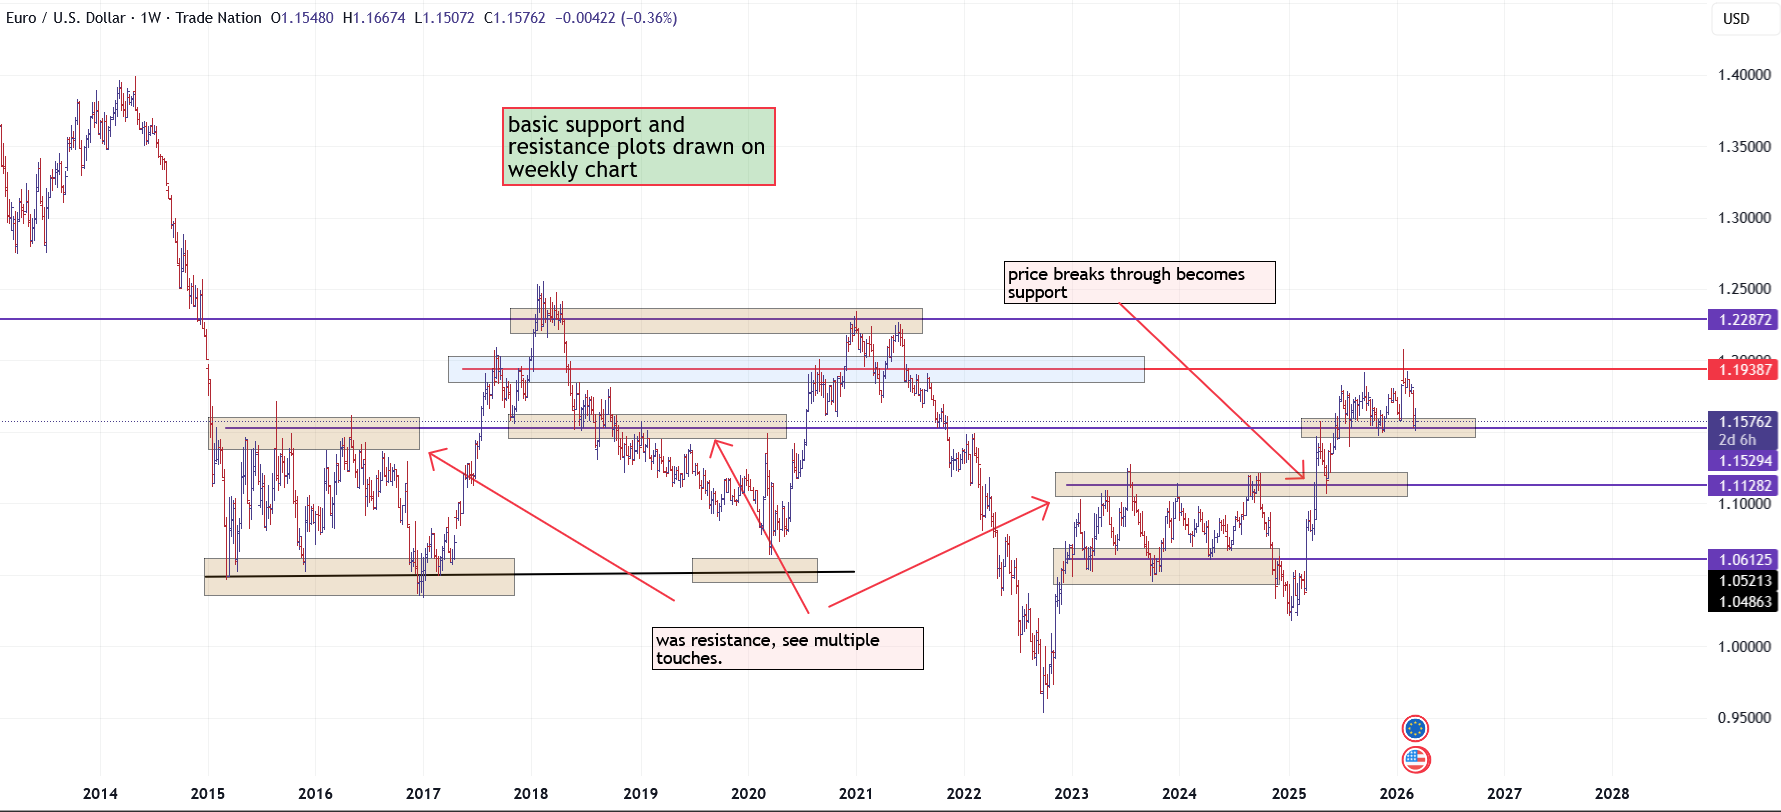
See attached weekly chart to see the support resistance areas marked.
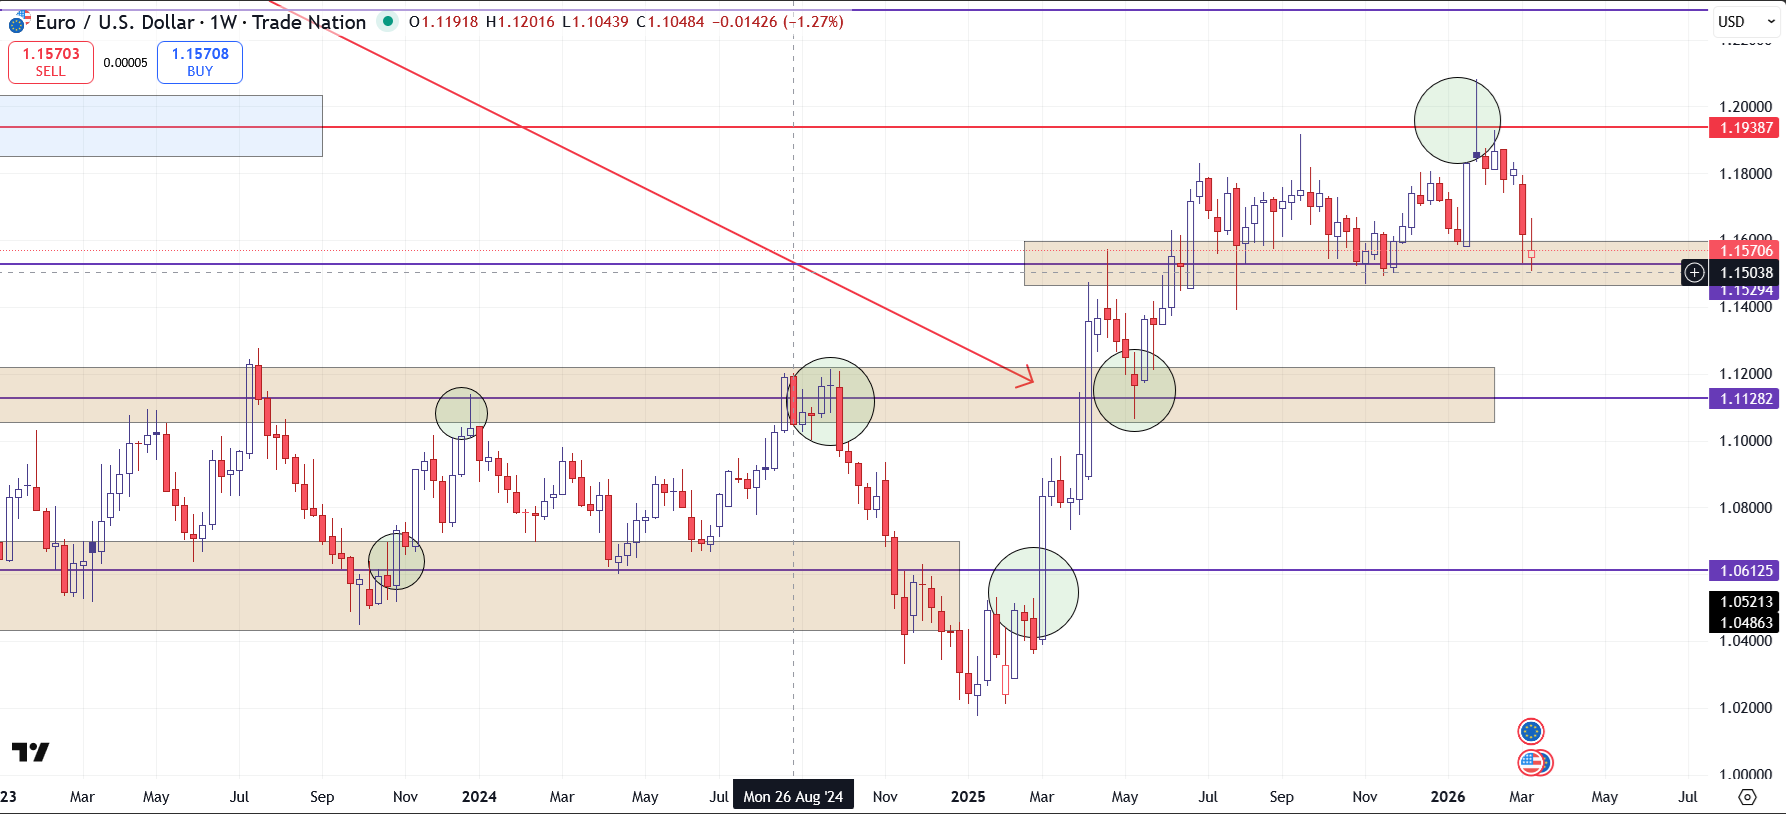
See attached weekly chart showing the setups that qualified as exact text book patterns.
Trade1:
195:382
Trade2:
108:404
Trade3:
217:370
Trade4:
469:248
Trade5:
198:273
Trade6:
198:336
Observations:
It will be noticeable from this very small sample size back test that the R:R is not that great but back test shows the most ideal setups had a higher win rate of 100%. In real world the traders patience is going to decide if they end up with a higher win rate or a much lower one.
It takes immense patience to wait for the ideal setup and in 2.5 years there were only 6 trades that were based on this very strict criteria.An impatient trader might take setups that dont fit the criteria and that could lead to poor results.
Dangers of back test:
You will have a tendency to cherry pick the setup, because you are looking at a chart that has already formed and you can already see the results.
Tweaking:
You could be a little bit lenient with entry criteria of candle stick and get more setups.You could zoom down to the daily chart and get more entries or reduce the risk by entering in the smaller timeframe. I wont get into the intricacies of that but essentially tweaking is changing the criterias for entry and exit or parameters to achieve better results.
Forward Testing:
Just wait for the setup to form again in the future and trade it.
Real world limitations:
In trading world an average FX trader will enter and destroy their career in less then 5 years, how could they ever find out if they were successful with the above strategy. Answer is they wont be able to because the number of setup that have formed are way too low. But that doesn't mean the setup did not work.
Another limitation is the account size, to make a meaningful return you would have to place a sizable position to make any meaningful sum. A mini lot returned 2013 USD and standard lot returned 20130 USD and 10 standard returned 201300 USD in 2.5 years. Would a small trader have that level of patience to trade this strategy and even the capital to trade this strategy to make a meaningful return in their lives.
I know 3 traders that taught this weekly trading method and had a great career and a good job and a good retirement sum they are just trading weekly charts to manage their money. So this work for them. But will it work for you. I don't know. They are managing their own money they are happy with the return and it work for them.
Another thought is that most traders do system hopping and wont follow a system over a large sequence or a longer period of time and will never have the results obtained from the back test. So the traders psyche decides their trading system and trading style. So a busy trader that has a full time job will find they are happy trading the weekly chart but a new young trader will feel that the opportunity set is limited.
Another thought is capitalization, you must read my previous framework post to know that the trader must have goals so they can achieve them. Clearly this above strategy can't benefit a trader that want to retire early in the UK if the account size they started with is 10000 USD and they were trading a mini lot.
This post sheds light on back testing and its intricacies. This strategy is a random price action pattern traded on a very large time frame and it doesn't represent all the strategies out there that you could trade. But i hope the basic clarity on manual back testing has been clarified.
But most times you cant view charts for more than a certain period on MetaTrader and TradingView. So what di you do in such a case? Like if you want to backtest data for the year 2005 how do you get the charts?
You can buy ohlc data for instrument of your choice from data vendors. Tradingview has a few brokers that have data that go way back.
Additionally Mt4 has history center where you can import data from your broker or from metaquotes.
Next post:
An intraday setup with automated testing using python.
We will use ohlc data and create a python script that uses matplotlib to create plots and graphs to visualize the trading results.
We will export 1000's of images of chart patterns that meet that setup into a pdf so you can see what was the program seeing when it decided to take that trade. If the images show setups that were subpar we will write a new test to exclude the setups that were subpar.
Finally when we have good result from the test we will go to the real market and trade that criteria exactly as the test had.
Stay Tuned..
It may sound complicated but with ai tools an llm like chatgpt or perplexity can write your code. You just have describe your trading strategy.
Thanks for sharing, the ai option sounds better to me
You can buy ohlc data for instrument of your choice from data vendors. Tradingview has a few brokers that have data that go way back.
Additionally Mt4 has history center where you can import data from your broker or from metaquotes.
Exness has tick history which can be downloaded, pls is this the kind of data needed for backtesting ?
You need bulk data of past 4-5 years (in most cases you don't need tick data, you just need OHLC data for your preferred timeframe).
From your screenshot, it seems like you can only download the history for a day. It will take forever this way.
a. A much better way is to download the history from your MT4/MT5. Go to Tools > History Center (F2) in your MT4. See screenshot.
From there you can download all the data that your broker has in it's feed for that time period.
Also, note that you will need to open the instrument in your MT4 (like eurusd chart), and drag back on the timeframe for which you want to download the data. This way, MT4 will fetch more data from the broker's servers, than just the default.
b. Or if you have a Tradingview subscription, you can "download chart data", on the instrument that is open in your window. Some brokers like FXCM has data going back to 2000s, so you can go back & download it.
Tradingview limits the max. candles you can look back to, depending on your subscription level, but there are workarounds.