EUR/USD Beginner Level trading

Y
@yokoyi - 1 year ago
Quoted - yokoyi

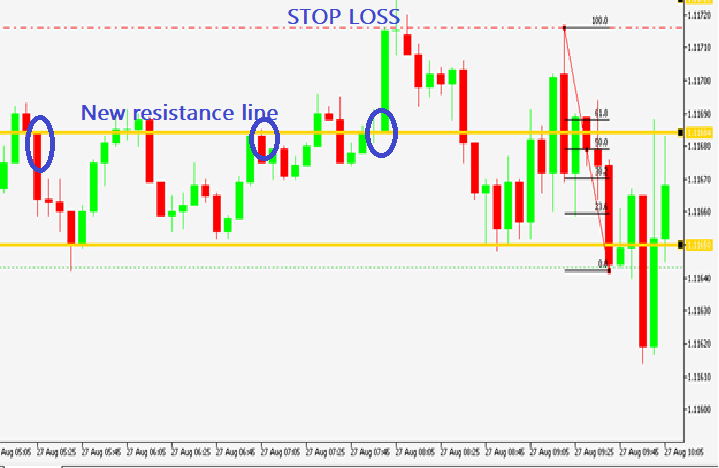
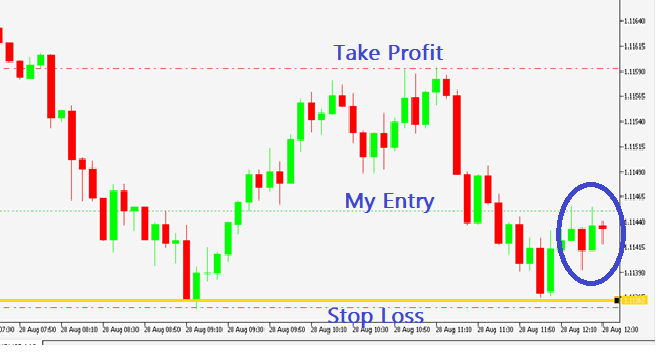
Price has gone down but has started going up again. I expect price will not be able to break the yellow support line and bounce back to downward movement

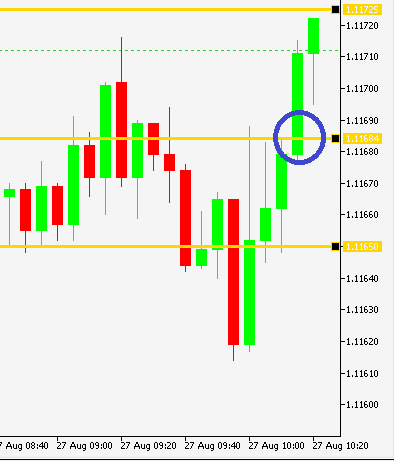
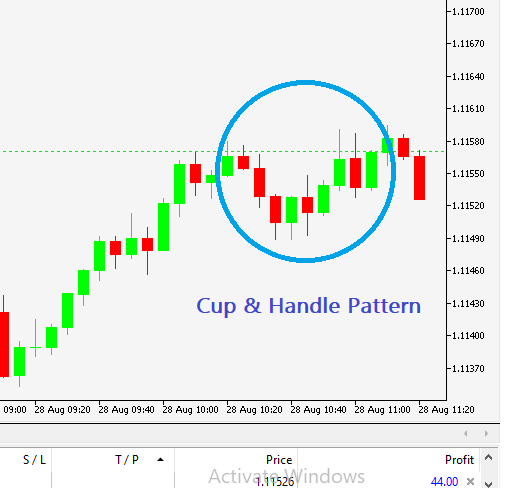
Price keeps going up and i spot a new resistance level based on the candles marked with a blue circle so i mark it with a yellow line.

If price breaks through this new level it cold be game over because my Stop Loss is set above this new line

Y
@yokoyi - 1 year ago
Quoted - yokoyi

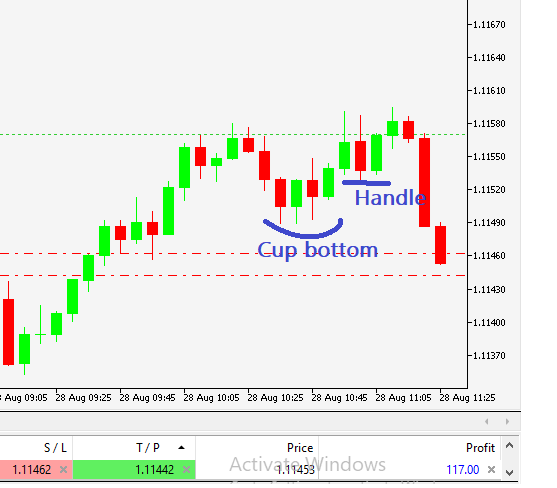
My Stop Loss has been hit but as i said price was able to break the resistance line so an uptrend is ongoing so its a goof time to buy

Good Morning 28/8/2024

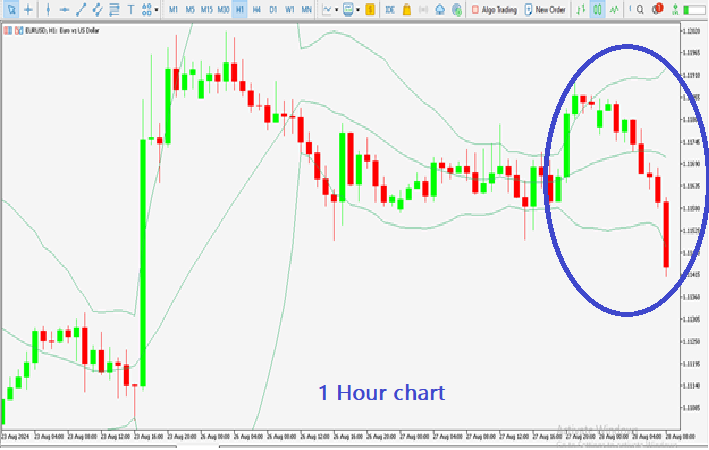
Today I take a bird's-eye view of the 1 Hour chart using Bollinger Bands Indicator to look for volatility

As we can see the Bollinger Bands are wide apart indicating high volatility so i hope to catch and ride a trend

We can also see the market is an overall downtrend today since the Asian session

Next, I will switch to thw 5 Minute chart to find an entry point

Y
@yokoyi - 1 year ago
Quoted - yokoyi

Good Morning 28/8/2024

Today I take a bird's-eye view of the 1 Hour chart using Bollinger Bands Indicator to look for volatility

As we can see the Bollinger Bands are wide apart indicating high volatility so i hope to catch and ride a trend

We can also see the market is an overall downtrend today since the Asian session

Next, I will switch to thw 5 Minute chart to find an entry point

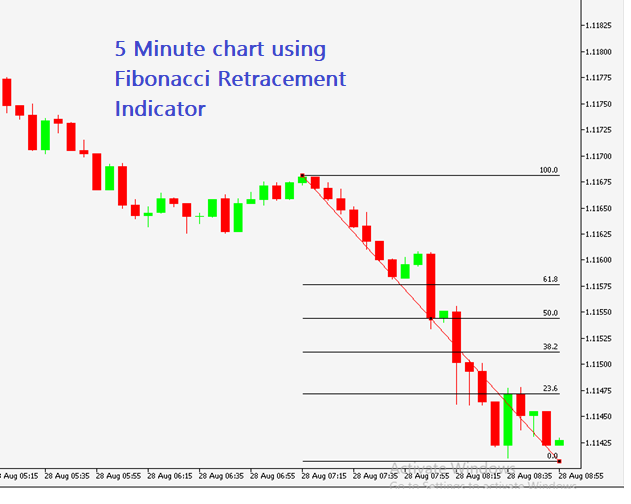
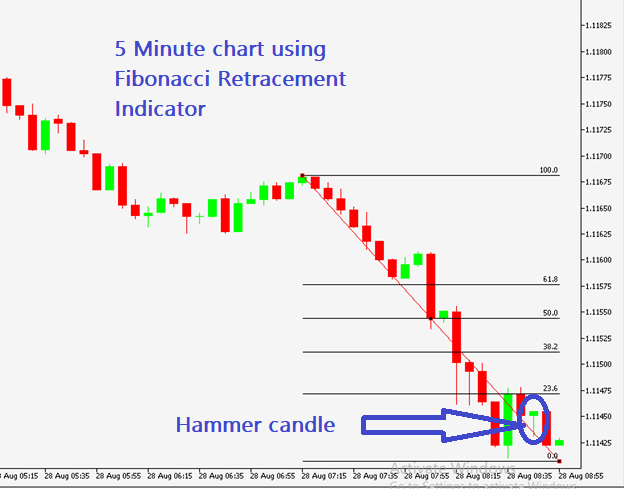
I switch to the 5 Minute chart and still see a downtrend

So i invoke the Fibonacci Retracement Tool so that i know if any upward retracement is real or fake

basically if any upward movement occurs around the 38 or 61 Fib Levels it means its fake and its just short sellers taking their profits and the down trend will continue after that

Y
@yokoyi - 1 year ago
Quoted - yokoyi

Hammer candlestick spotted

I spot a hammer candlestick in a downward trend which is a strong signal that some uoward movement is coming

so i place a buy order

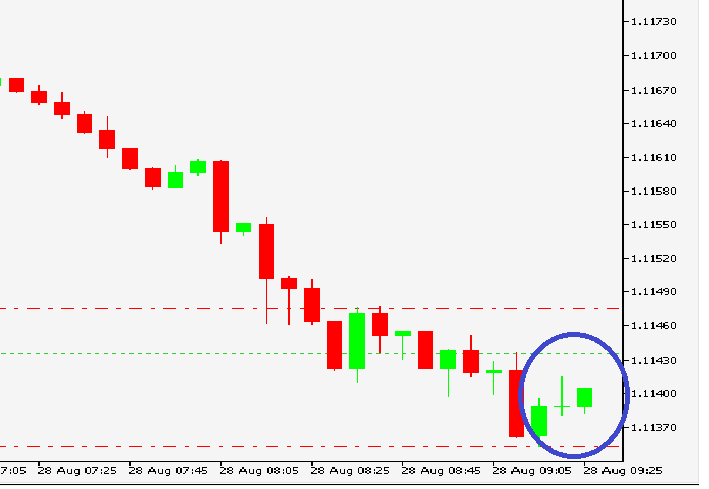
I set my Stop Loss at 1.11352 and price is nearing my Stop Loss.

I had expected the downward trend to reverse because i saw a bullish Hammer candlestick pattern.

Y
@yokoyi - 1 year ago
Quoted - yokoyi

I set my Stop Loss at 1.11352 and price is nearing my Stop Loss.

I had expected the downward trend to reverse because i saw a bullish Hammer candlestick pattern.

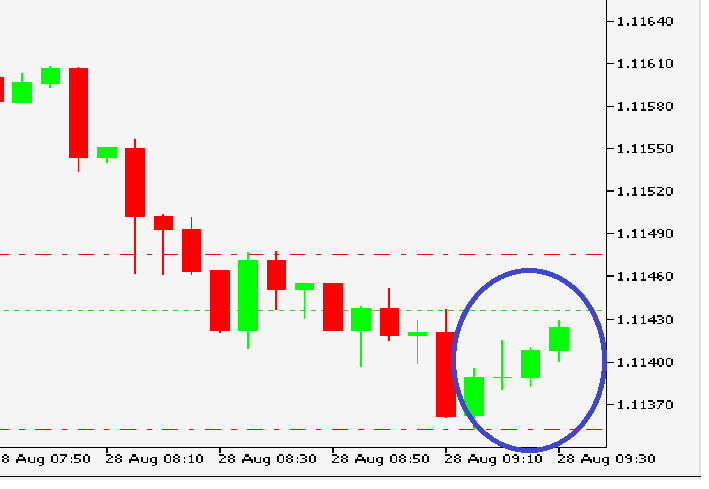
I am seeing some upward movement

I am looking for this trade to become profitable by any amount then i close it.

basically the overall market trend is downward so my next trade will be a short trade

Y
@yokoyi - 1 year ago
Quoted - yokoyi

I am seeing some upward movement

I am looking for this trade to become profitable by any amount then i close it.

basically the overall market trend is downward so my next trade will be a short trade

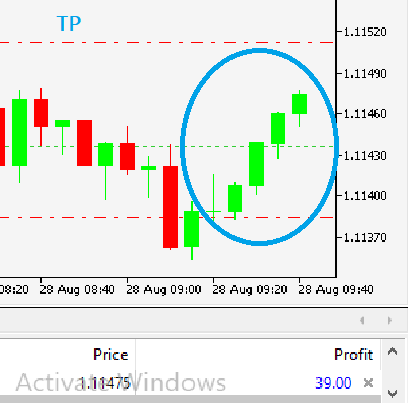
Wohoo!! looking good!

I was so scared for this trade and but the hammer candle stick i spotted earlier made me know upward movement was on the way especially because the hammer was green color and appeared in a down trend

For this trade i just wanna break even and make a little profit then close it.

It has been too risky trading against a major down trend

Y
@yokoyi - 1 year ago
Quoted - yokoyi

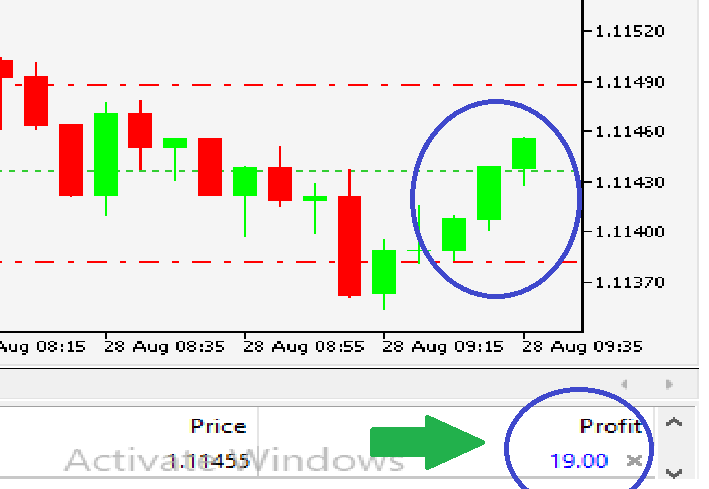
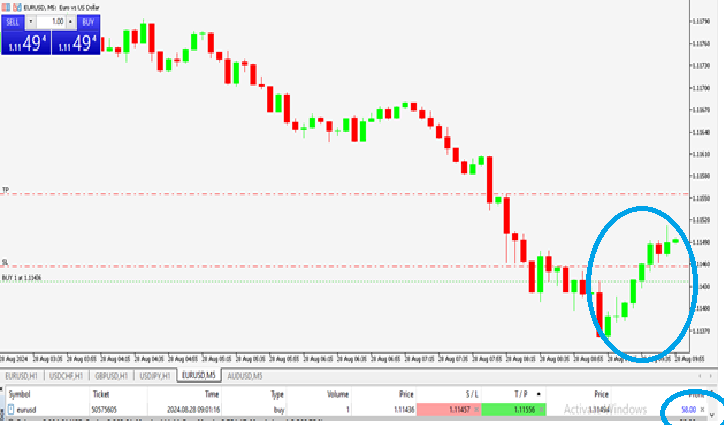
More upward movement

Bird's-eye view showing more upward movement

Y
@yokoyi - 1 year ago
Quoted - yokoyi

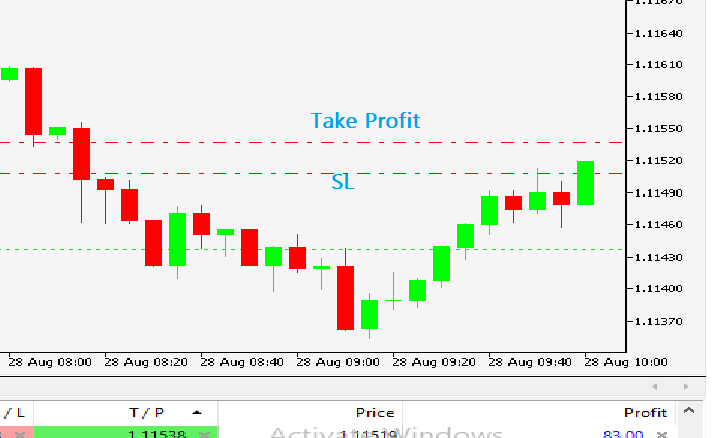
Price is nearing my Take Profit

Success

My Take Profit has been hit $72

Y
@yokoyi - 1 year ago
Quoted - yokoyi

Success

My Take Profit has been hit $72

Learning Point

In this trade my ability to identify the Hammer Candlestick pattern in a downward trend enabled me predict an upward trend was coming

P
@patrader - 1 year ago
Quoted - yokoyi

Learning Point

In this trade my ability to identify the Hammer Candlestick pattern in a downward trend enabled me predict an upward trend was coming

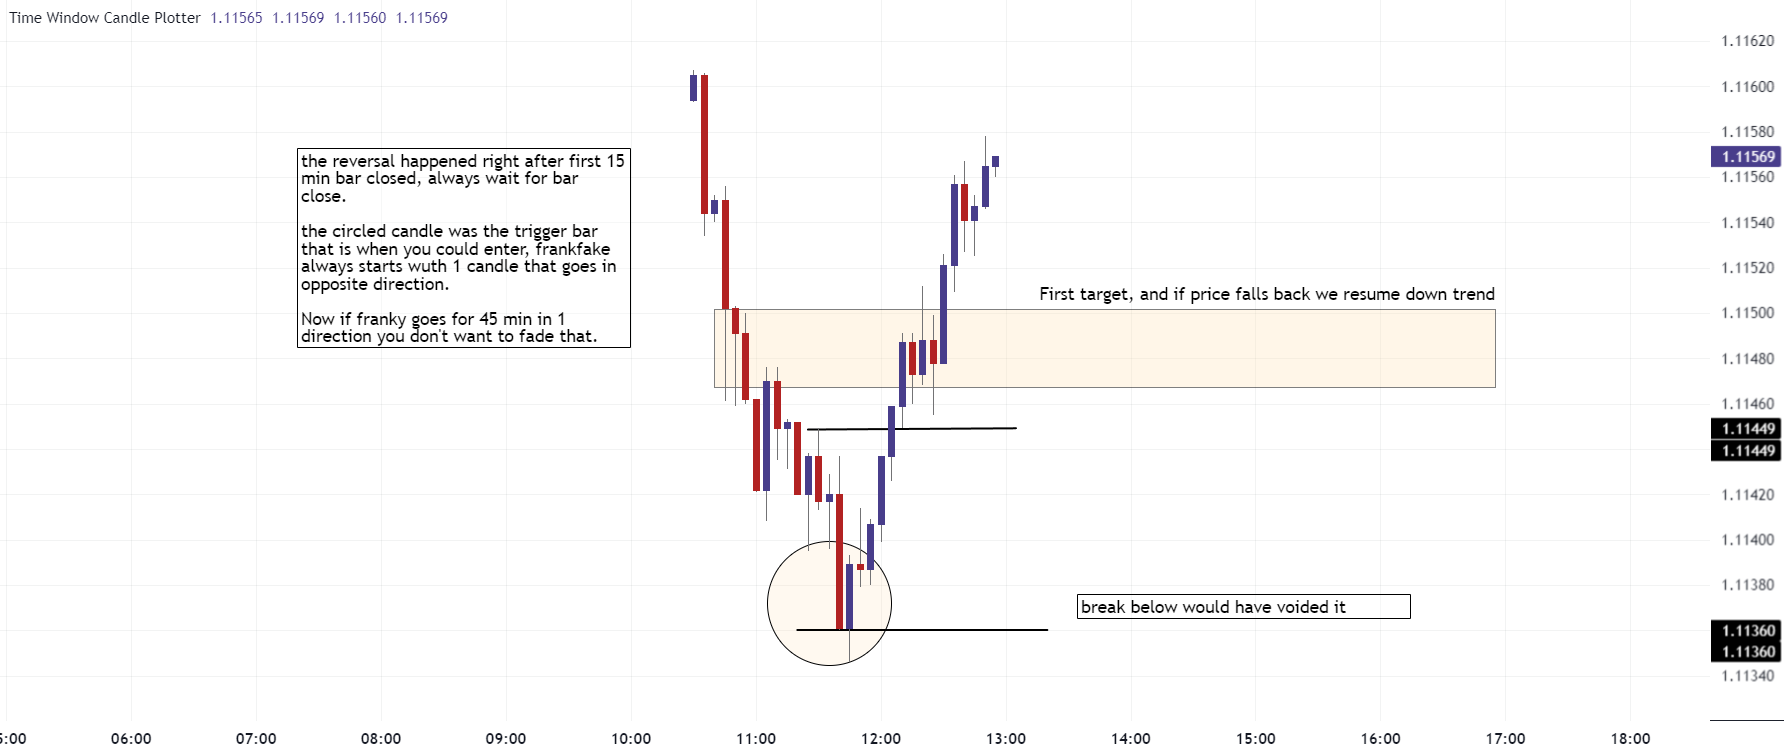
The time element is the key factor here.


8 AM Frankfurt time is the fakeout period meaning it has a high chance it will go in opposite direction to the move that happened 4-6 hours before it. Then comes london bar at 9AM frankfurt time or 8 AM london time that hour is the decider if the fakeout will last or continue.


Market doesn't care about hammers or bullish engulfing patterns, these candlestick patterns are just signs if there is buying/selling pressure or not.

You need to understand for every hammer that works there are many that don't. You should not treat any technical indicator or candlestick pattern as a holy grail. Trading is about being flexible and accepting the loss when things don't work out. I know this is easier said then done but if you cut the loss short you will stay in the game long enough to see a winner.

Y
@yokoyi - 1 year ago
Quoted - yokoyi

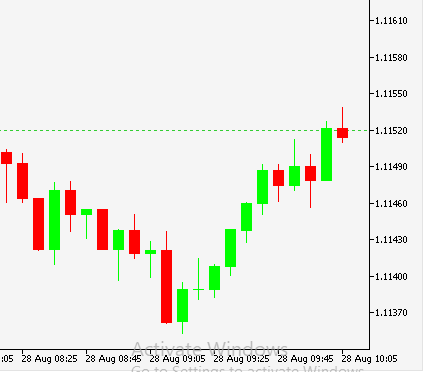
SUCCESS
My Take Profit has been hit around $100

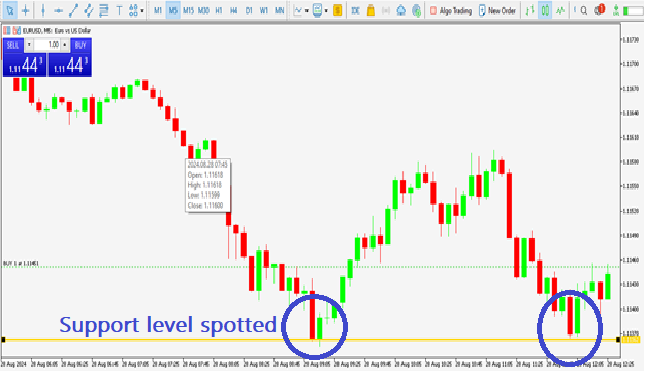
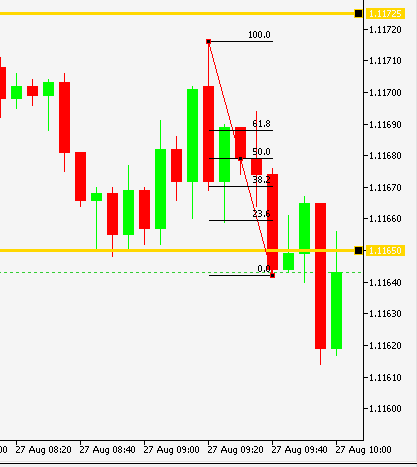
I just spotted a potential area of value

I spotted a support level where downward price movement bounced off twice

I have marked this level with a yellow line and opened a buy trade because i expect price to go upward after bouncing off this line

Disclaimer:

At MyTradingLand.com, we connect you with forex brokers and provide a community for traders. While we offer valuable information and resources, please note that we are not financial advisors and cannot provide personalized financial advice. Always conduct your own research and invest responsibly.

Community Guidelines: The MyTradingLand.com community is designed as a resource for forex traders, promoting respectful and constructive discussions. We reserve the right to remove any content that is misleading, abusive, or violates our terms of service.

Broker Information: While we may receive commissions or advertising income from some of the brokers listed, this does not imply an endorsement of any broker, nor does it affect our review process. Our evaluations are based solely on objective criteria and user feedback.

Always verify the regulatory status of any broker with your local financial authority, along with their terms and privacy policies, before engaging with them. It is crucial to conduct thorough research to ensure that you are making informed decisions.

Risk Warning: At MyTradingLand.com, we strive to provide accurate information; however, the forex market is highly volatile and can change rapidly. It is essential to verify any information before making investment decisions.

Please be aware that trading in forex involves substantial risk, and it is possible to lose more than your trading equity/investment capital. 70-90% of retail CFD traders incur losses in their trading activities as per information from various brokers.

You are solely responsible for your use of MyTradingLand.com and any trading decisions you make. We encourage all users to educate themselves thoroughly about forex trading and to consider seeking advice from qualified financial professionals.

Advertising Disclosure: We may earn commissions from recommended brokers, but our reviews are independent (not influenced by potential earnings). Sponsored content is clearly marked and doesn't reflect our views.

©2026 ©2025 All rights reserved Mytradingland.com