Hello deelee,
This is in context to what you asked finding the direction and strength using indicators. But i would say you could easily find the direction with your own eyes but you could use indicators.
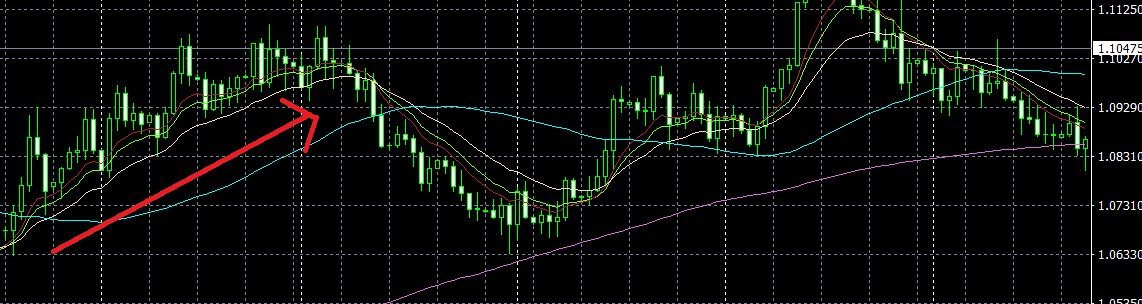
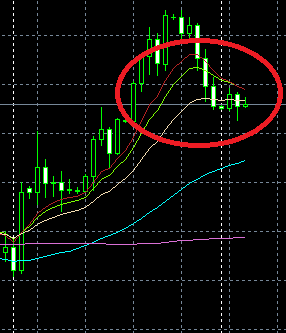
Trend direction using Moving Averages:
You can use the most basic indicators like moving averages or a moving average ribbon for checking the direction of the trend. If the ribbon is going up then the trend is up if the ribbon is going down then the trend is down.
So lets says we have a 5 minute timeframe and the following EMAs (exponential moving averages):
24*5 =2 hours, this ema will show you the trend on the 2 hour timeframe
48*5 = 4 hours
and so on...
24 EMA, 48 EMA, 144 EMA, 288 EMA will show you trends on the 2,4,12,24 hours. If the price is trading below 24 ema it means that price has been falling in the last 2 hours. If the price has consistently stayed below that moving average means that 2 hour trend has been down.
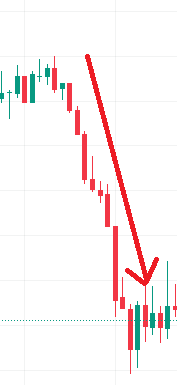
Trend Strength using MAs:
A strong trend would barely touch the larger moving averages, but if you have many crossovers or periods where moving average ribbon is flat then it means we are ranging. Also the spacing between the EMA would be large enough in strong trend and they wont be too close to each other.
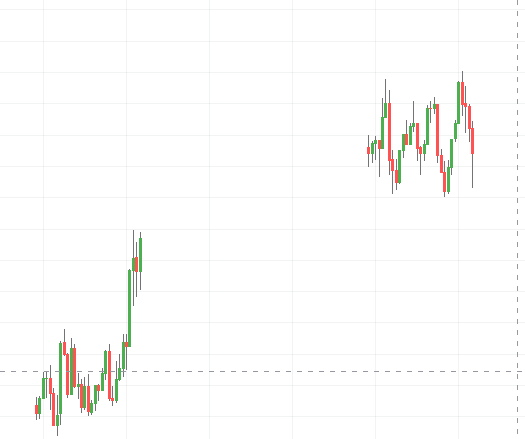
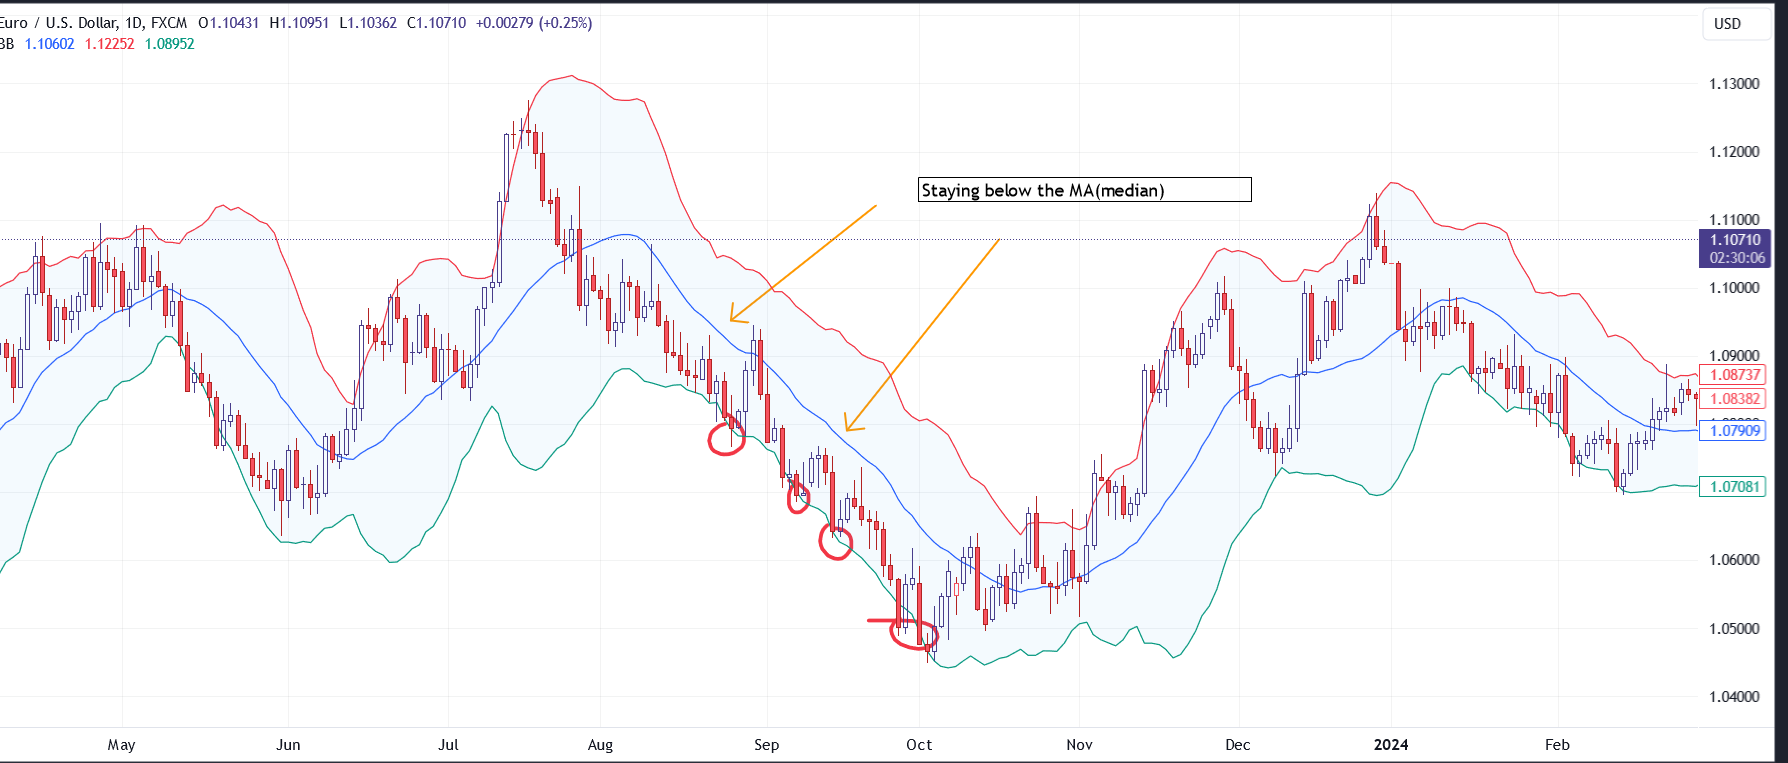
Trend strength using Bollingar Bands:
You could also use Bollingar bands to see the trend strength, a srong runaway trend would stay on the upper band of the Bollingar and frequently appear to pierce the standard deviation.
Other indicators are RSI,ADX etc etc.
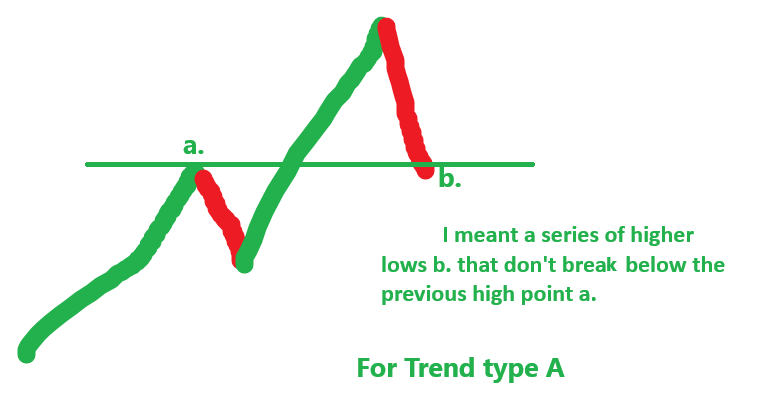
I will write more about naked charts reading strength using your eyes in the upcoming posts.