Initial Balance Strategy (tested on EUR/USD)

So, guys I came across the initial balance strategy developed by J. Peter Steidlemayer in the 1980s. He was a member of the Chicago Board of Trades and is a trading veteran.

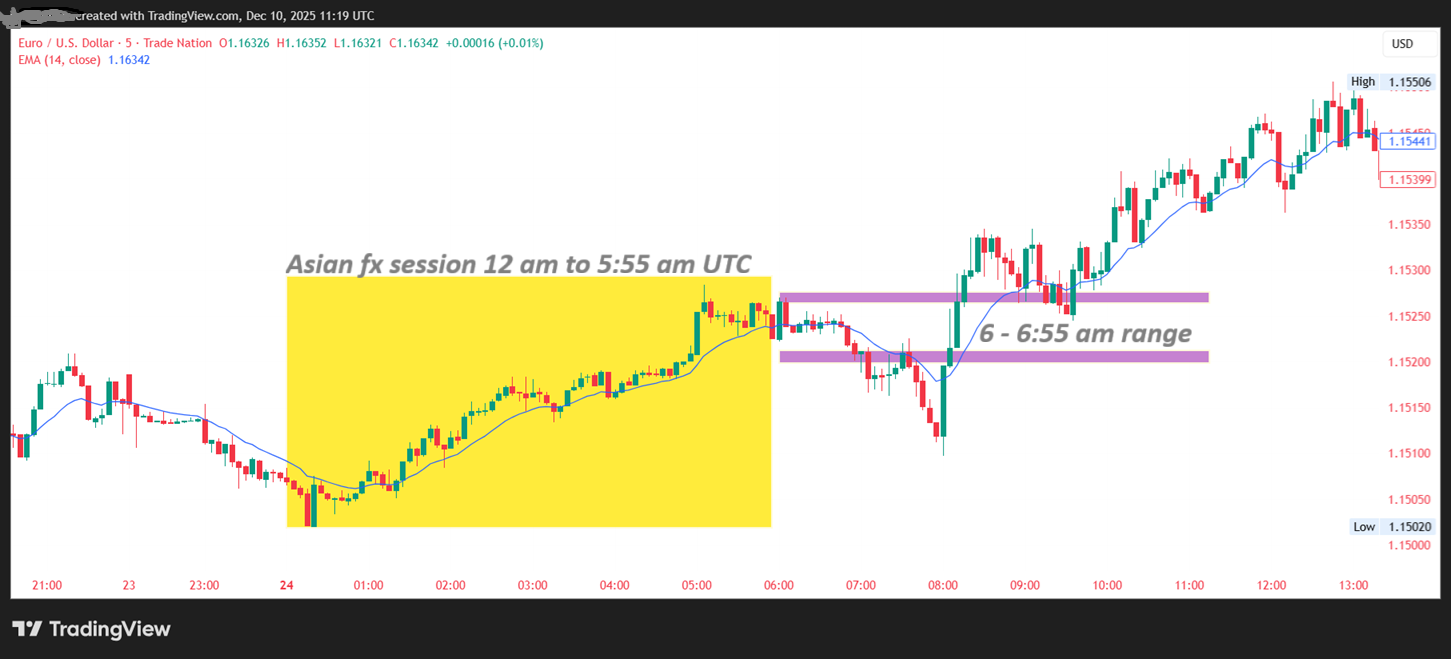
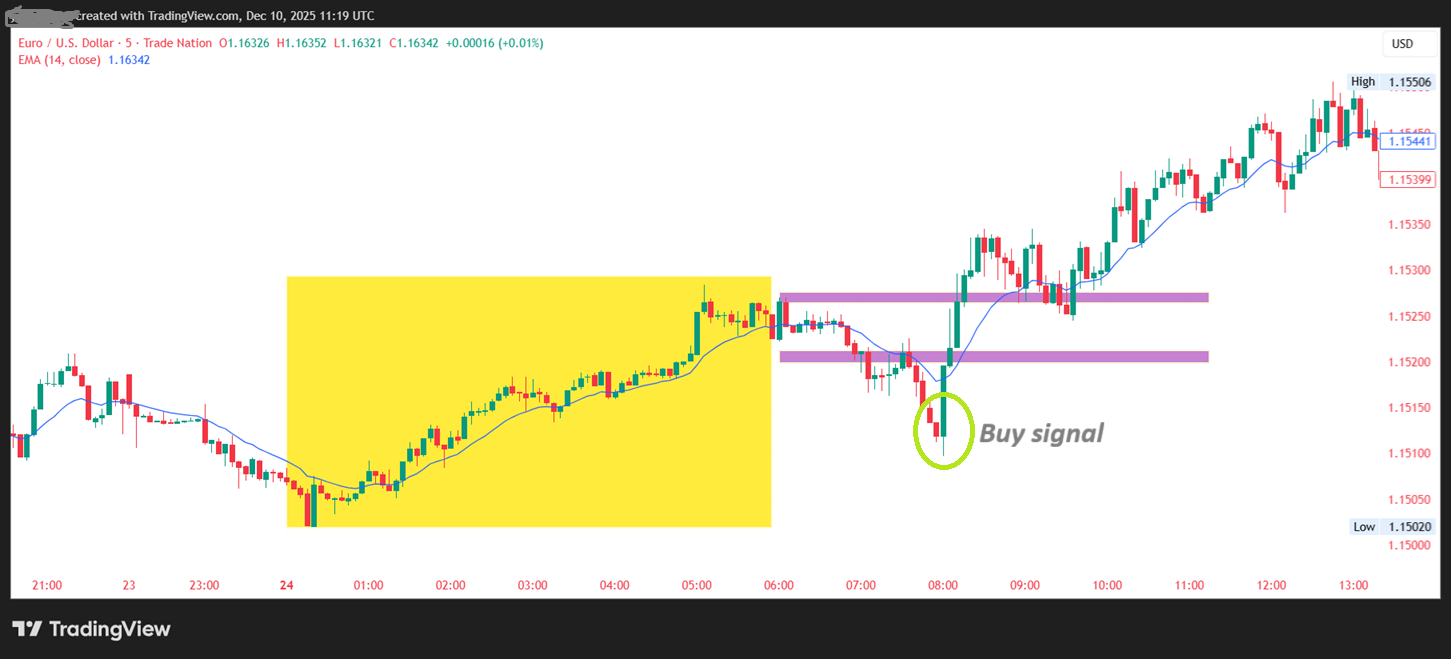
What the initial balance strategy basically says is that the initial opening hour of a trading session should be paid attention to as it can define what the rest of the session will look like.

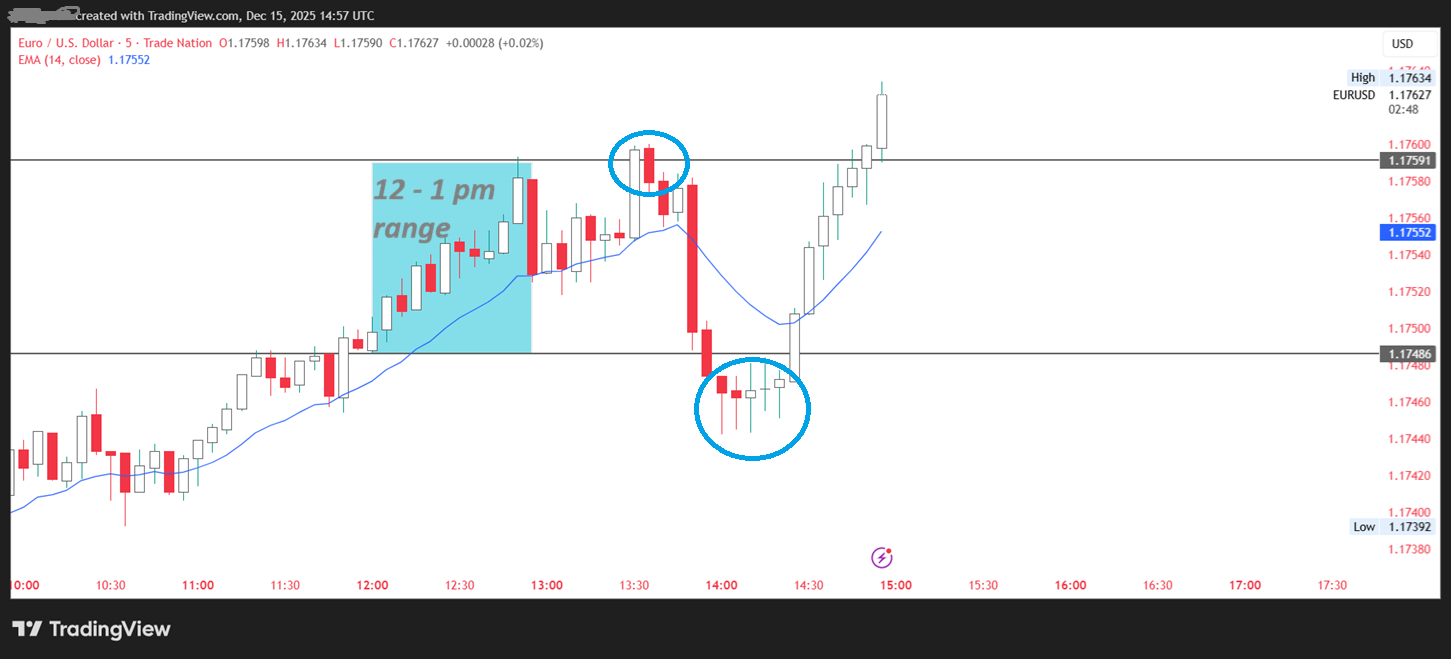
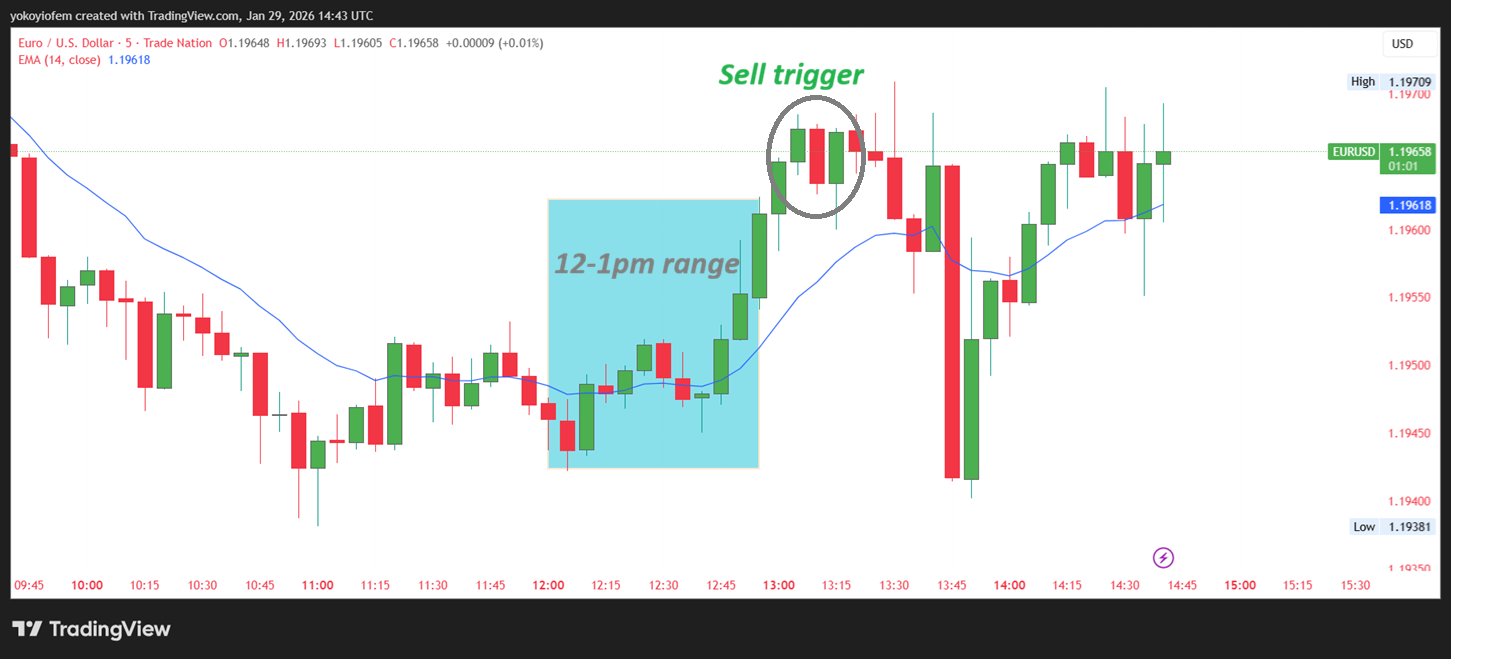
I researched into how to use initial balance strategy for EUR/USD trading and I made some adjustments that I will share with you. Instead of paying attention to the 8 am - 9 am first hour of the London session, I decided to pay attention to the 6 am - 7 am Frankfurt open that comes before the Londin session because I found it relates more to the EUR/USD pair.

Please feel free to add your thoughts on this because I am only going to be discussing what I have tried and found out about the initial balance strategy when testing on EUR/USD

M
@mercury01 - 6 days ago

The first step in using this initial balance strategy is to mark out (on your chart) the lowest and highest price reached between 6 am and 7 am UTC time.

M
@mercury01 - 5 days ago

The purple lines indicate the highest and lowest price reached between 6 am and 6:55 am UTC time. So, i simply use the purple lines to mark out the upper and lower range between 6 am and 6:55 am also known as the Pre-Frankfurt hour.

The yellow rectangle is what I used to mark out the Asian trading session from midnight to 5:55 am UTC time.

The Pre-frankfurt hour range (6 am - 6:55am) is our initial balance and is marked by the purple lines. Notice how price broke out of the Pre-franky low (lower purple line) and reversed upward commencing an upward trend.

M
@mercury01 - 5 days ago

After price closed outside/below the lower purple line and you spotted the bullish engulfing reversal pattern, it would have been a buy signal for you to go long.

M
@mercury01 - 3 hours ago

The initial balance strategy can also be used to determine the direction of the New York session.

I siimply draw a box to mark the range of the 12 pm to 1 pm hour then wait for price to breakout of the range. If the breakout results in a reversal, then i trade the direction of the reversal.

In the attached image they were two breakouts at the upper and lower edges of the blue box and a reversal followed suit.