UNIJOS MTL COMMUNITY

1 2 ... 12 13 14 15 16 17 18 19 20 21 Next »
Y
@youngancient - 14 hours ago
Quoted - wavey_

Is it something you will do if you have the money?

Yes...I will love to go into copy trading although looking for a profitable trade is a great deal..

W
@wavey_ - 11 hours ago

Based on your own understanding and research… what do you think about this setup?

P
@pisces03 - 11 hours ago
Quoted - wavey_

Based on your own understanding and research… what do you think about this setup?

I can't really comprehend anything from my own understanding but then.....based on my own research....

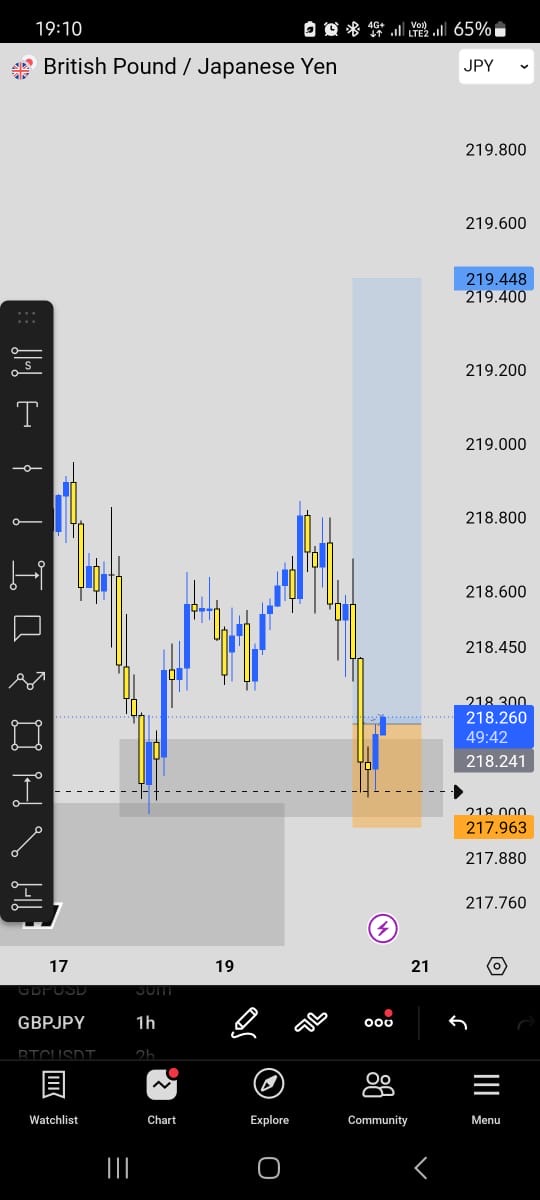
This looks like a GBP/JPY (British Pound/Japanese Yen) 1-hour chart with a buy trade setup.

Here's what it's saying:

The blue rectangle above is your Take Profit (TP) zone. If the price rises into this area, the trade closes in profit.

The orange rectangle below is your Stop Loss (SL) zone. If the price falls into this area, the trade closes with a loss.

The current price is around 218.260.

The entry appears to be around 218.24–218.26.

What the chart suggests

Price dropped sharply into the grey zone, which is likely marked as a demand/support area.

Buyers stepped in, and the recent blue candles show that price is bouncing upward.

The trader expects the price to continue rising toward 219.40–219.45, where the take-profit is placed.

Is the setup valid?

Based on the chart alone:

âś… The bounce from the support/demand zone is a bullish sign.

⚠️ However, the price has only just started moving up. It still needs to break above recent resistance before there's stronger confirmation that it will continue higher.

So, this chart is essentially saying:

"Buy GBP/JPY from this support area, risk a small loss below the support, and aim for a larger profit if the price continues upward."

Y
@youngancient - 11 hours ago
Quoted - wavey_

Based on your own understanding and research… what do you think about this setup?

Based on the set up and what I noticed firstly

Pair: GBP/JPY, 1-hour timeframe

Current price: 218.260, with a recent spike down to 218.241 area and a low of 217.963

Last candles show a sharp drop from the ~218.800 zone, then a small bounce.

Y
@youngancient - 11 hours ago
Quoted - wavey_

Based on your own understanding and research… what do you think about this setup?

Furthermore,

219.448 recent swing high (top of the blue highlighted zone), likely acting as resistance

218.260 / 218.241 current price zone, sitting right at a marked support/demand level (dotted line + dark horizontal line)

217.963 the orange zone's lower boundary, likely a demand/support area or a stop-loss/target reference

The gray horizontal zone (roughly 218.000–218.450) appears to mark a consolidation/support range from earlier price action (the dip around the 17th–18th)

Mehn Forex need someone to calm down and critically analyse

Y
@youngancient - 11 hours ago
Quoted - wavey_

Based on your own understanding and research… what do you think about this setup?

In conclusion this is a decision point where a bounce here would suggest support is holding; a clean break below 217.963 would suggest sellers are in control and the range is breaking down.

Thank you... Learning is always growing

Y
@youngancient - 10 hours ago
Quoted - pisces03

Is this ur own understanding or research...?

I've been learning before now but I want to have more knowledge...

Self knowledge

W
@wavey_ - 10 hours ago

What are things you think can affect the market???

Y
@youngancient - 10 hours ago
Quoted - wavey_

What are things you think can affect the market???

Different factors actually cause changes market but are you talking about the market you posted above that we analyze?

P
@pisces03 - 10 hours ago
Quoted - wavey_

What are things you think can affect the market???

From research......

News releases (inflation, GDP, employment)

Interest rate decisions by central banks

Political events (elections, wars, instability)

Economic data (CPI, unemployment, retail sales)

Market sentiment (fear or greed)

Supply and demand

Natural disasters or pandemics

High-impact speeches by central bank officials

Liquidity and trading sessions (London, New York)

Technical levels (support, resistance, trendlines)

For GBP/JPY, pay special attention to:

Bank of England (BoE) news

Bank of Japan (BoJ) news

UK and Japan economic reports

Global risk sentiment (risk-on/risk-off).

J
@jigg_s - 10 hours ago
Quoted - wavey_

Based on your own understanding and research… what do you think about this setup?

This looks like a GBP/JPY 1-hour chart with a trade setup drawn on it.

Here's what it's saying:

Blue rectangle = Take Profit (TP). The trader expects the price to move up into this area.

Orange rectangle = Stop Loss (SL). If price falls into this area, the trade is considered wrong and closes at a loss.

The entry is around 218.24–218.26.

The target is around 219.45.

The stop loss is around 217.96.

Looking at the candles:

Price dropped into the gray demand/support zone.

Buyers stepped in, creating a bullish (blue) candle.

The trader is betting that support will hold and GBP/JPY will continue rising.

Is the idea valid?

Yes, it looks like a buy setup because:

âś… Price reacted from a support/demand zone.

âś… Buyers have started pushing the price up.

âś… The risk-to-reward ratio appears favorable (the potential profit is much larger than the potential loss).

However, there's no guarantee it'll work. Price could still break below the support and hit the stop loss.

P
@pisces03 - 35 minutes ago

Good morning everyone...

P
@pisces03 - 31 minutes ago

Trust God we all slept well

I have a question concerning trading....

What is the best time to enter a trade....?

1 2 ... 12 13 14 15 16 17 18 19 20 21 Next »

Disclaimer:

At MyTradingLand.com, we connect you with forex brokers and provide a community for traders. While we offer valuable information and resources, please note that we are not financial advisors and cannot provide personalized financial advice. Always conduct your own research and invest responsibly.

Community Guidelines: The MyTradingLand.com community is designed as a resource for forex traders, promoting respectful and constructive discussions. We reserve the right to remove any content that is misleading, abusive, or violates our terms of service.

Broker Information: While we may receive commissions or advertising income from some of the brokers listed, this does not imply an endorsement of any broker, nor does it affect our review process. Our evaluations are based solely on objective criteria and user feedback.

Always verify the regulatory status of any broker with your local financial authority, along with their terms and privacy policies, before engaging with them. It is crucial to conduct thorough research to ensure that you are making informed decisions.

Risk Warning: At MyTradingLand.com, we strive to provide accurate information; however, the forex market is highly volatile and can change rapidly. It is essential to verify any information before making investment decisions.

Please be aware that trading in forex involves substantial risk, and it is possible to lose more than your trading equity/investment capital. 70-90% of retail CFD traders incur losses in their trading activities as per information from various brokers.

You are solely responsible for your use of MyTradingLand.com and any trading decisions you make. We encourage all users to educate themselves thoroughly about forex trading and to consider seeking advice from qualified financial professionals.

Advertising Disclosure: We may earn commissions from recommended brokers, but our reviews are independent (not influenced by potential earnings). Sponsored content is clearly marked and doesn't reflect our views.

©2026 ©2025 All rights reserved Mytradingland.com