US OIL
US Oil (WTI) Bullish Setup – Straight to the Point
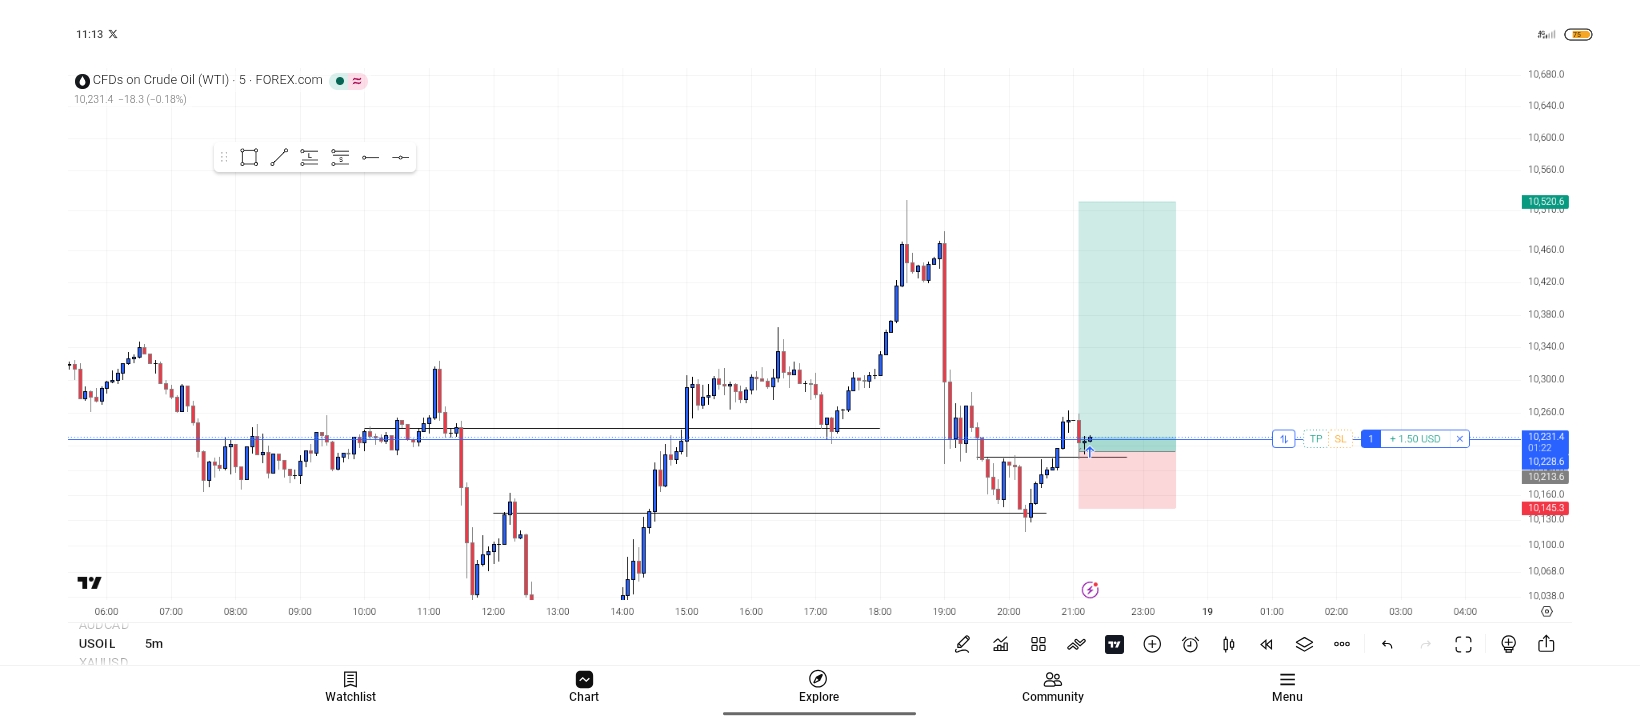
I'm bullish here.
Why?
Price just reacted nicely from a strong 1-hour Order Block (a key support zone where big buyers are likely stepping in).
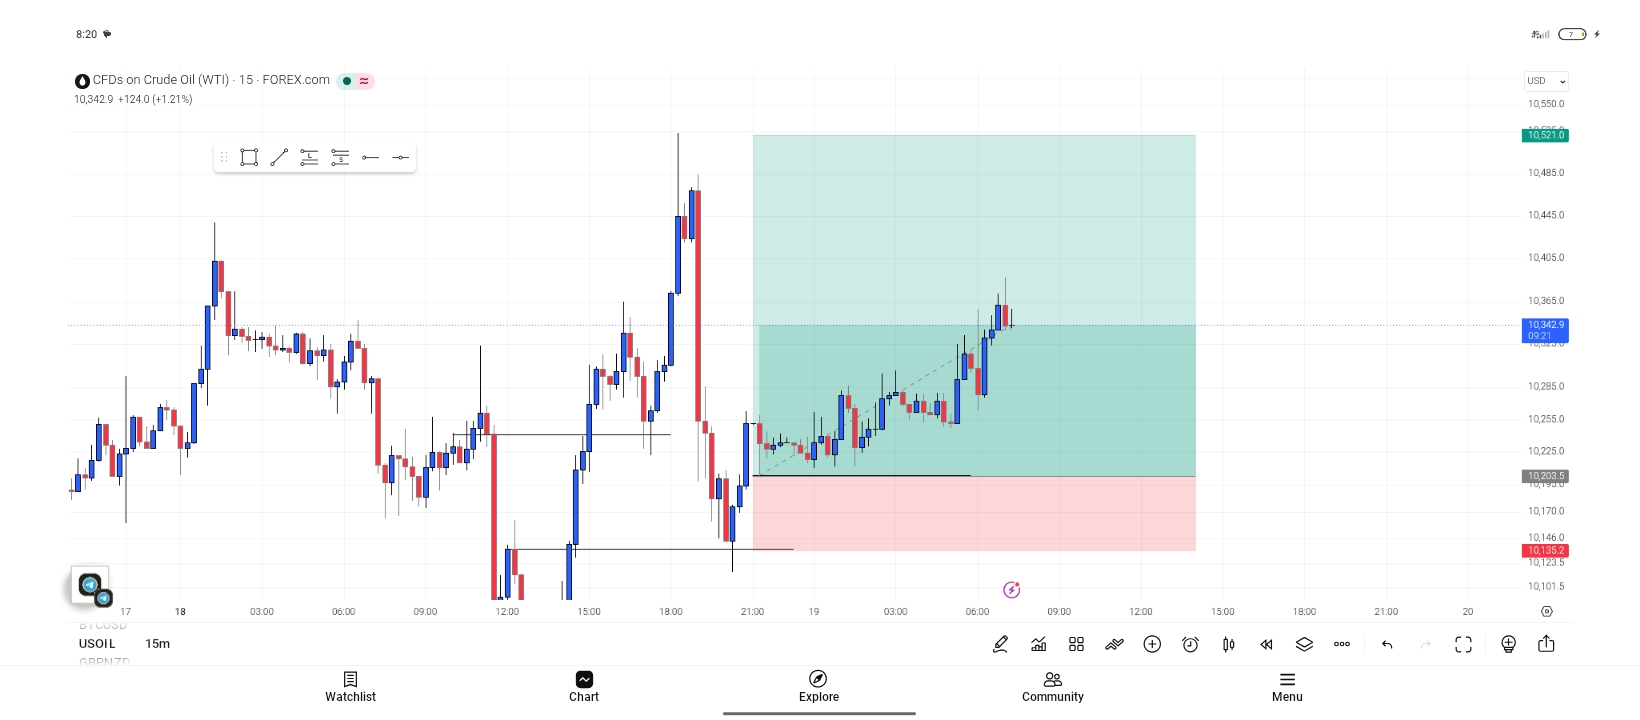
On the 15-minute chart, we have a clear Market Structure Shift price made a higher low and broke a small high. This shows the short-term selling is weakening and buyers are taking control.
Simple Trade Idea:
- Buy on confirmation (strong green candle closing above recent highs on 15M or 5M).
- Target: The green zone higher up (next resistance area).
- Stop Loss: Below the Order Block / pink zone (your invalidation level).
This is a classic higher-timeframe support + lower-timeframe momentum shift setup. Expect a bullish move to the upside if it holds.
Trade safe, manage risk, and wait for your confirmation candle. That's it.
The Big Picture (2-Hour Chart)
Oil hit a ceiling, a strong resistance zone where price has been rejected before. Think of it like a roof. Every time price touches it, it gets pushed back down. That's your first signal that sellers are in control up there.
What Happened Next (Zooming In)
Once price hit that roof, it didn't just dip, it broke structure. Meaning it started making lower lows, which is the market's way of saying "the direction is shifting downward." That's your market structure shift (MSS).
Before breaking down though, the market swept liquidity basically it grabbed the stop losses sitting below recent lows to fuel the move.
**What You're Waiting For Now**
The Big Picture (2-Hour Chart)
Oil hit a ceiling, a strong resistance zone where price has been rejected before. Think of it like a roof. Every time price touches it, it gets pushed back down. That's your first signal that sellers are in control up there.
What Happened Next (Zooming In)
Once price hit that roof, it didn't just dip, it broke structure. Meaning it started making lower lows, which is the market's way of saying "the direction is shifting downward." That's your market structure shift (MSS).
Before breaking down though, the market swept liquidity basically it grabbed the stop losses sitting below recent lows to fuel the move.
**What You're Waiting For Now**
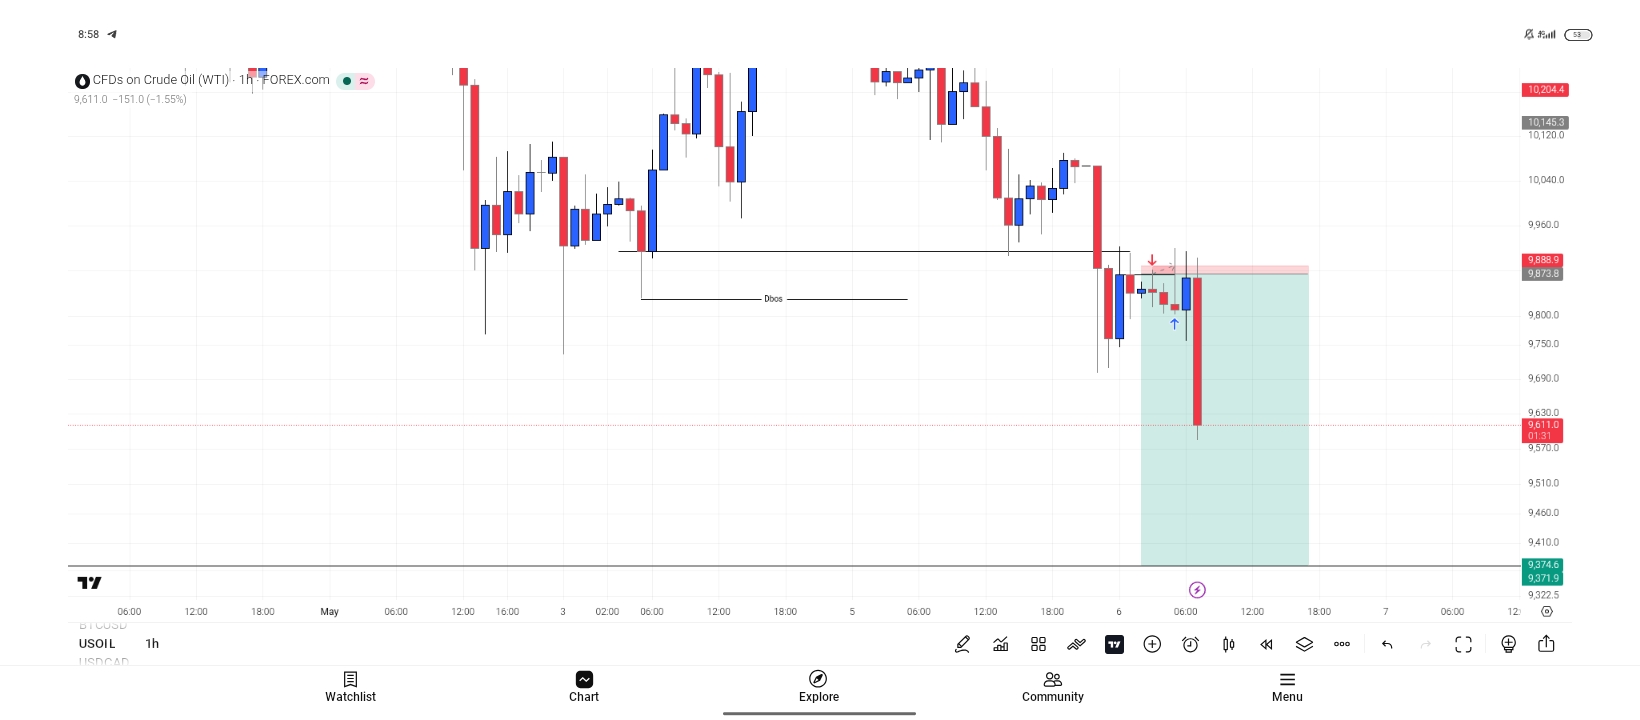
Price has dropped. But I'm not chasing it down.
I've spotted a POI (Point of Interest), a specific zone where you expect price to retrace back up to before continuing its drop. That's your sniper entry. You wait for price to come back up, tap that zone, and then you pull the trigger on the sell.
In summary:
> Price hit resistance, broke structure, and I sold at pullback in your zone to at the best possible price.
That green shaded area on your chart? That's the target zone below.
The Big Picture (2-Hour Chart)
Oil hit a ceiling, a strong resistance zone where price has been rejected before. Think of it like a roof. Every time price touches it, it gets pushed back down. That's your first signal that sellers are in control up there.
What Happened Next (Zooming In)
Once price hit that roof, it didn't just dip, it broke structure. Meaning it started making lower lows, which is the market's way of saying "the direction is shifting downward." That's your market structure shift (MSS).
Before breaking down though, the market swept liquidity basically it grabbed the stop losses sitting below recent lows to fuel the move.
**What You're Waiting For Now**
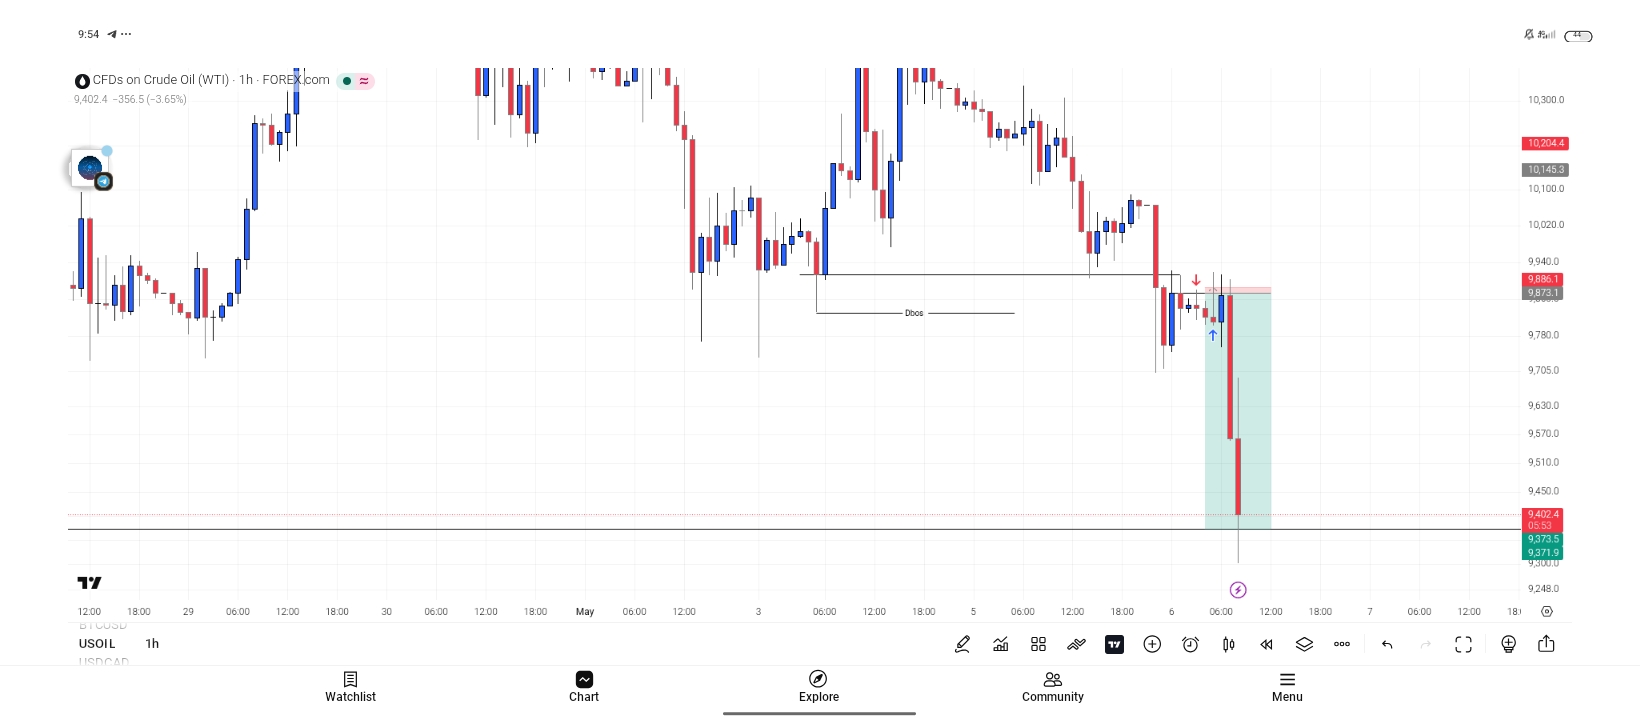
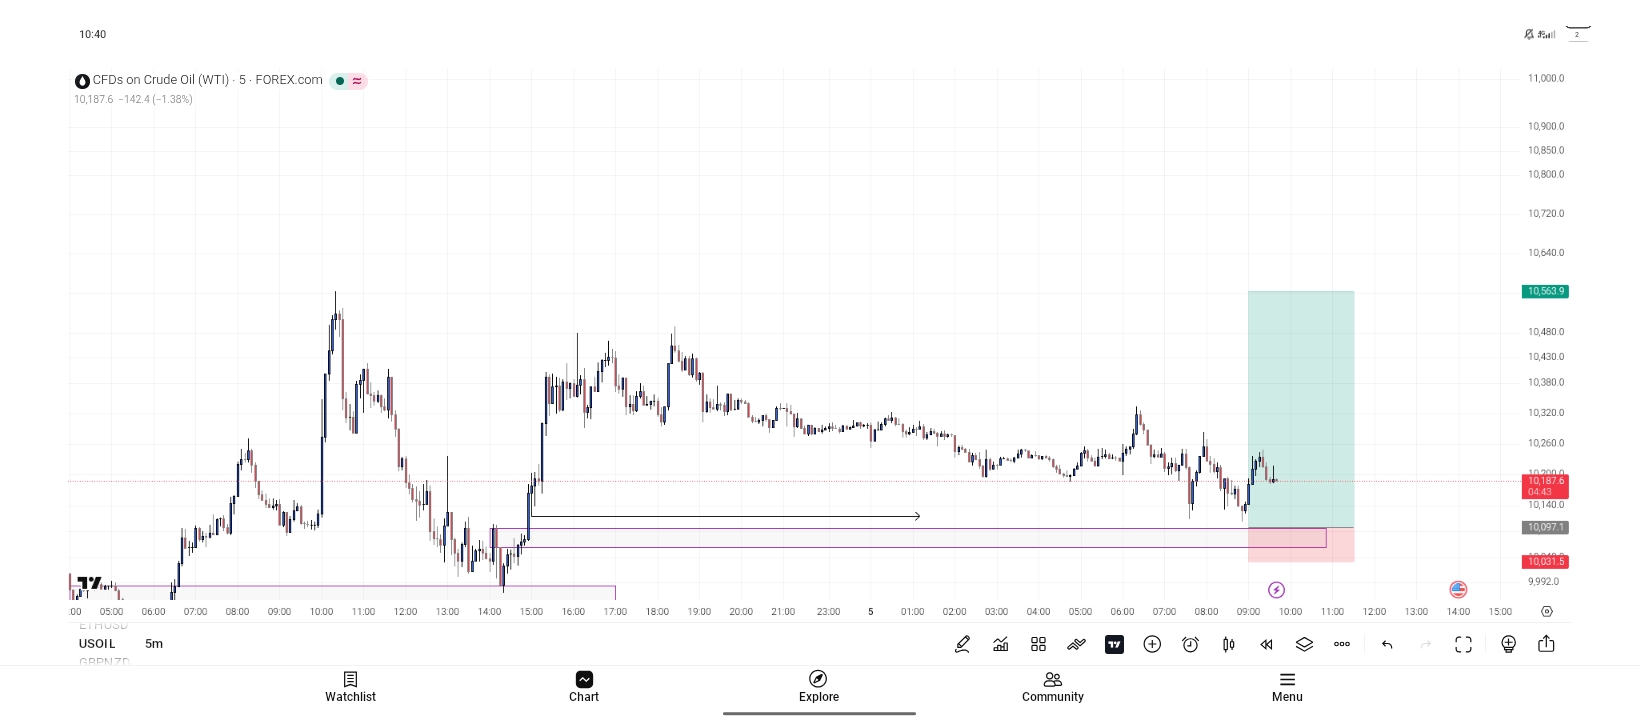
Got stopped out, then market tanked.
This means our direction wasn't wrong but our entry was wrong.
Unto the next.
Got stopped out, then market tanked.
This means our direction wasn't wrong but our entry was wrong.
Unto the next.
I'm still expecting a retracement to the up side for a possible re-entry
There was no chance for any re-entry, market took us out and went straight to TP
Massive dump, for me if I have a bias I just trade that bias I dont wait for price to meet e half-way. If I am very confident in my bias I will set a wide SL
That's fair, two different approaches but both can work depending on your style. The thing is though, trading your bias straight away without waiting for a level does expose you to more noise, you might be right on direction but get shaken out before it moves. Waiting for price to come to you gives you a better entry and tightens your risk naturally.
The wide SL when confident thing is a double edged sword too. Confidence is good but the market doesn't care how confident you are, so sizing down when the SL is wide is key otherwise one bad trade does too much damage.
Massive dump, for me if I have a bias I just trade that bias I dont wait for price to meet e half-way. If I am very confident in my bias I will set a wide SL
But yeah if the system is working for you, that's what matters at the end of the day.
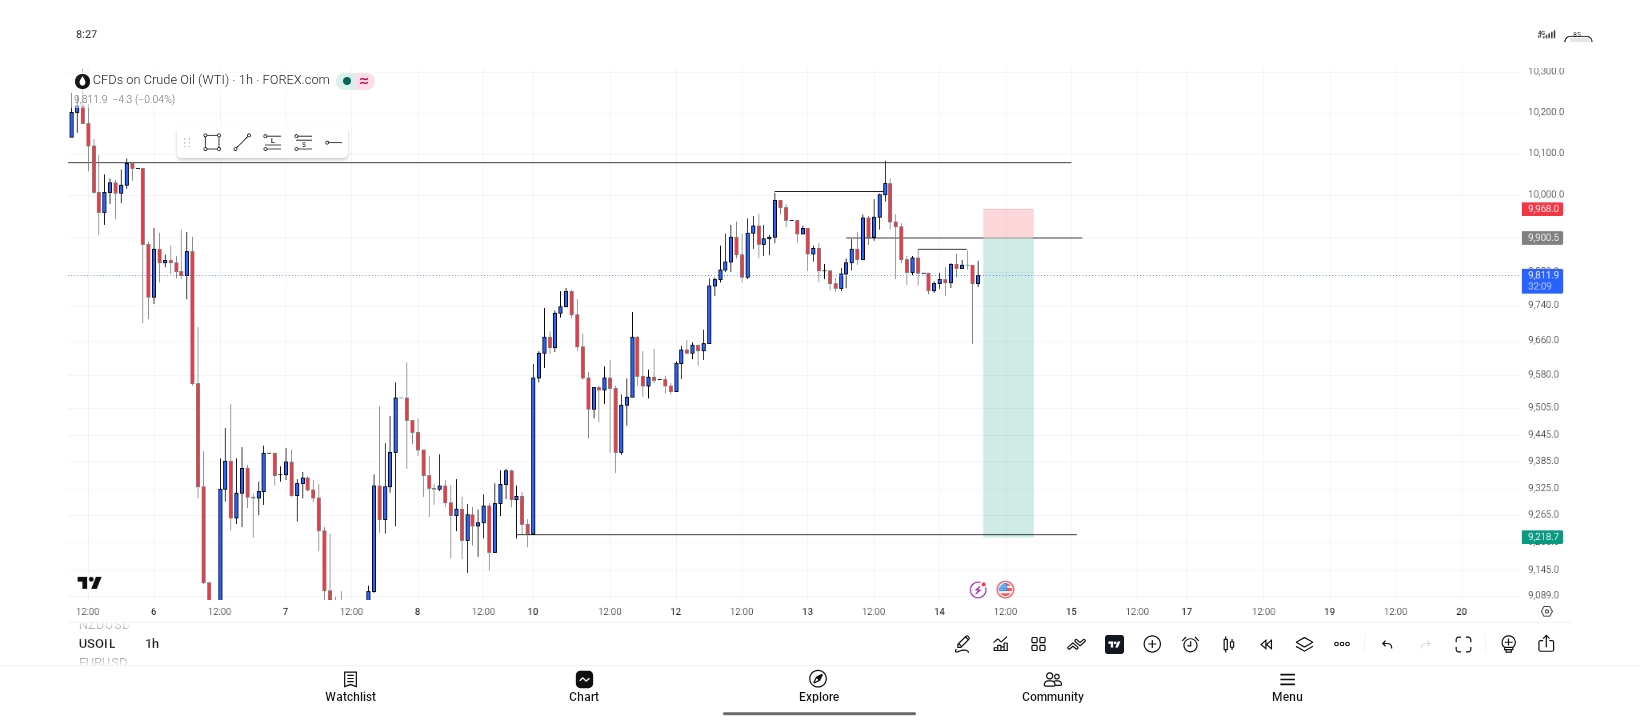
US Oil (WTI) 1H Sell Setup – Simple Breakdown
On the daily chart, price reached a strong resistance level and formed a CRT (counter-trend rally). This suggests the up-move is likely exhausted and sellers are stepping in.
US Oil (WTI) 1H Sell Setup – Simple Breakdown
On the daily chart, price reached a strong resistance level and formed a CRT (counter-trend rally). This suggests the up-move is likely exhausted and sellers are stepping in.
We zoomed into the 1H chart and saw:
- A Market Structure Shift (MSS) – price broke lower, confirming the short-term trend has changed to bearish.
- Liquidity swept above recent highs (buyers trapped).
- Now we’re waiting for price to pull back into the Breaker Block (a strong supply zone where sellers previously showed control).
US Oil (WTI) 1H Sell Setup – Simple Breakdown
On the daily chart, price reached a strong resistance level and formed a CRT (counter-trend rally). This suggests the up-move is likely exhausted and sellers are stepping in.
Trade Plan:
- Wait for price to retrace into the Breaker Block on 1H.
- Enter sell once it shows rejection (candlestick confirmation or displacement down).
- Target: lower liquidity pools and previous lows.
- This is a high-probability sell in the direction of the higher-timeframe resistance.
US Oil (WTI) 1H Sell Setup – Simple Breakdown
On the daily chart, price reached a strong resistance level and formed a CRT (counter-trend rally). This suggests the up-move is likely exhausted and sellers are stepping in.
Simple: Daily resistance + 1H bearish shift + waiting for pullback to sell. No chasing. Patience for the retrace.
US Oil (WTI) 1H Sell Setup – Simple Breakdown
On the daily chart, price reached a strong resistance level and formed a CRT (counter-trend rally). This suggests the up-move is likely exhausted and sellers are stepping in.
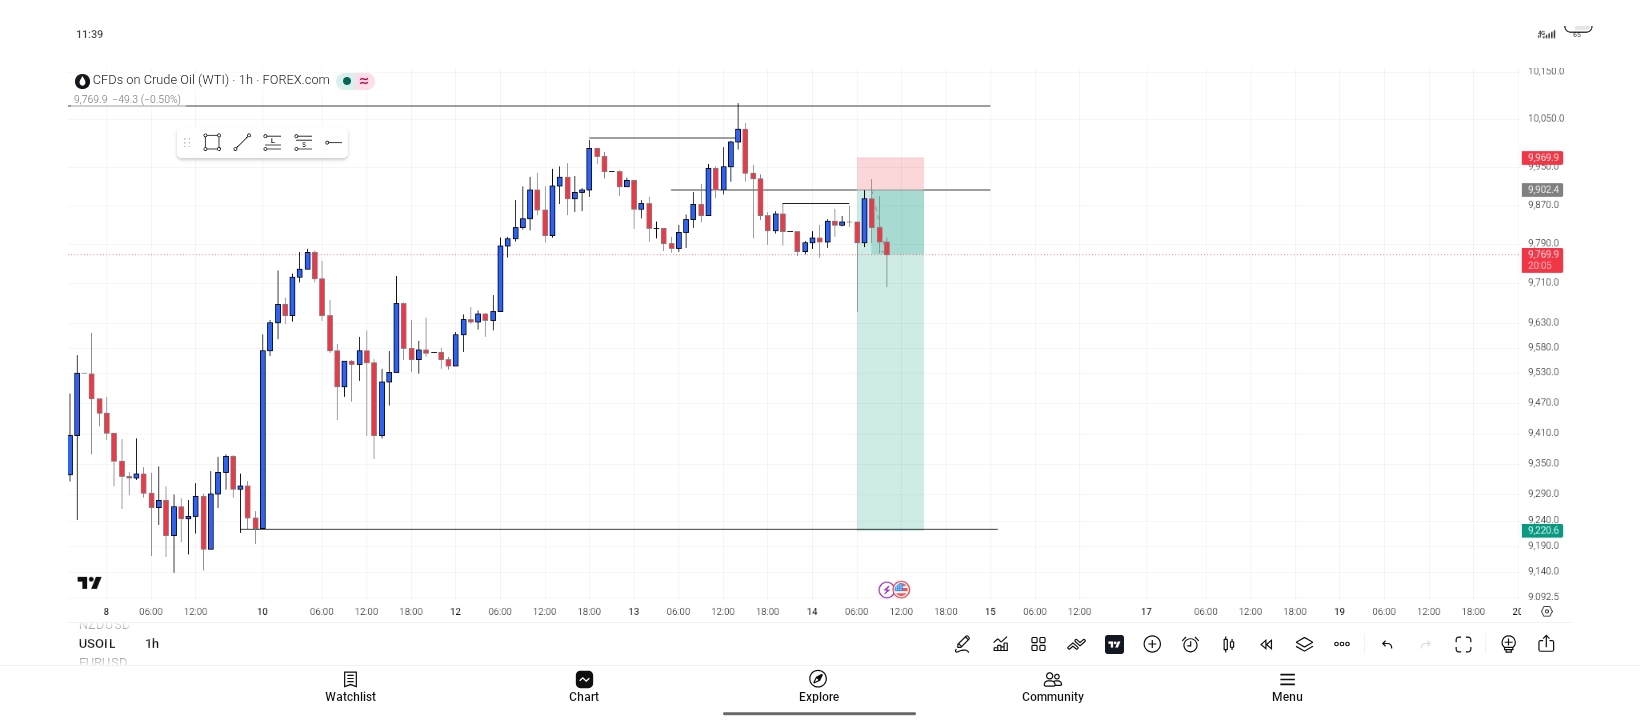
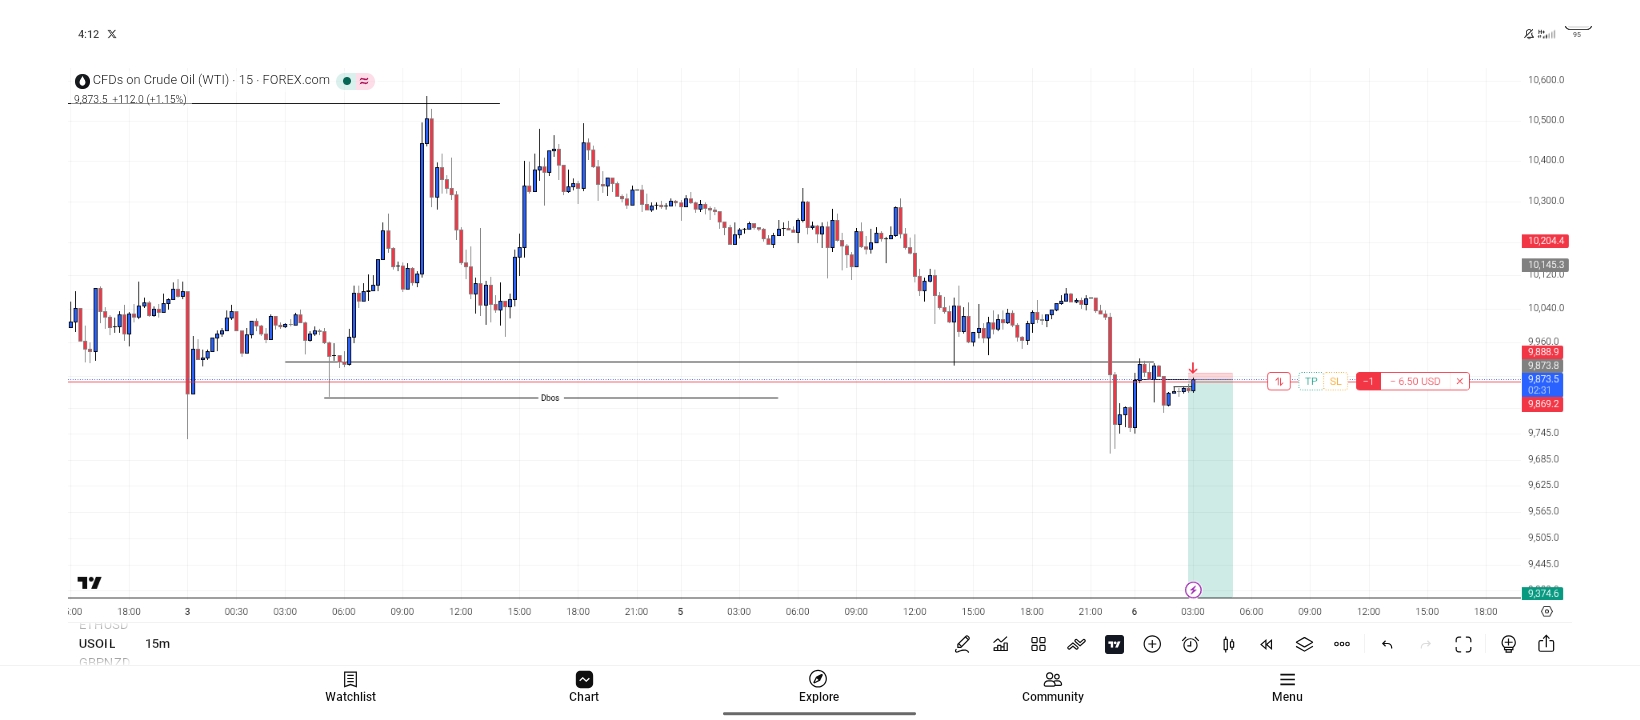
Price has triggered our sell limit order.
Are you trading with any fundamentals? because i know oil is influenced heavily by fundamentals