US OIL
G
@godswillfx
-
1 month ago
G
@godswillfx
-
1 month ago
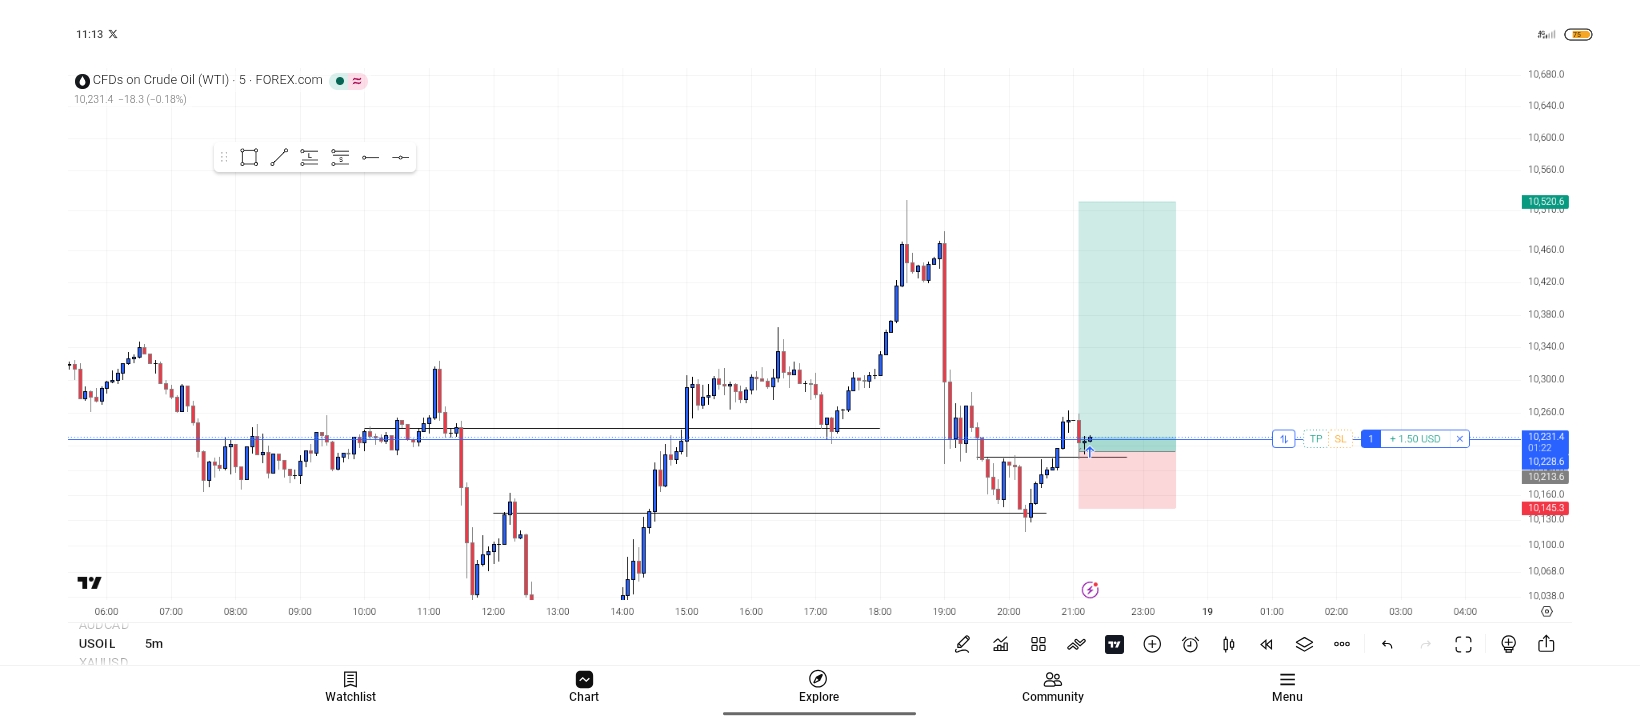
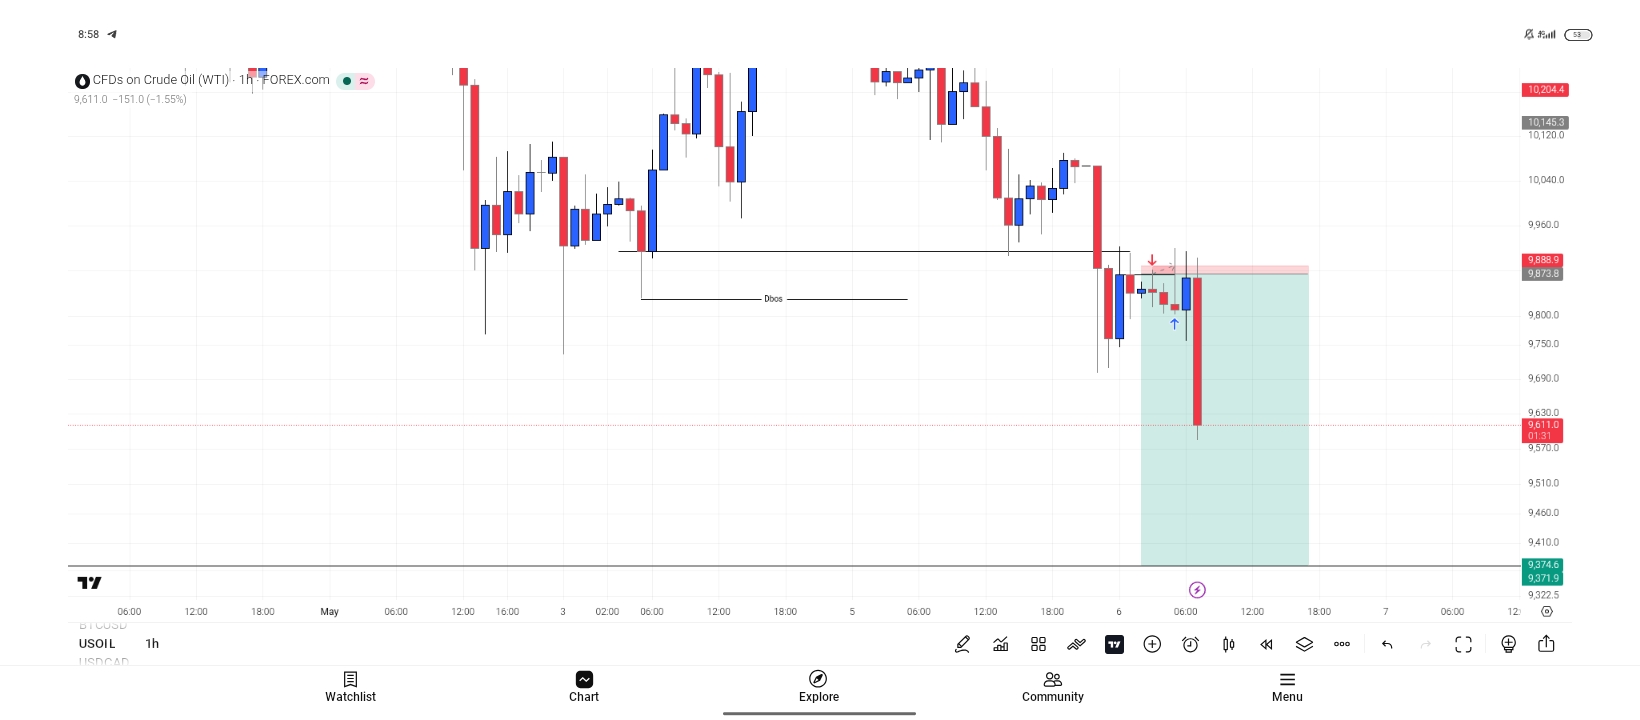
Quoted - godswillfx
There was no chance for any re-entry, market took us out and went straight to TP
G
@godswillfx
-
1 month ago
G
@godswillfx
-
1 month ago
G
@godswillfx
-
1 month ago
G
@godswillfx
-
1 month ago
G
@godswillfx
-
1 month ago
K
@kemi_allen_omevia
-
1 month ago
G
@godswillfx
-
1 month ago