
B
Sebastian
@biggy001
Last seen:
5 days ago
I do love trading. But am happy am back now.
0 Followers
2 Following
Gold moves were crazy, congrats to those who caught it I'm sitting out Gold today, focusing on AUDUSD and EURAUD H1 range. No clean setup yet, waiting for London. Coach what are you seeing on Gold today, are you expecting continuation or a pullback?
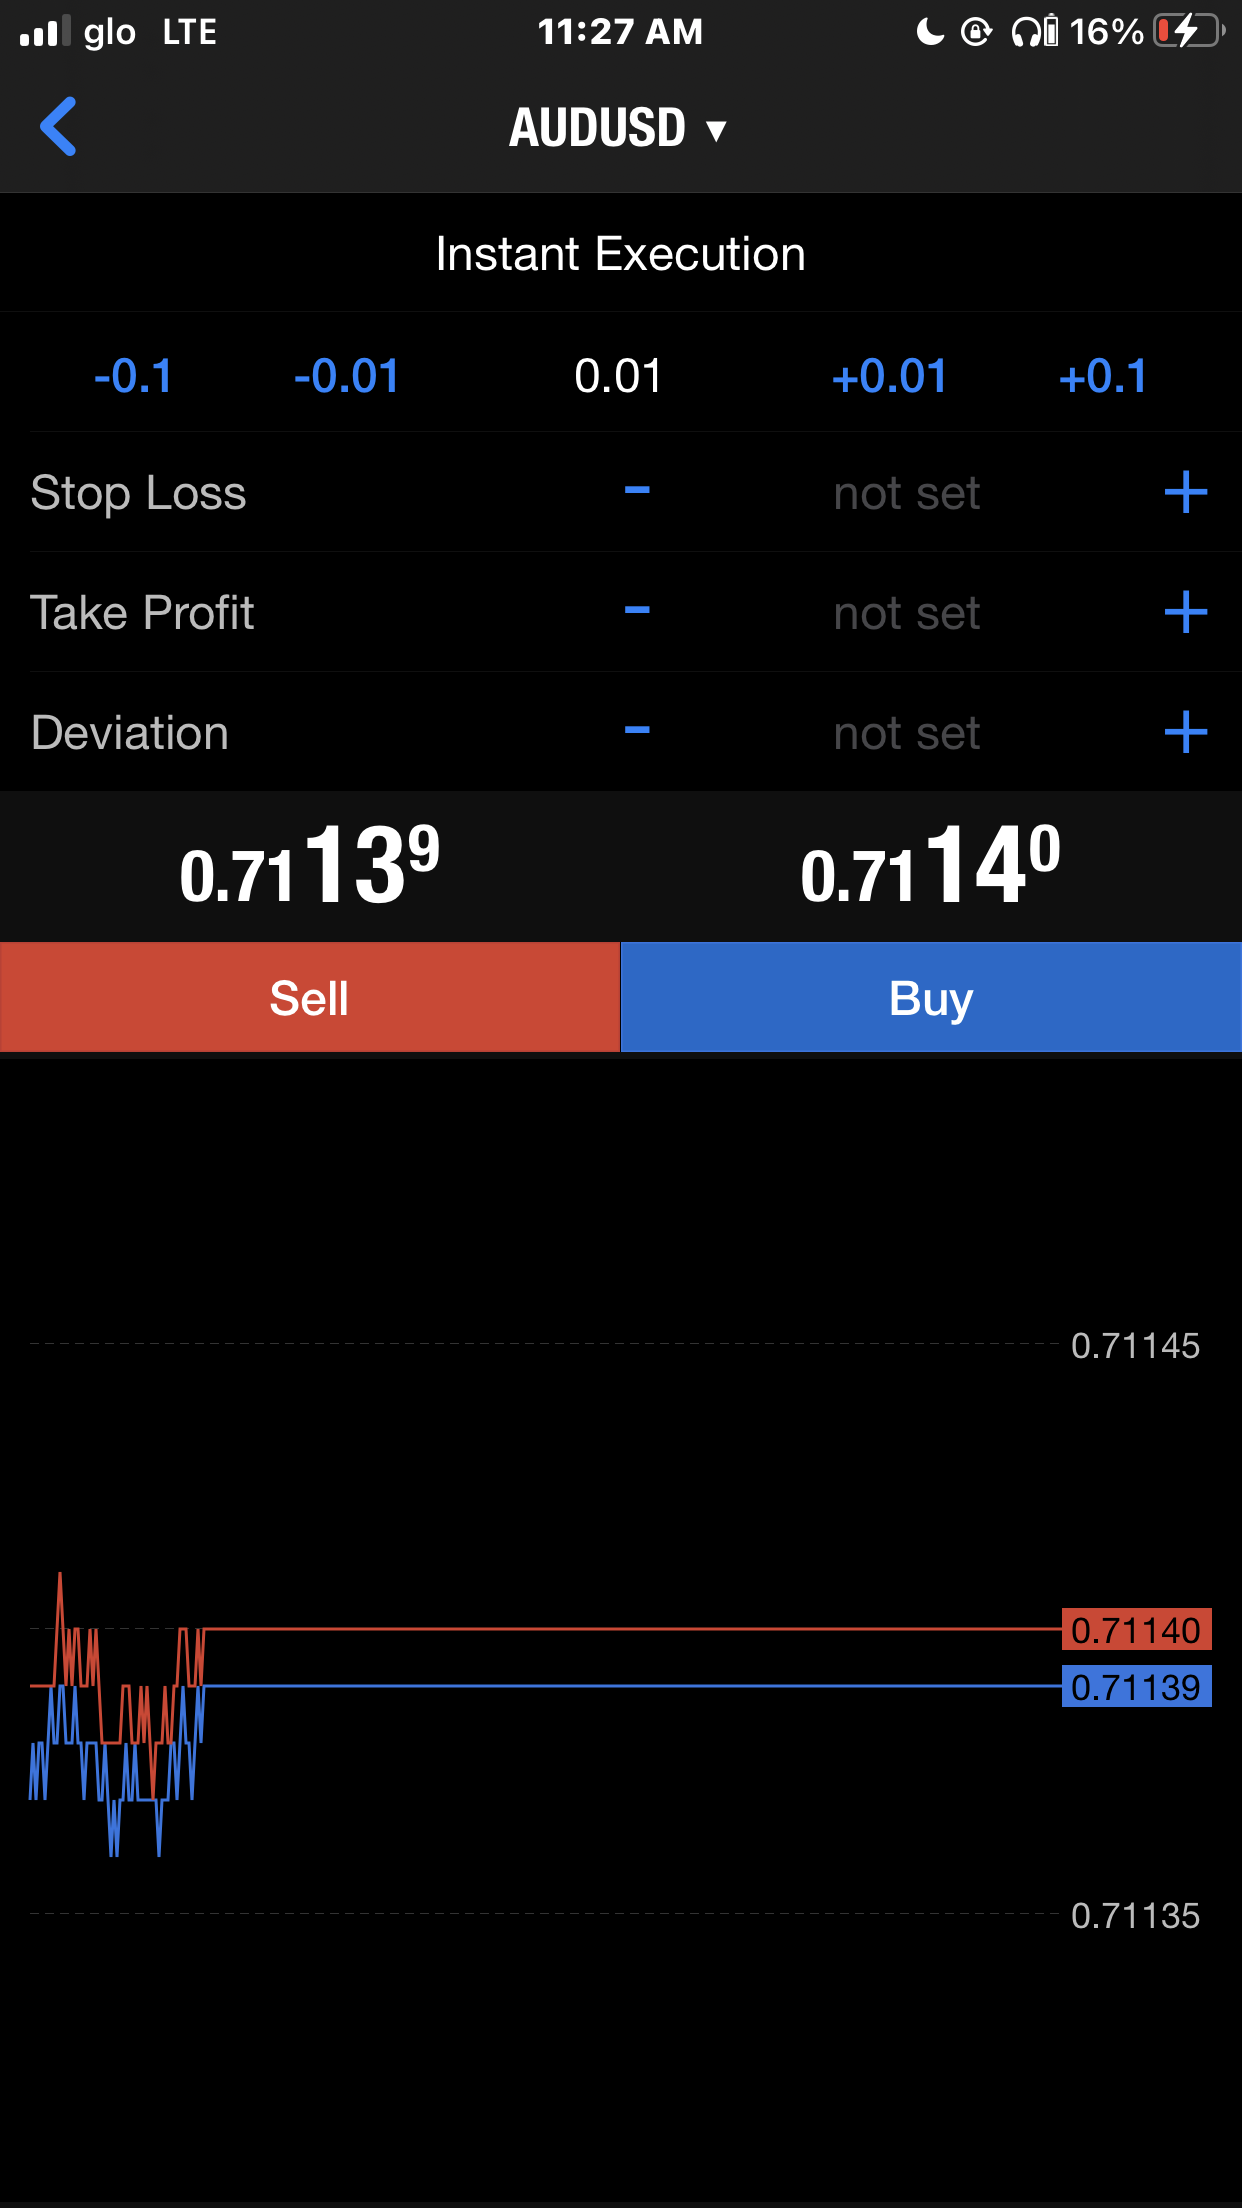
Monitoring AUDUSD, price currently ranging around 0.71139 - 0.71140 on low timeframe. Waiting for a clear break before entering. No trade taken yet, just watching price action.
It’s called Doji. A Doji is when the open price and close price are basically the same.
So the candlestick body is completely flat or zero, and you just get the wicks.
Answer: A. A level where a trader exits to secure a planned profit ✅
Quick breakdown:
- Take Profit (TP) = The price level you set in advance to automatically close your trade and lock in profit.
- Think of it as: "If price gets here, I'm happy. Close me and take the money."
Why not the others:
- B. That's increasing position size/risk, not TP
- C. Indicators are tools like RSI, MA. TP is an order level
- D. Broker fees = spread/commission/swap
Net per Trade Average
Total trades = 8
Total profit = $200 - $60 = $140
Average per trade = $140 / 8 = $17.50. Then $17.50 × 8 = +$140
This one is straightforward 😊
Given:
- Account size = $1,000
- Risk per trade = 2%
Calculation:
2% of $1,000 = 0.02 × 1000 = $20
Answer: B. $20
5. What should you look for before entering a trade?
This is basically your pre-flight checklist. You don't want to jump in blind ✈️
1. Market Context + Trend
2. Risk & Reward
3. Risk Management
4. Your Headspace
The 7 Majors
These make up ∼75% of all forex trading volume:
1. EUR/USD - Euro / US Dollar → "Euro"
2. GBP/USD - British Pound / US Dollar → "Cable"
3. USD/JPY - US Dollar / Japanese Yen → "Gopher"
4. USD/CHF - US Dollar / Swiss Franc → "Swissy"
5. AUD/USD - Australian Dollar / US Dollar → "Aussie"
6. USD/CAD - US Dollar / Canadian Dollar → "Loonie"
7. NZD/USD - New Zealand Dollar / US Dollar → "Kiwi"
Small body at the top + long lower wick/shadow. Can be green or red.
Just like in the pic:
This shows up at the bottom of a downtrend.
It means sellers pushed price down hard, but buyers came back and pushed it back up.
SMC translation: Sellers tried to take liquidity below, got rejected. Possible bullish reversal.
Signal: Potential buy / trend reversal up
First BOS = Price breaks a key low and holds below it.
It confirms the trend has changed.
After that we stop looking for buys and only look for sells.
Showing 20 of 39 replies.
Log in to see all replies