Alpha Circle Nsukka | Charts, Psychology & Market Discussions

P
@promisefx - 21 hours ago

The bullish candlestick:- this candlestick is green, and it closes higher than it opens, the lower wick is the lower point price could get to in the process of formation of the candlestick

P
@promisefx - 20 hours ago
Quoted - promisefx

The bullish candlestick:- this candlestick is green, and it closes higher than it opens, the lower wick is the lower point price could get to in the process of formation of the candlestick

Bearish candlestick:- it is colour red, it's close lower than it opens and the wick at the top and bottom is the highest and the lowest point respectively price could get to in the process Is of the formation at the candles sticks

P
@promisefx - 20 hours ago

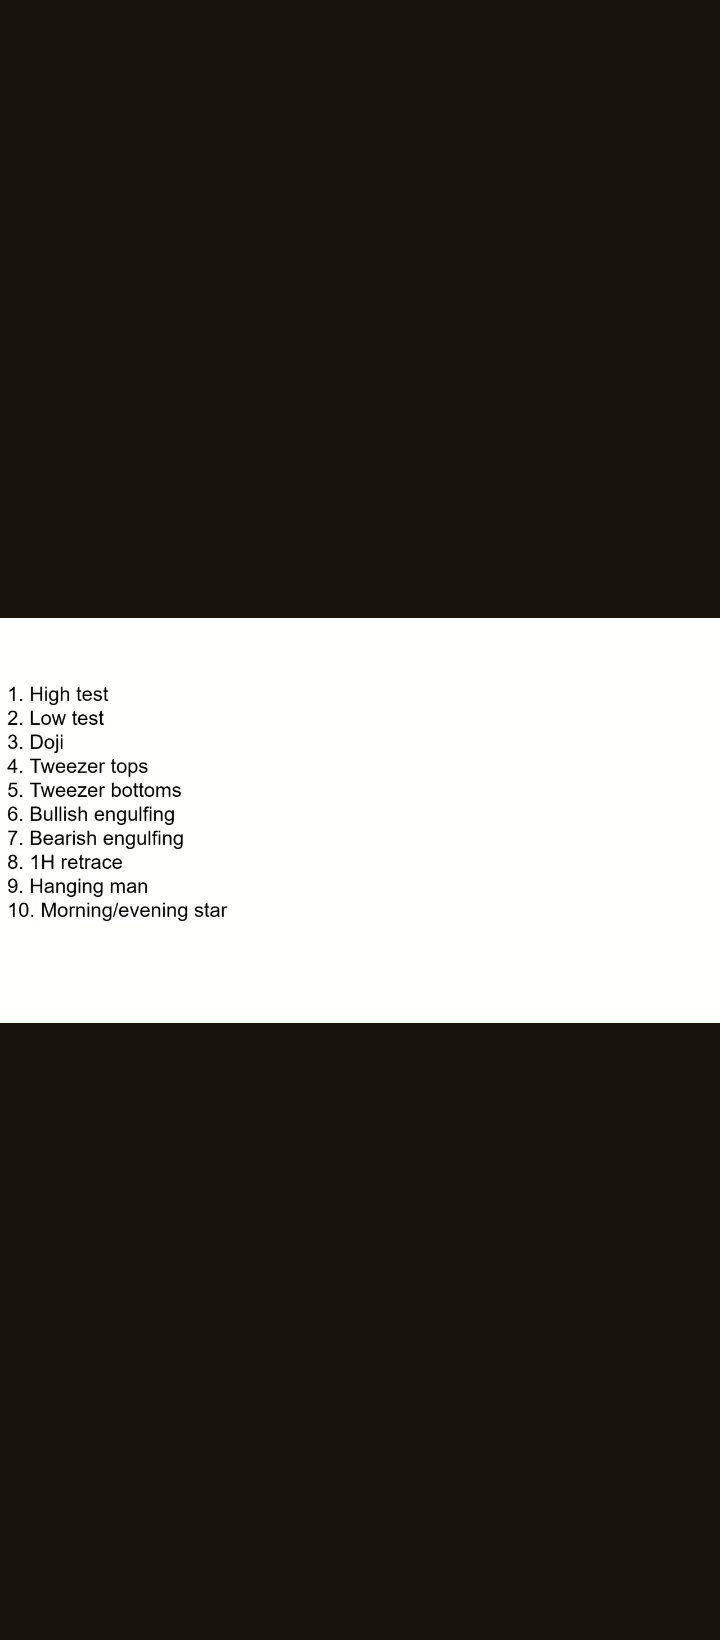
These are the candlestick we will e talking about

P
@promisefx - 20 hours ago

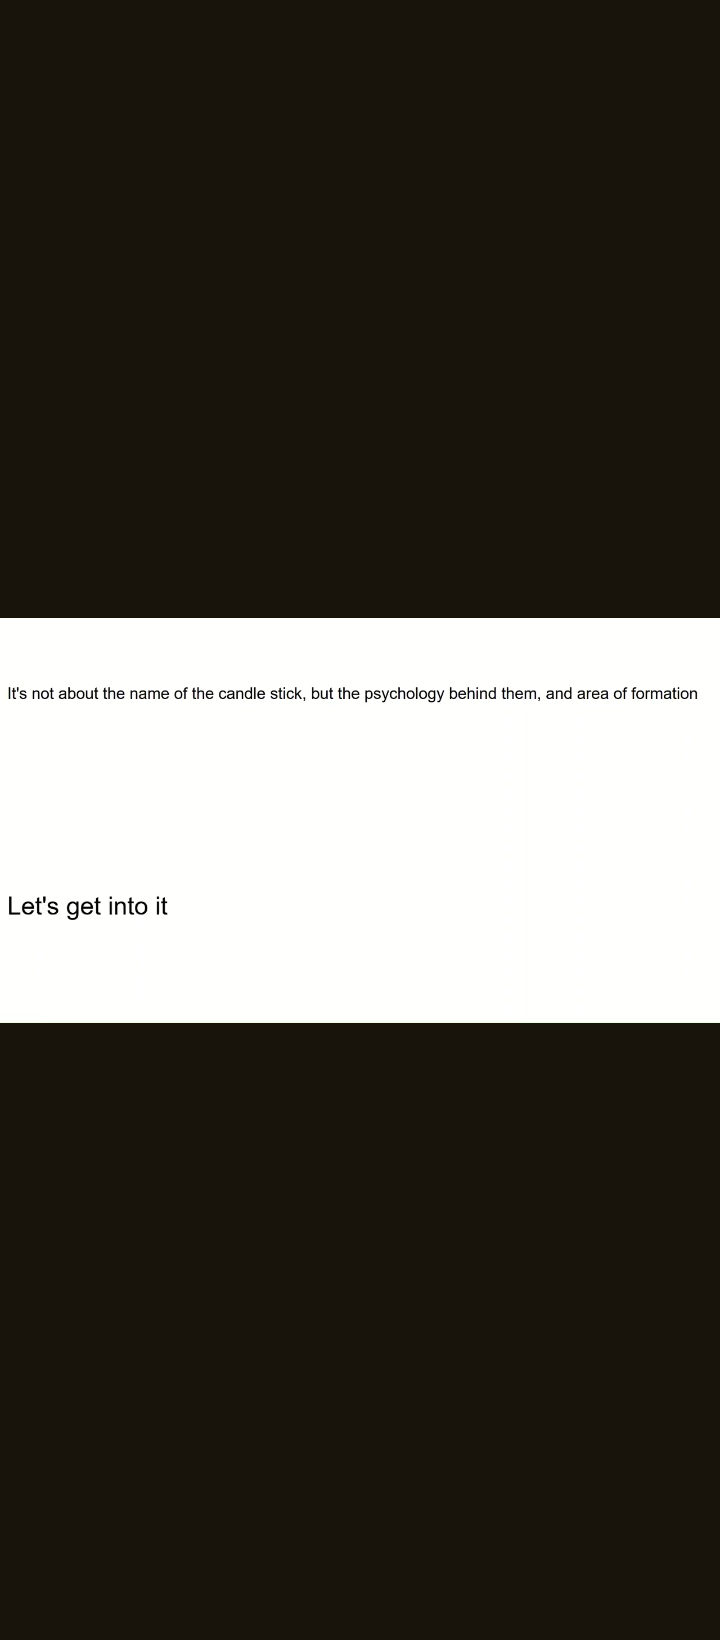
Now, you don't need to cram the name of this candlestick, you need to know the psychology behind them

P
@promisefx - 20 hours ago

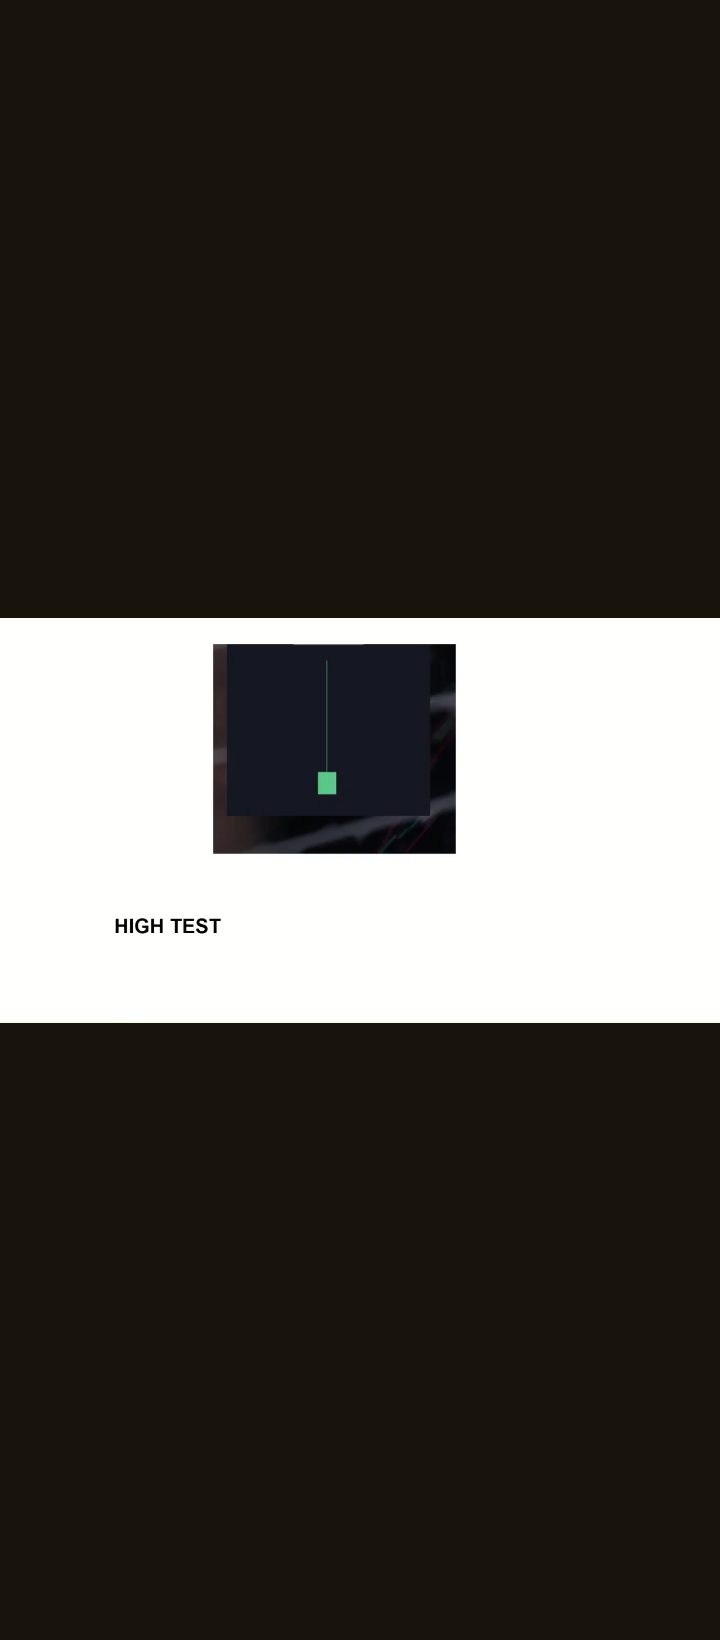
High test candlestick:- this candlestick Is a bullish one as you can see the colour is green, but a trader can change the color of a candle but by default it's green meaning It's bullish, it closes higher than it opens and it has upper wick

The psychology behind this candlestick is that traders are testing a particular structural resistance level are the initial open of the candlestick, signaling a potential towards movement

P
@promisefx - 20 hours ago

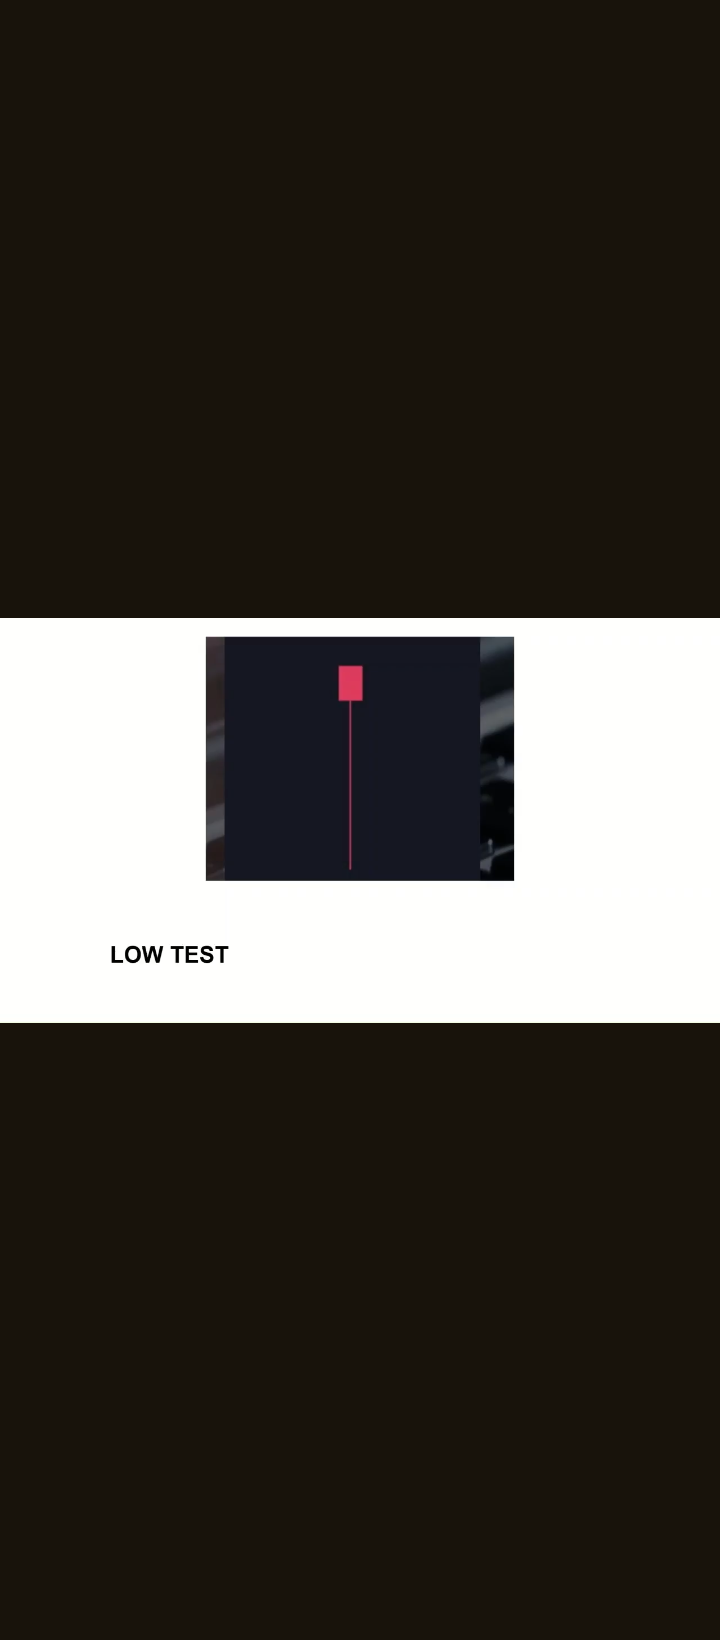
Low test candlestick:- is the opposite of the high test candlestick, it's bearish, hence is closes lower than it opens and there's a signing rejection creating a lower long wick

The psychology behind this candlestick formation is that buyers are testing a structural support level signaling a potential upwards move

P
@promisefx - 20 hours ago

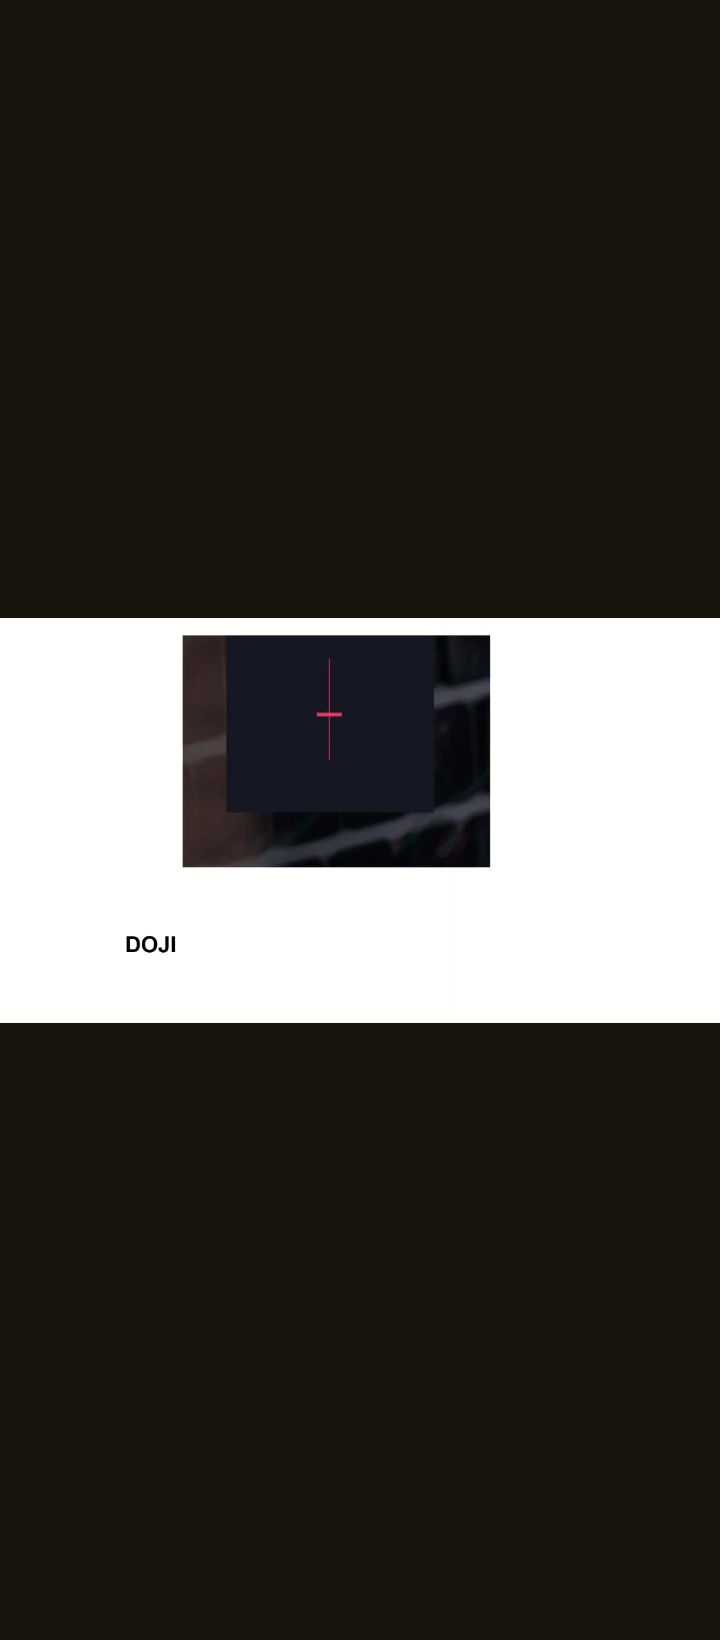
Doji:- this is a low momentum candlestick it also called indecision candlestick It's formed when there's a retracement, signaling a potential buy or sell

P
@promisefx - 20 hours ago

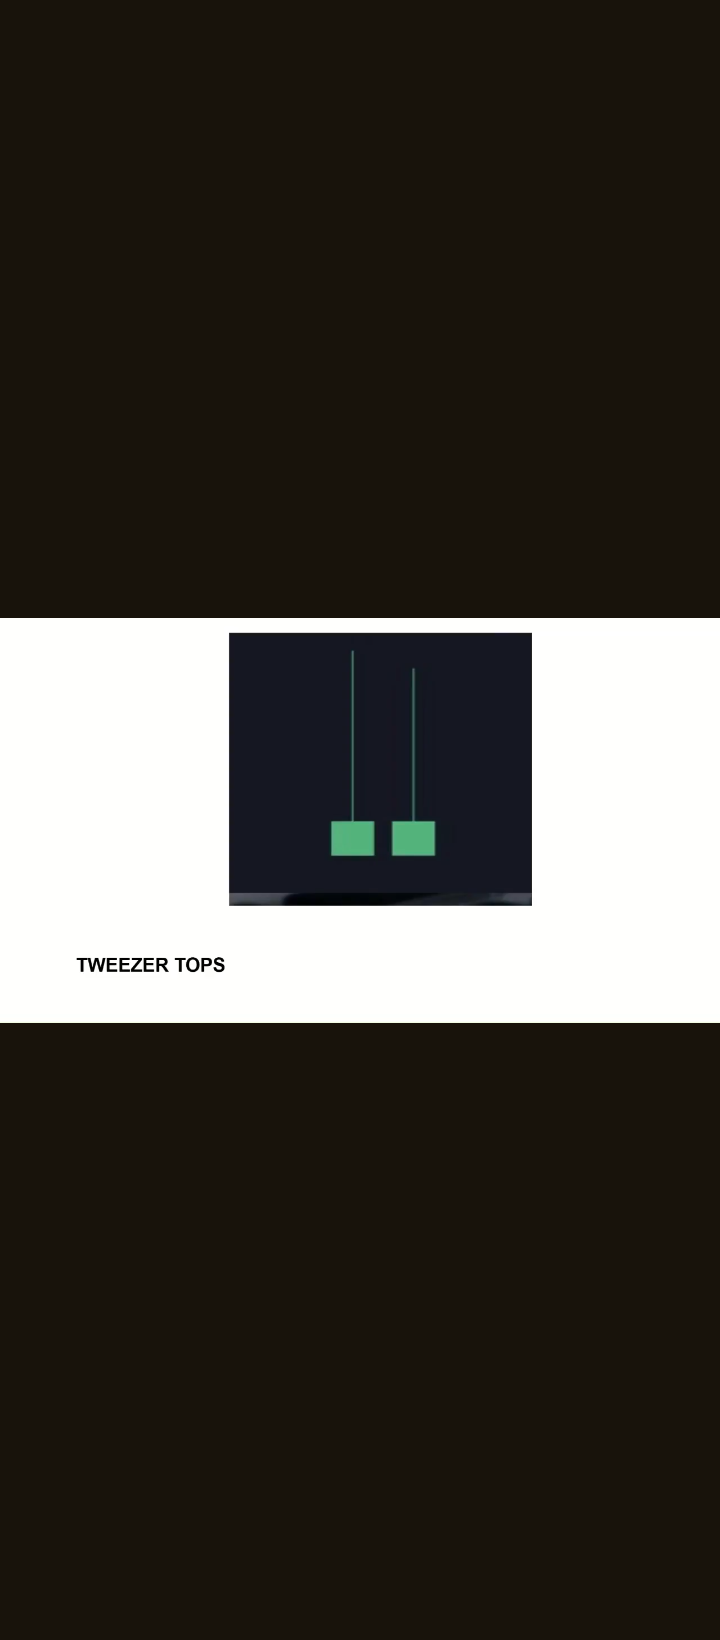
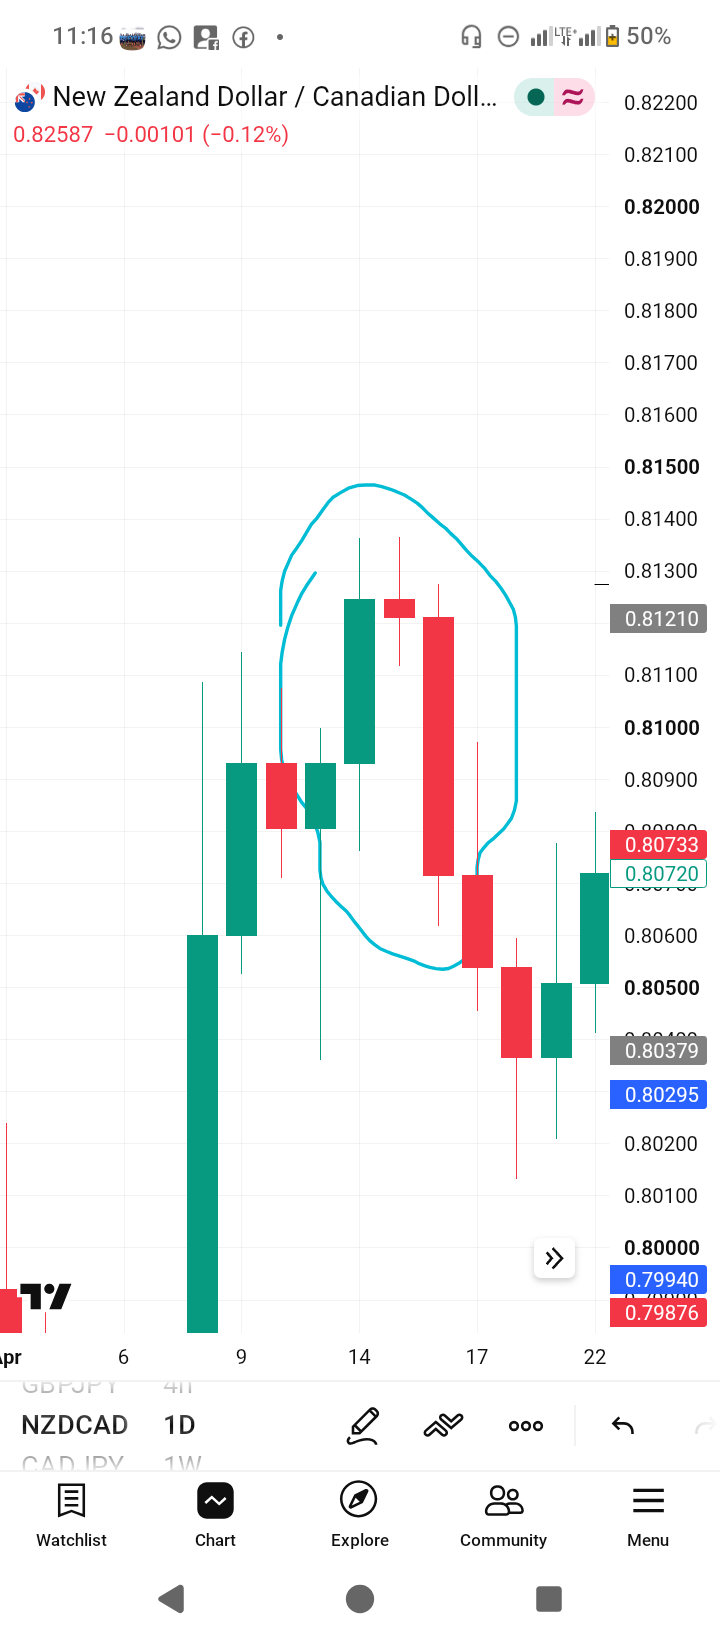
Tweezer top:- this is double of the high test candlestick, and it's usually stronger than the high test candlestick because this time it's 2 candlestick rejection a structural resistance level signaling a potential downward movement

P
@promisefx - 20 hours ago

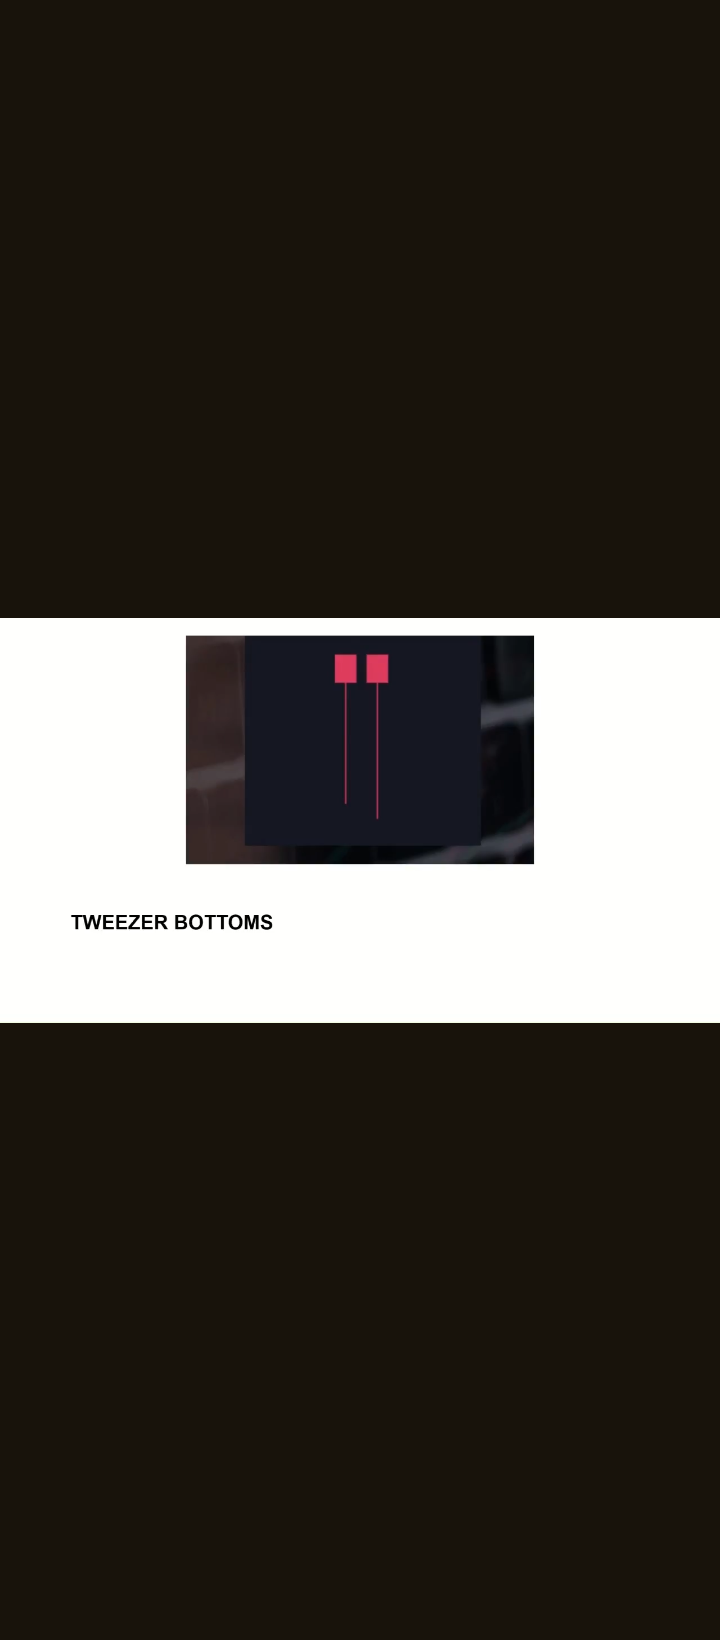
Tweezer bottom:- like the low test candlestick, it's a formation of 2 low test candlestick, this is of course stronger that the low test candlestick, this means that buyers has rejection a structural support level double and a potential bullish trend is expected

P
@promisefx - 20 hours ago

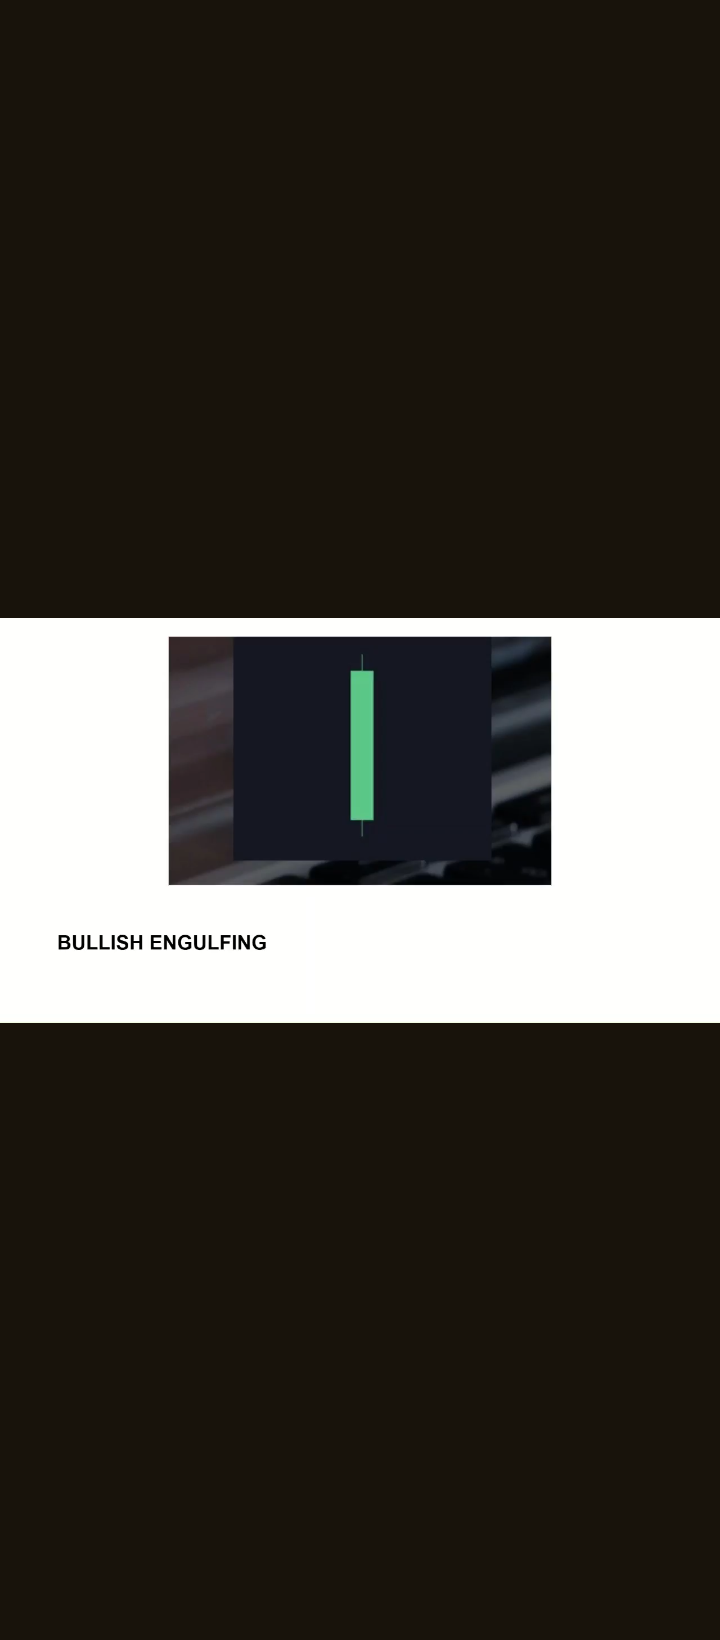
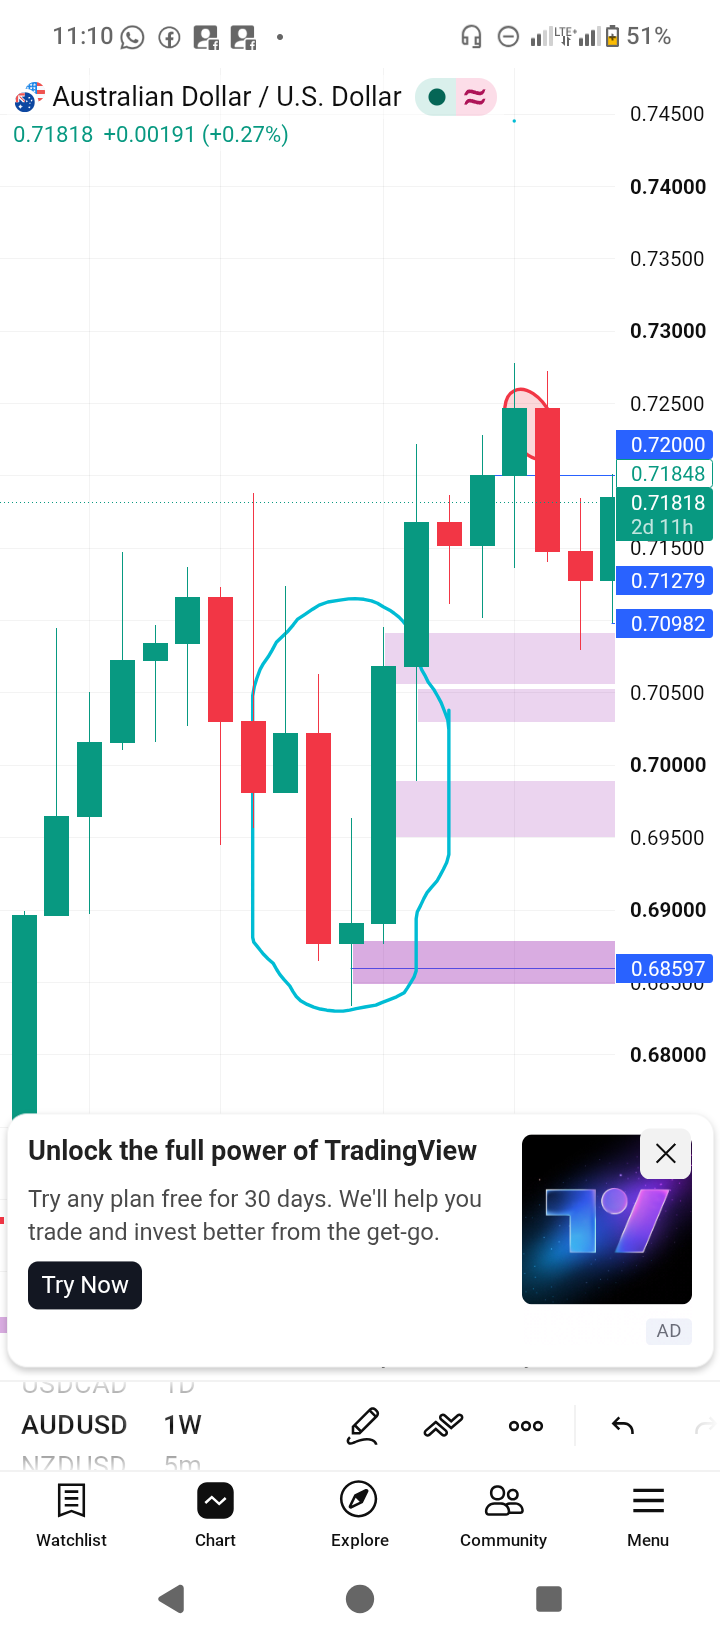
Bullish engulfing candlestick:- is an impulse price movement upwards, it's usually engulf in presiding candlestick and covers it

The psychology behind this candlestick is that buy are aggressively taking over sellers in the market

P
@promisefx - 20 hours ago

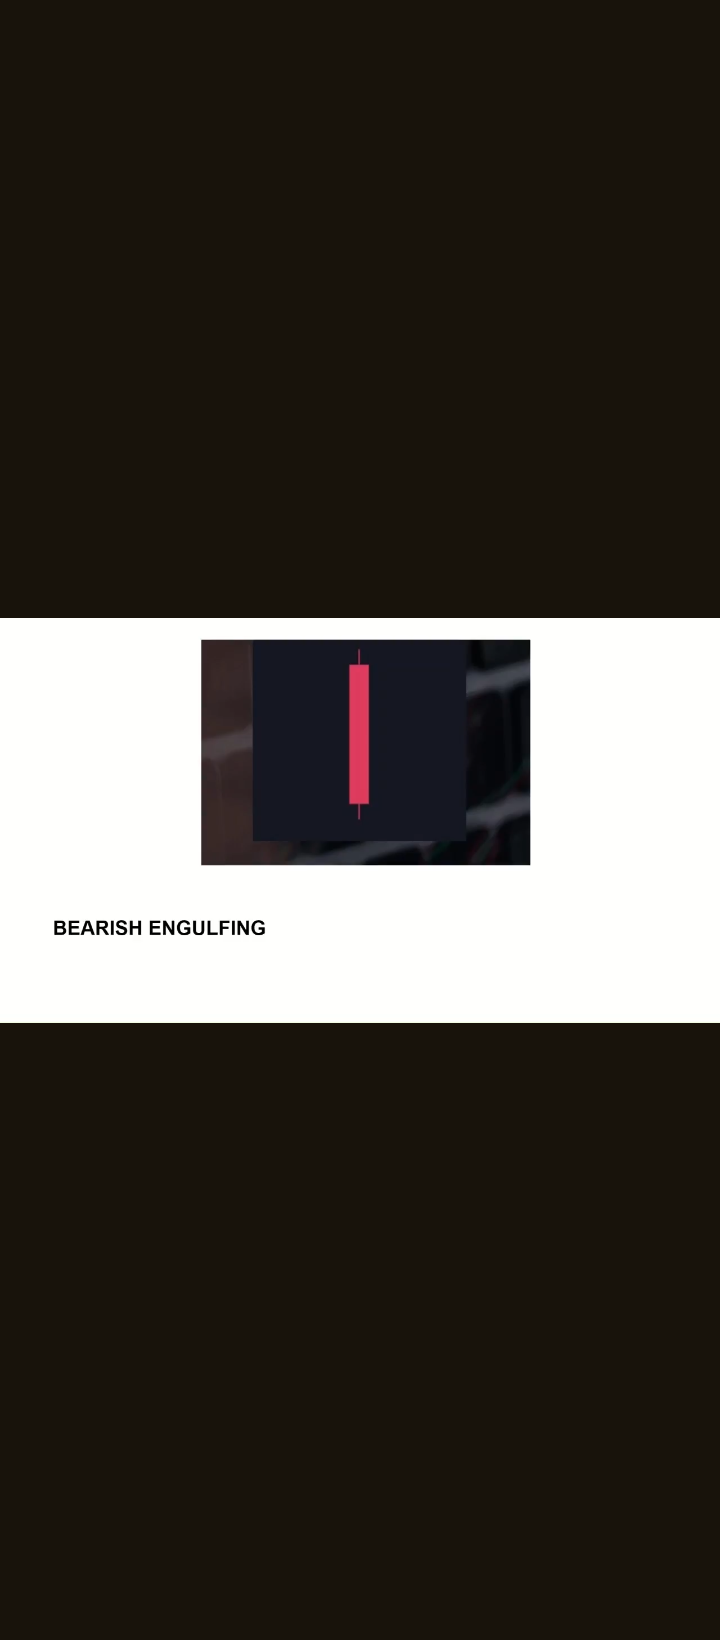
Bearish engulfing candlestick:- this is formed when there's in an impulse downwards movement, it's engulfs the candlestick that comes before it

The psychology behind this candlestick is that sellers are aggressively taking over buyers In the market

P
@promisefx - 20 hours ago

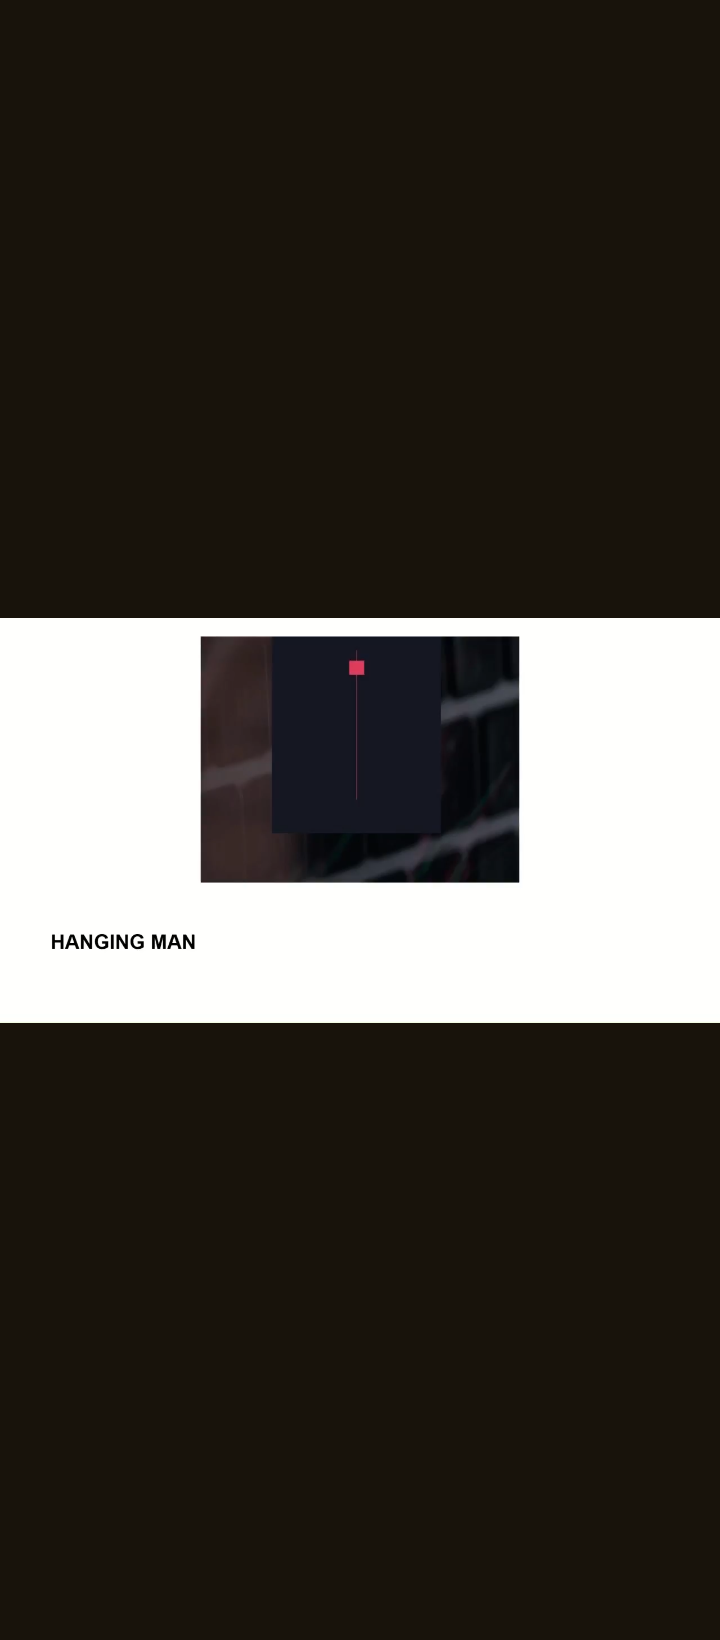
Hanging man:- Is formed at the top of a structure in the chart, it's signals an exhausting run and a potential downward movement

P
@promisefx - 19 hours ago

Morning start:- this is 3 candlestick formation a bearish engulfing, doji or pin bar and bullish engulfing candlestick,

It's formed at the bottom of a downtrend market signaling a potential buy

P
@promisefx - 19 hours ago

Evening star:- this candlestick is the opposite of the morning star candlestick, it's formed at the top of a bullish trend and signaling a potential downward movement

Disclaimer:

At MyTradingLand.com, we connect you with forex brokers and provide a community for traders. While we offer valuable information and resources, please note that we are not financial advisors and cannot provide personalized financial advice. Always conduct your own research and invest responsibly.

Community Guidelines: The MyTradingLand.com community is designed as a resource for forex traders, promoting respectful and constructive discussions. We reserve the right to remove any content that is misleading, abusive, or violates our terms of service.

Broker Information: While we may receive commissions or advertising income from some of the brokers listed, this does not imply an endorsement of any broker, nor does it affect our review process. Our evaluations are based solely on objective criteria and user feedback.

Always verify the regulatory status of any broker with your local financial authority, along with their terms and privacy policies, before engaging with them. It is crucial to conduct thorough research to ensure that you are making informed decisions.

Risk Warning: At MyTradingLand.com, we strive to provide accurate information; however, the forex market is highly volatile and can change rapidly. It is essential to verify any information before making investment decisions.

Please be aware that trading in forex involves substantial risk, and it is possible to lose more than your trading equity/investment capital. 70-90% of retail CFD traders incur losses in their trading activities as per information from various brokers.

You are solely responsible for your use of MyTradingLand.com and any trading decisions you make. We encourage all users to educate themselves thoroughly about forex trading and to consider seeking advice from qualified financial professionals.

Advertising Disclosure: We may earn commissions from recommended brokers, but our reviews are independent (not influenced by potential earnings). Sponsored content is clearly marked and doesn't reflect our views.

©2026 ©2025 All rights reserved Mytradingland.com