EUR/USD Beginner Level trading

Y
@yokoyi - 1 year ago
Quoted - yokoyi

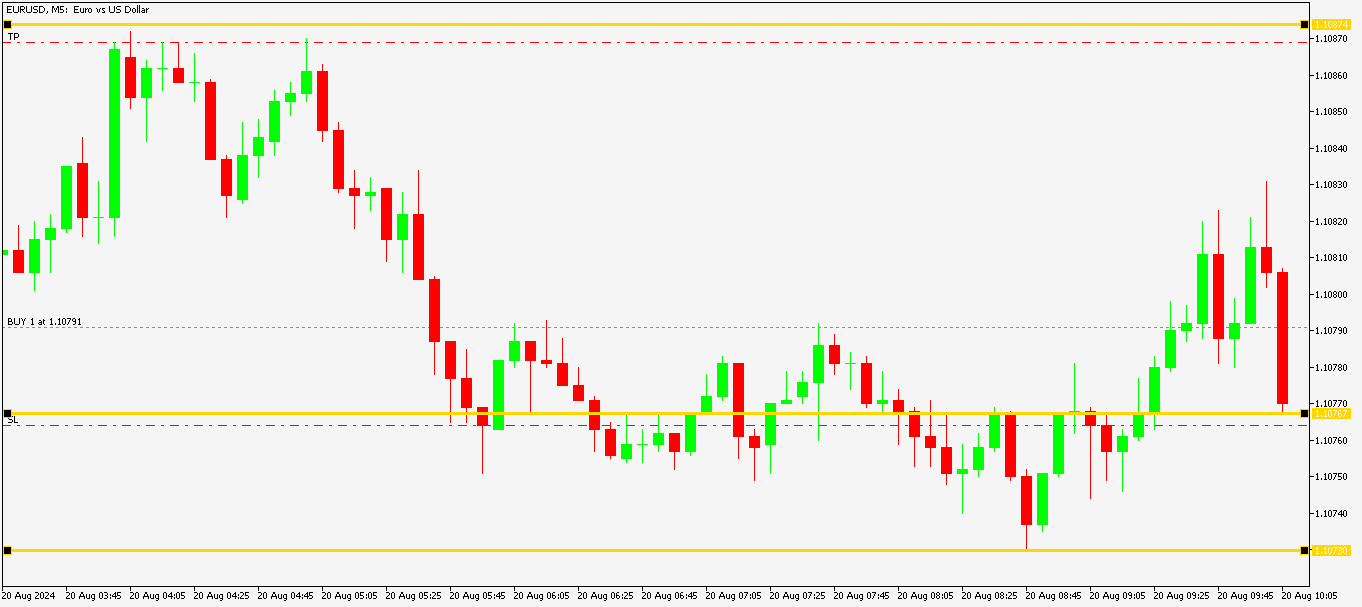
see details of take profit and stop loss here

When you look at where i placed my Stop Loss & Take Profit, it means I am risking $30 to gain around $85.

Y
@yokoyi - 1 year ago
Quoted - yokoyi

When you look at where i placed my Stop Loss & Take Profit, it means I am risking $30 to gain around $85.

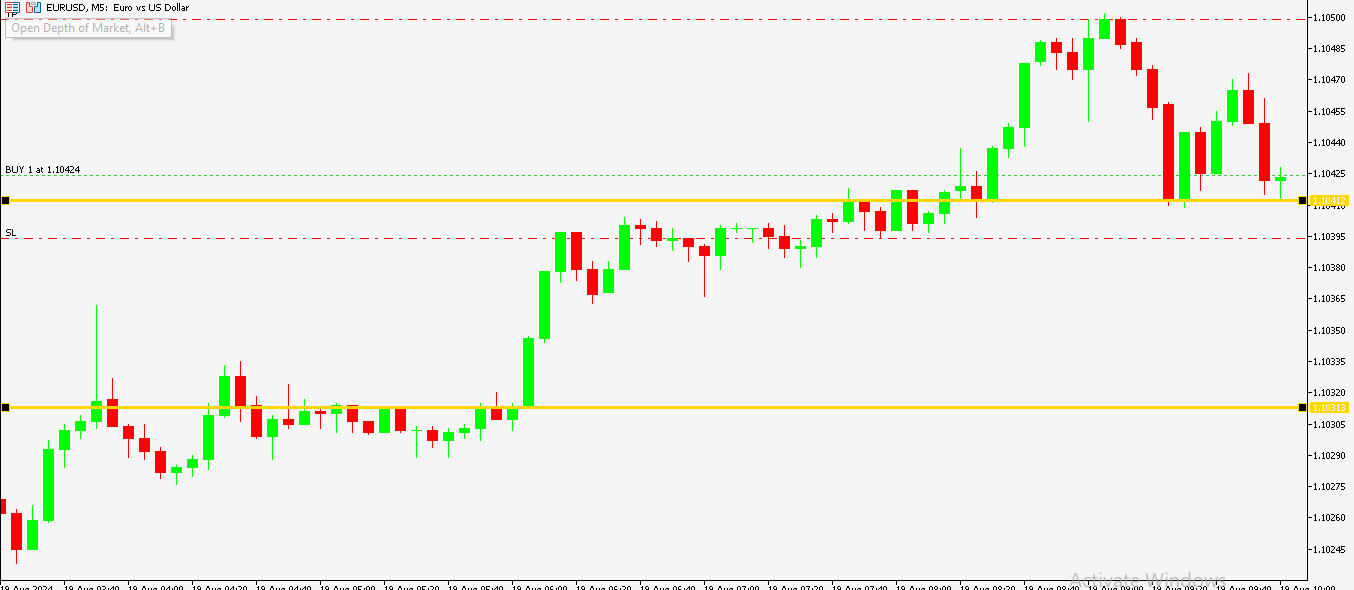
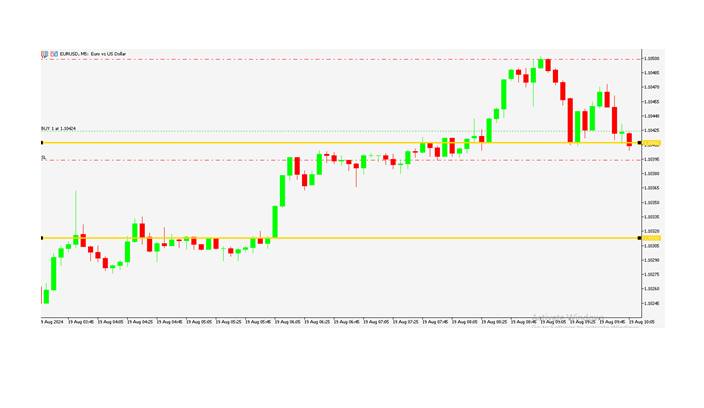
Price has dropped to the support line again and is bouncing off. This support is line is a good area of value. See, price tested it twice and bounced back.

Y
@yokoyi - 1 year ago
Quoted - yokoyi

Price has dropped to the support line again and is bouncing off. This support is line is a good area of value. See, price tested it twice and bounced back.

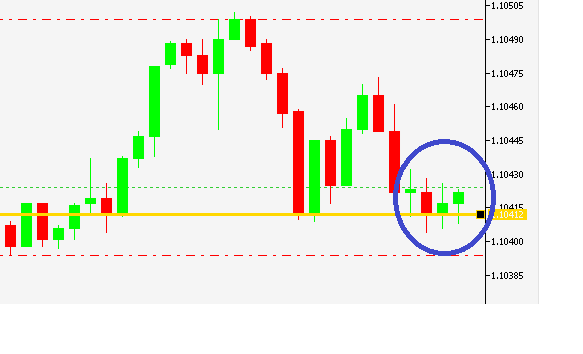
Price has tested our support area and slightly breached it. I expect price to reverse and continue above the support line.

However, if price does otherwise and breaches the support line, then it will hit my Stop Loss.

I am not going to adjust not Stop Loss to shift it lower because that will be indiscipline.

As a trader i believe in setting a strategy and sticking to it. Instead of always adjusting stop loss every time the market moves against me.

Y
@yokoyi - 1 year ago
Quoted - yokoyi

Price is still testing the support level.

This support level is very valuable

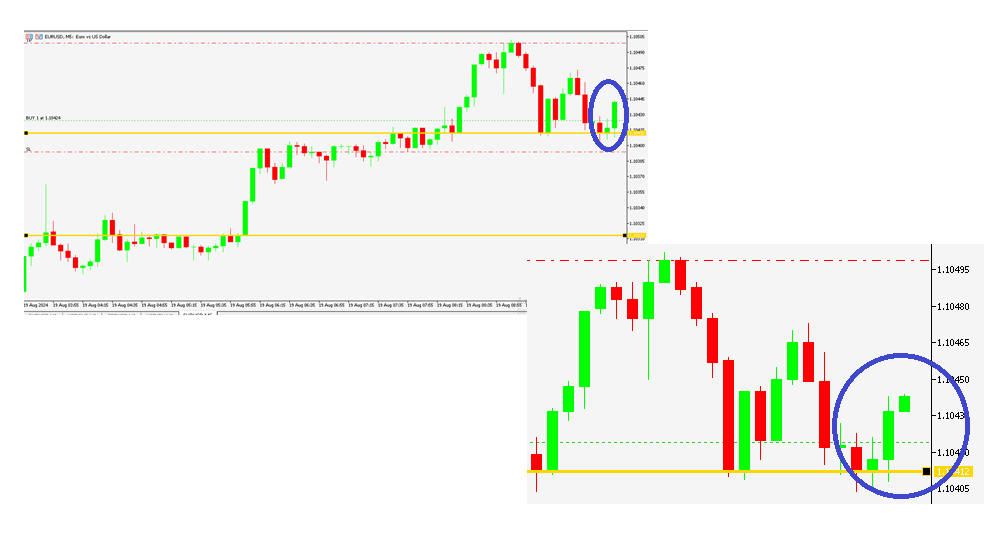
Price has bounced off the support line and is now heading upwards

Y
@yokoyi - 1 year ago
Quoted - yokoyi

Price has bounced off the support line and is now heading upwards

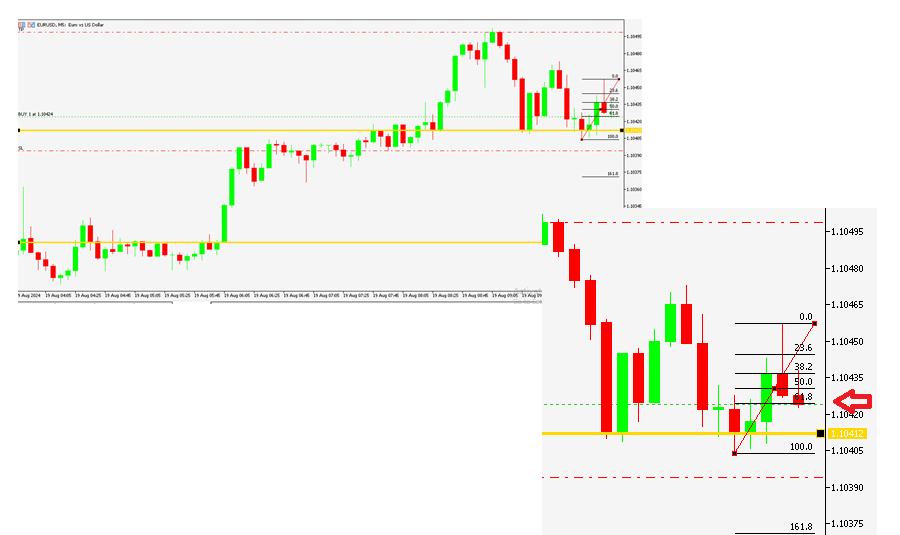
Again I see some downward movement but is this a downward trend or a temporary pullback?

TO answer this question i invoke the Fibonacci Retracement Tool & what does it show?

It shows the downward movement is reversing around the 60% level which means its a retracement(its going to bounce back up)

Y
@yokoyi - 1 year ago
Quoted - yokoyi

Again I see some downward movement but is this a downward trend or a temporary pullback?

TO answer this question i invoke the Fibonacci Retracement Tool & what does it show?

It shows the downward movement is reversing around the 60% level which means its a retracement(its going to bounce back up)

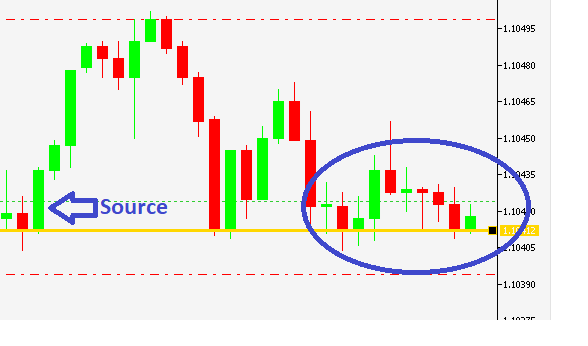
Our support line is still holding strong as price cannot seem to break past it.

The source of this support line is the big green candle to the left. I used this candle as the source to draw the support line because its a big green candle with no wick.

The absence of a wick shows buyers were comfortable with that price

Y
@yokoyi - 1 year ago
Quoted - yokoyi

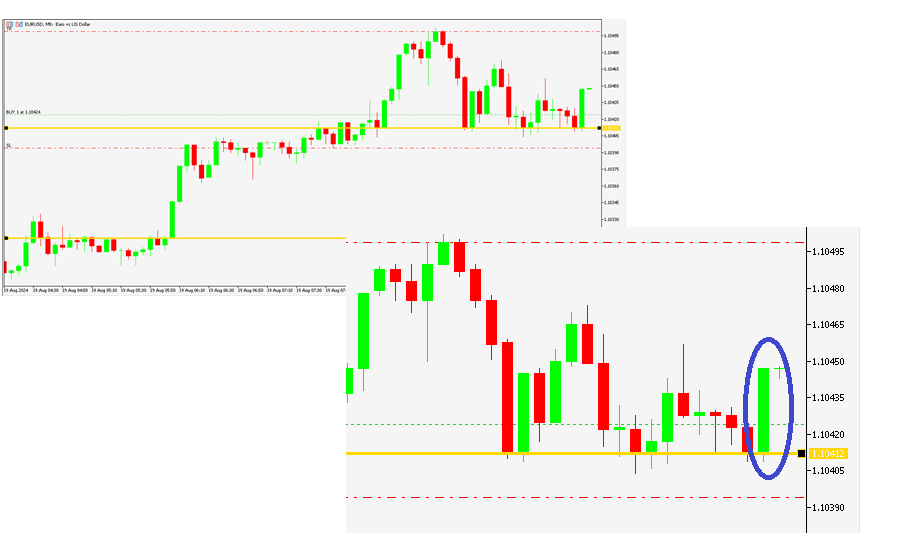
We see sudden upward movement again

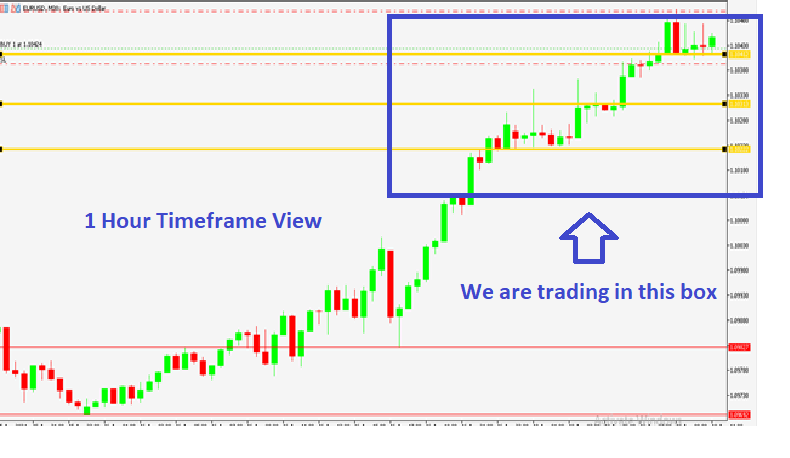
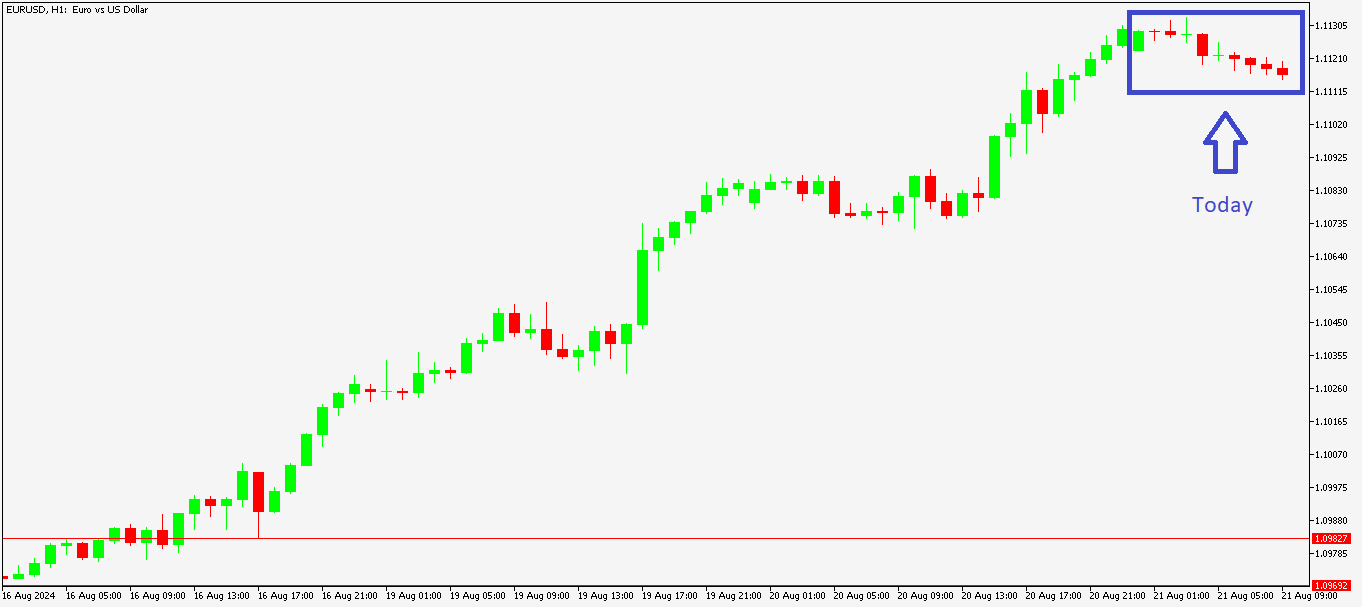
Let us zoom out and see the charts from the 1 Hour Timeframe.

this will help us get a Birdseye view of where the general market is going

Y
@yokoyi - 1 year ago
Quoted - yokoyi

Let us zoom out and see the charts from the 1 Hour Timeframe.

this will help us get a Birdseye view of where the general market is going

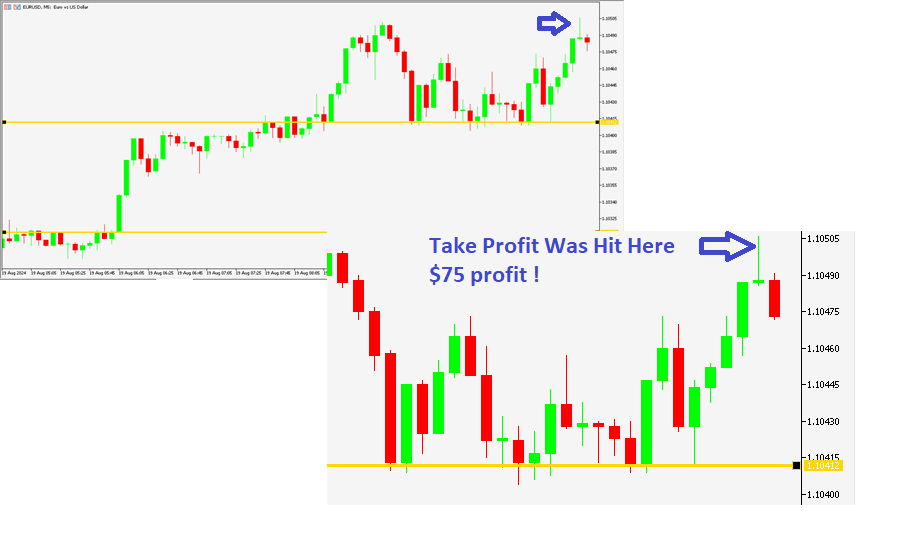
$75 Profit

My Take Profit has been hit as price touched the 1.10499 mark.

I made a $75 profit.

Lessons learnt: I was able to pick a good support level that price was unable to break through.

Every time price got to this level, it bounced back up.

I also had help from the Fibonacci Retracement tool. it helped me to know that certain downward movements were temporary and not trend reversals

Y
@yokoyi - 1 year ago
Quoted - yokoyi

$75 Profit

My Take Profit has been hit as price touched the 1.10499 mark.

I made a $75 profit.

Lessons learnt: I was able to pick a good support level that price was unable to break through.

Every time price got to this level, it bounced back up.

I also had help from the Fibonacci Retracement tool. it helped me to know that certain downward movements were temporary and not trend reversals

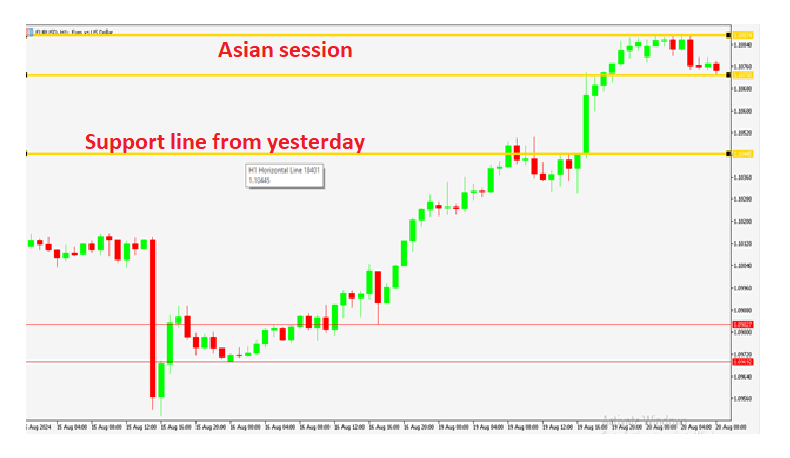
Good morning guys.

I start today by drawing out a map and plotting strategy.

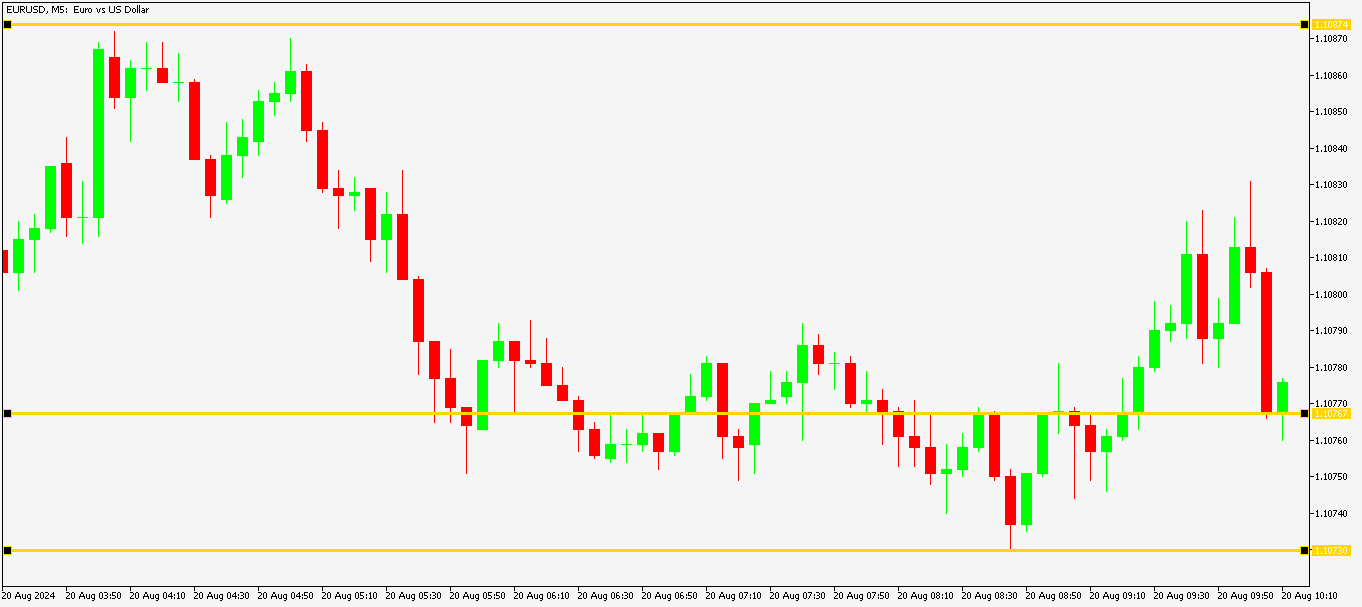
I have located and drawn a support line under the lowest price during the Asian session

Resistance line has also been drawn at the highest price reached during today's Asian session.

I retained the support line from yesterday because it was really string and price barely broke through it.

SO lets look for entry signals now!!!

Y
@yokoyi - 1 year ago
Quoted - yokoyi

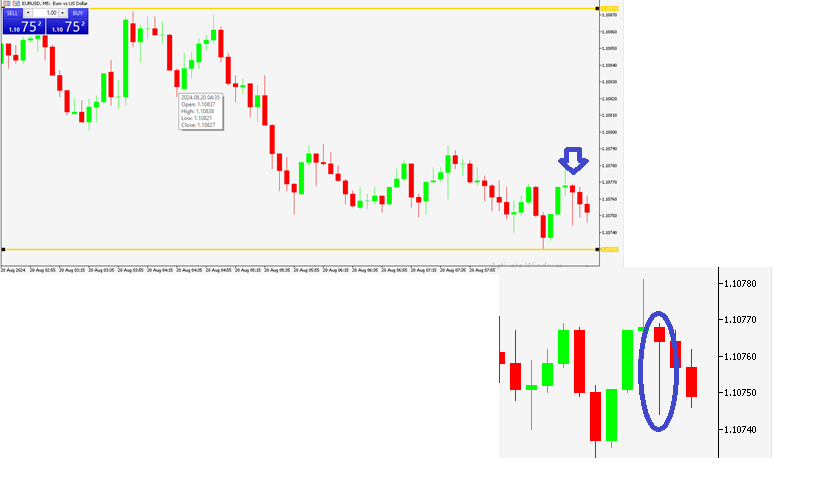
I've spotted a bearish red hammer candlestick pattern which means a downward trend could be starting so I take this as a signal to enter the market with a short position

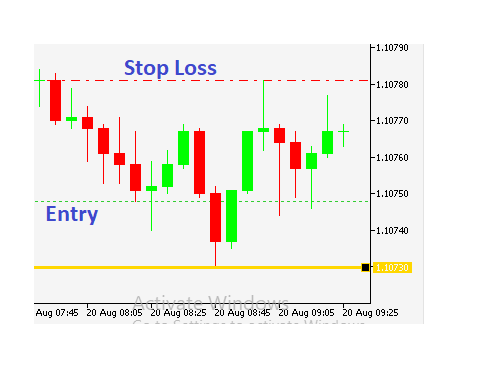
I have placed my Stop Loss at the opening price of a big red candle (the fist one on the left)

Why? because this candle has no upper wick signifying sellers were comfortable with this price

Y
@yokoyi - 1 year ago
Quoted - yokoyi

My Stop Loss has been hit. That was not a very quality trade. I will go ahead and look fr another point to enter the market.

To enter the market again I take the point where my Stop Loss was hit and draw a line to mark it. This line will serve as support.

I use this point because it is a big red candle so its an area of value.

When it acts as support it means i don't expect price to fall through it so i expect price to bounce back up when it hits the support line.

But anything could happen this is just an expectation.

I have placed a long order for the following reasons:

1: I spotted a bearish hammer (which confirms the ongoing upward trend)

2. There are option orders stacked around 1.1100 so this price could act like a magnet

Y
@yokoyi - 1 year ago
Quoted - yokoyi

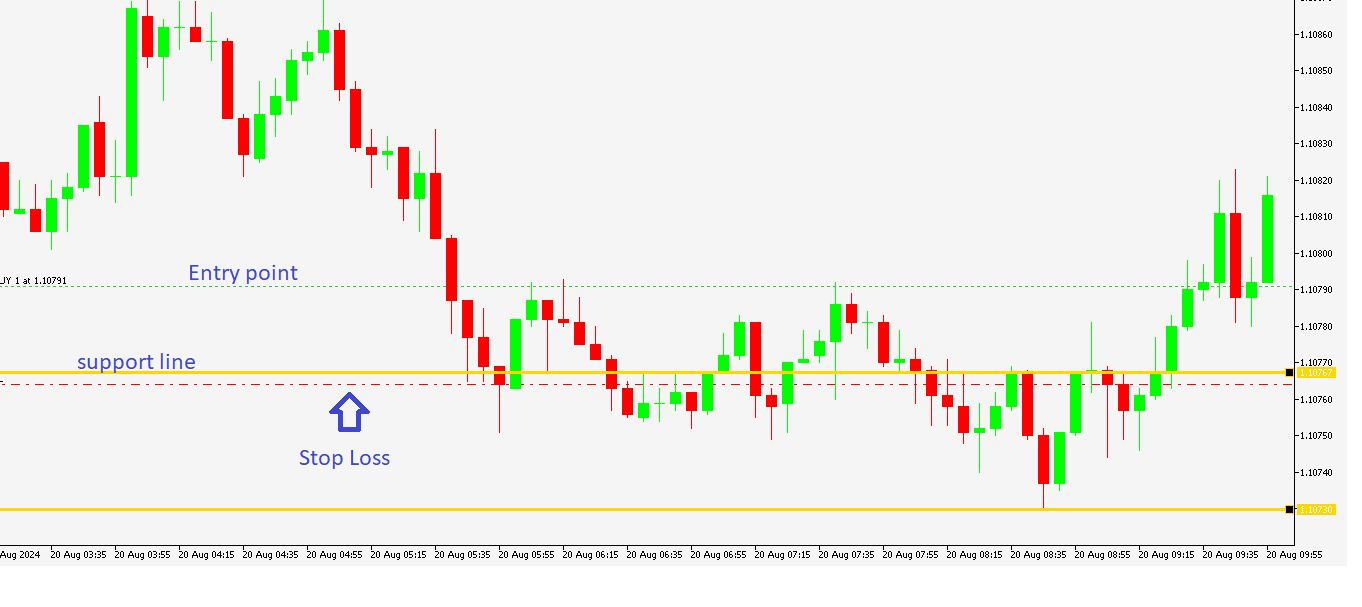
I protect my position by setting a Stop Loss below the support line

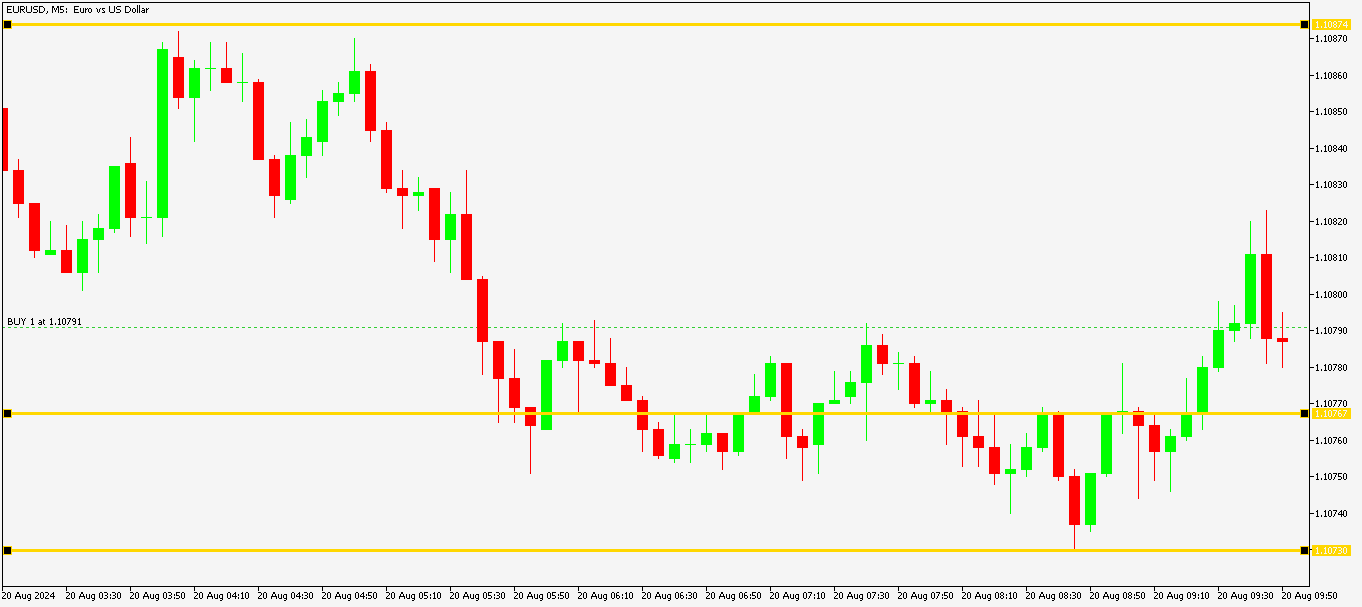
Price is currently testing the support line. I hope it bounces off, if not my Stop Loss is going to be hit.

Y
@yokoyi - 1 year ago
Quoted - yokoyi

Price is currently testing the support line. I hope it bounces off, if not my Stop Loss is going to be hit.

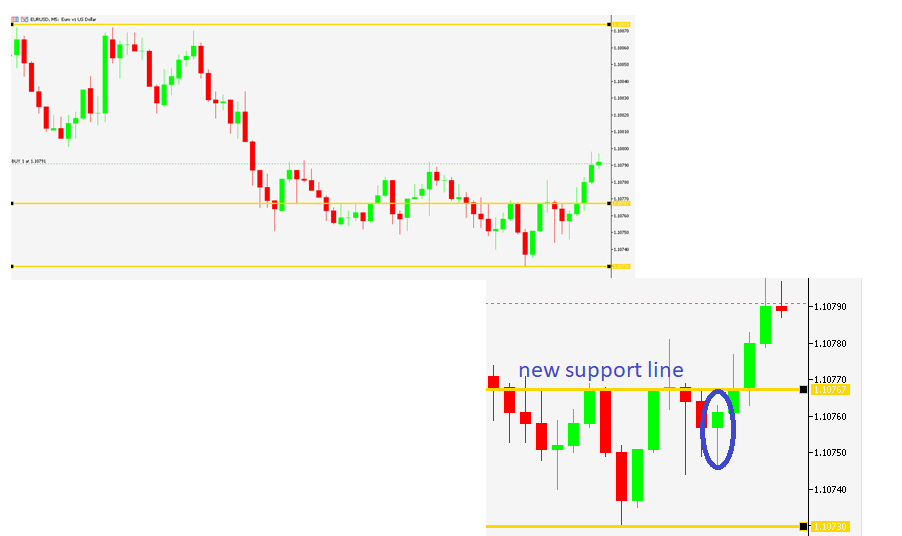
Price has bounced off our support line but has also hit the Stop Loss. bad day at the office.

However you can see that the support line is holding off because [price has bounced back upward

Disclaimer:

At MyTradingLand.com, we connect you with forex brokers and provide a community for traders. While we offer valuable information and resources, please note that we are not financial advisors and cannot provide personalized financial advice. Always conduct your own research and invest responsibly.

Community Guidelines: The MyTradingLand.com community is designed as a resource for forex traders, promoting respectful and constructive discussions. We reserve the right to remove any content that is misleading, abusive, or violates our terms of service.

Broker Information: While we may receive commissions or advertising income from some of the brokers listed, this does not imply an endorsement of any broker, nor does it affect our review process. Our evaluations are based solely on objective criteria and user feedback.

Always verify the regulatory status of any broker with your local financial authority, along with their terms and privacy policies, before engaging with them. It is crucial to conduct thorough research to ensure that you are making informed decisions.

Risk Warning: At MyTradingLand.com, we strive to provide accurate information; however, the forex market is highly volatile and can change rapidly. It is essential to verify any information before making investment decisions.

Please be aware that trading in forex involves substantial risk, and it is possible to lose more than your trading equity/investment capital. 70-90% of retail CFD traders incur losses in their trading activities as per information from various brokers.

You are solely responsible for your use of MyTradingLand.com and any trading decisions you make. We encourage all users to educate themselves thoroughly about forex trading and to consider seeking advice from qualified financial professionals.

Advertising Disclosure: We may earn commissions from recommended brokers, but our reviews are independent (not influenced by potential earnings). Sponsored content is clearly marked and doesn't reflect our views.

©2026 ©2025 All rights reserved Mytradingland.com