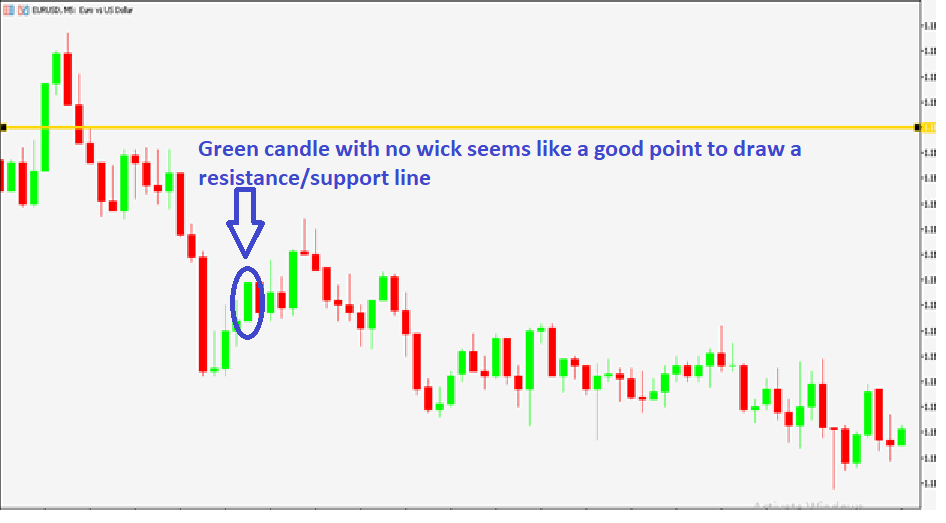
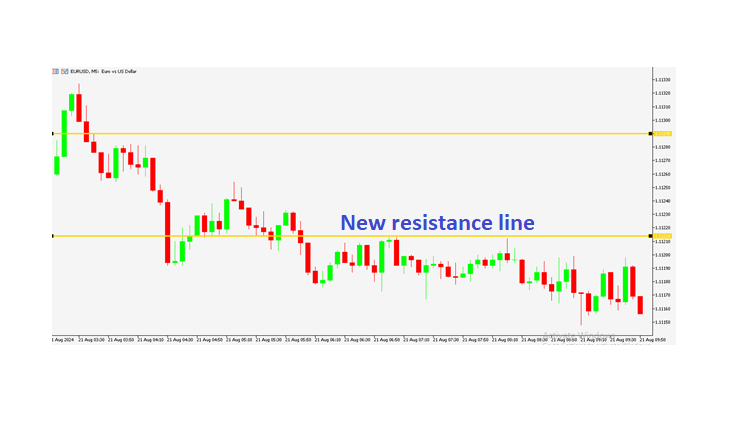
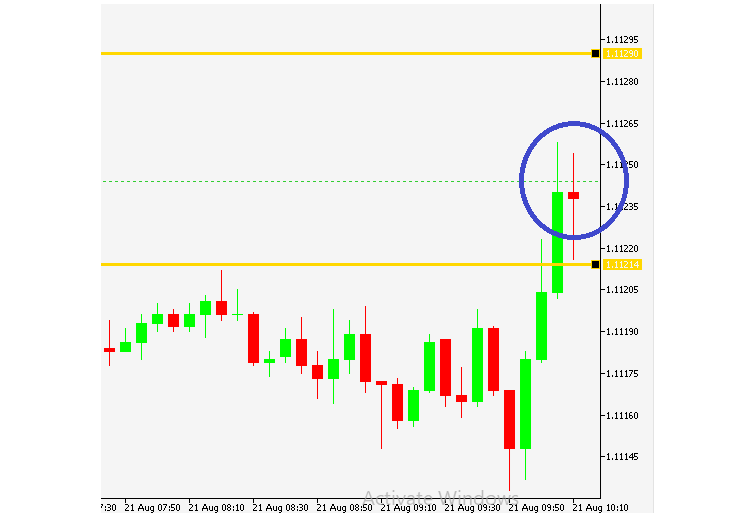
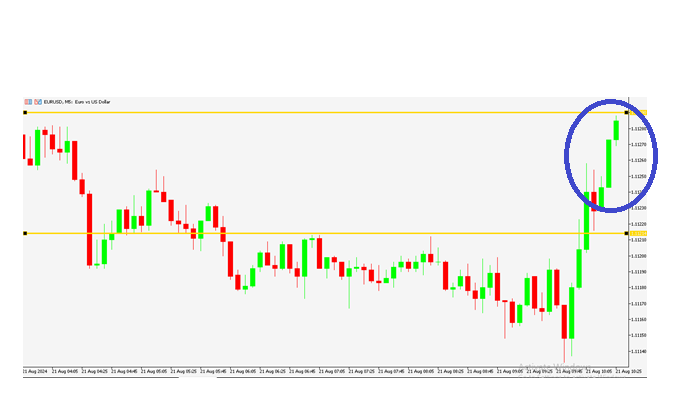
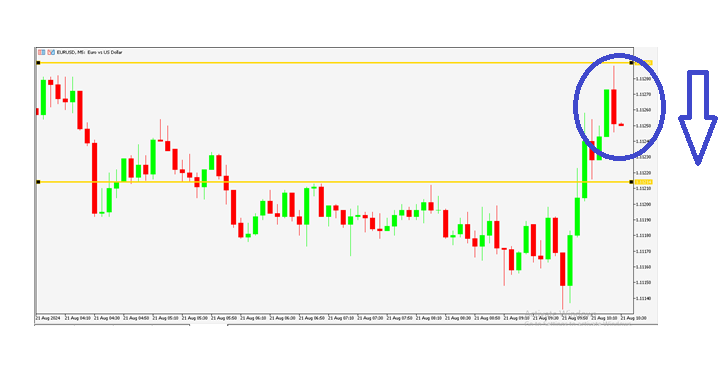
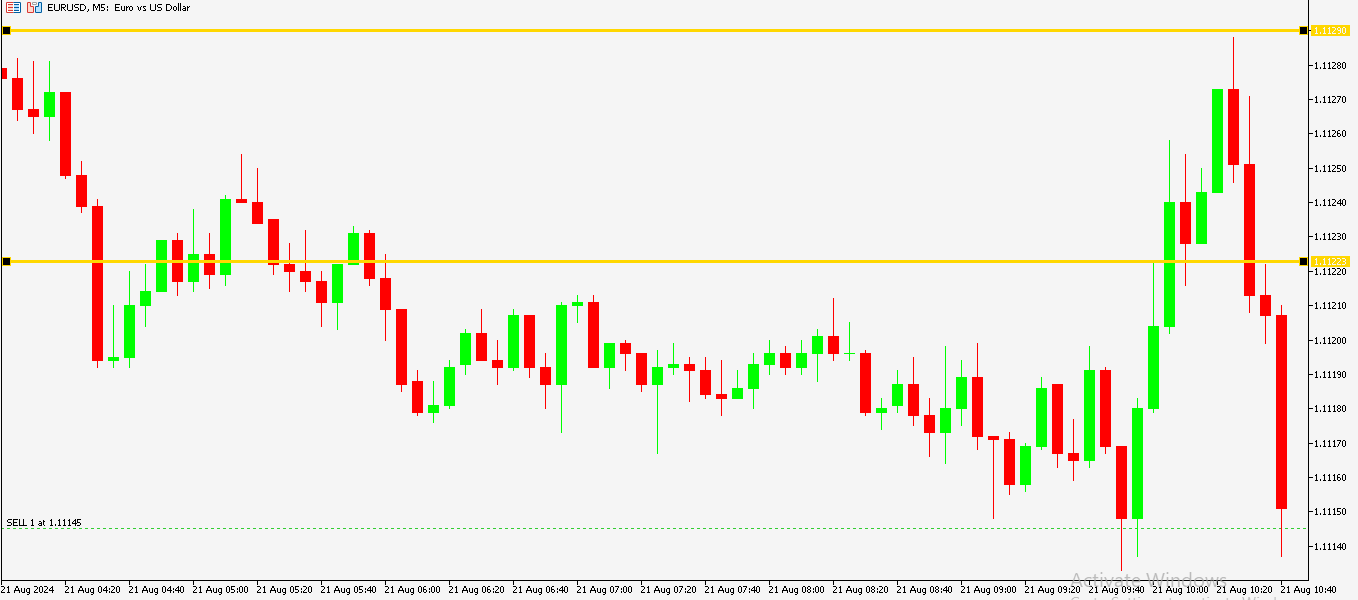
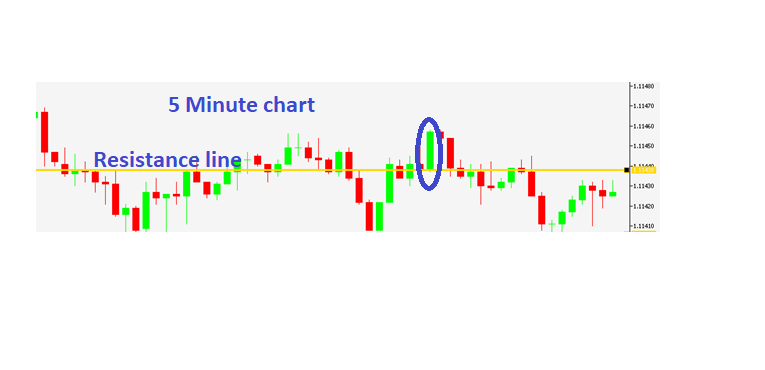
On the 5 Minute chart I have spotted a green candle with no upper/lower wick meaning buyers were comfortable with this price.
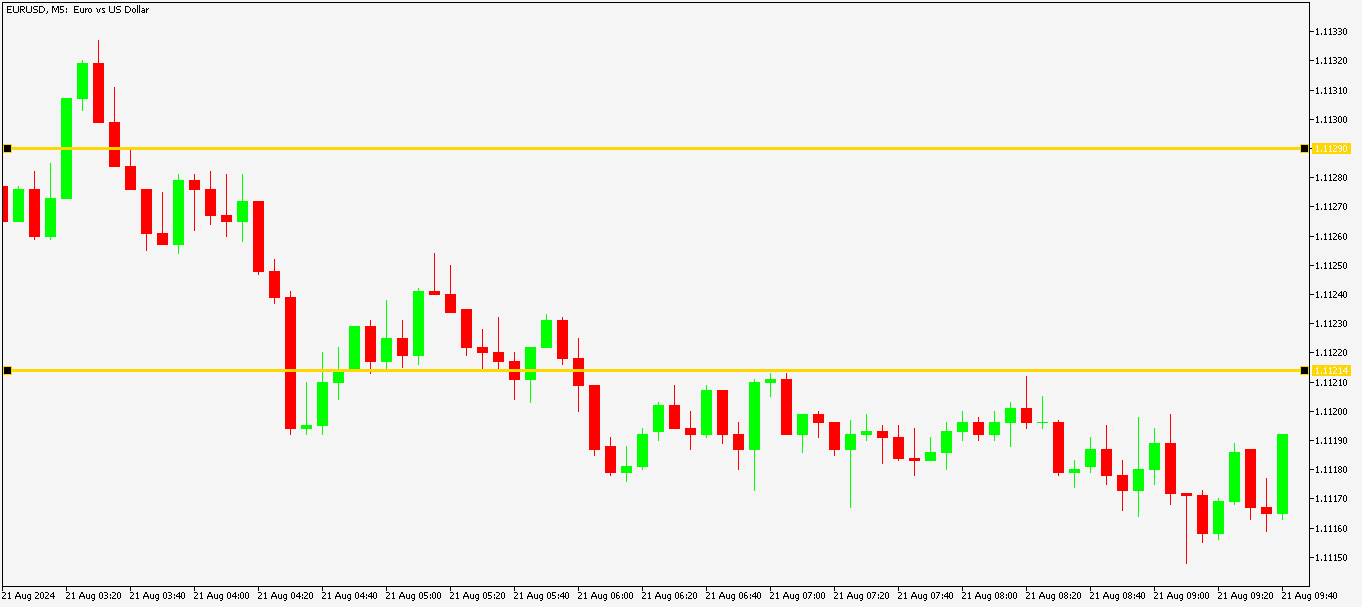
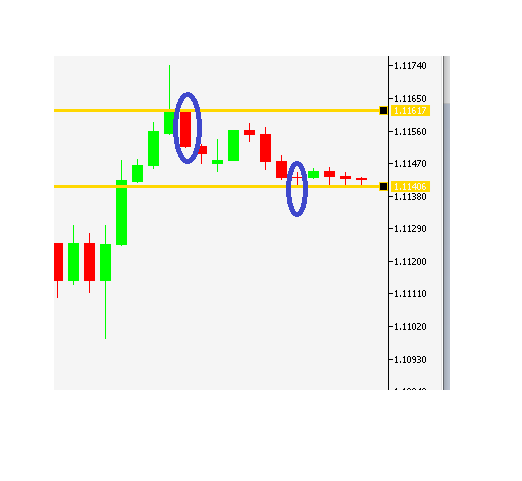
I have drawn a new yellow resistance/support line to mark this level
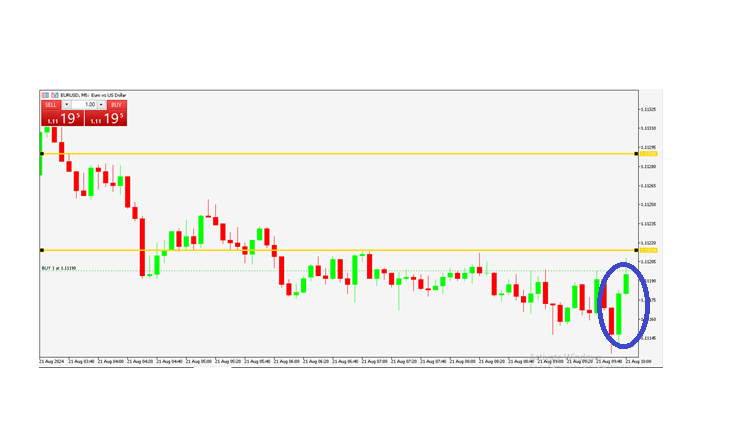
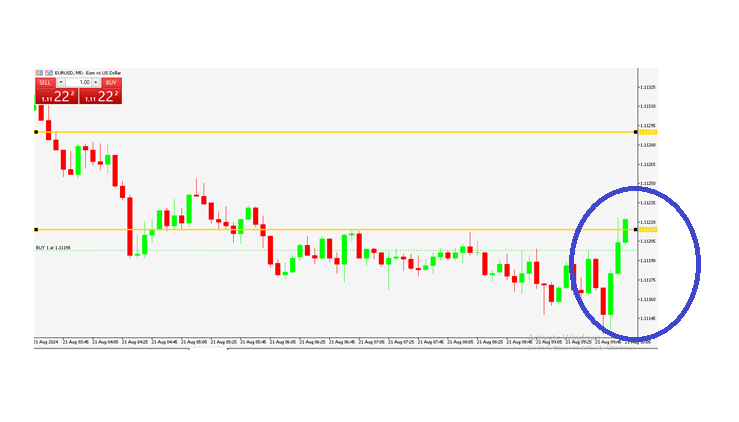
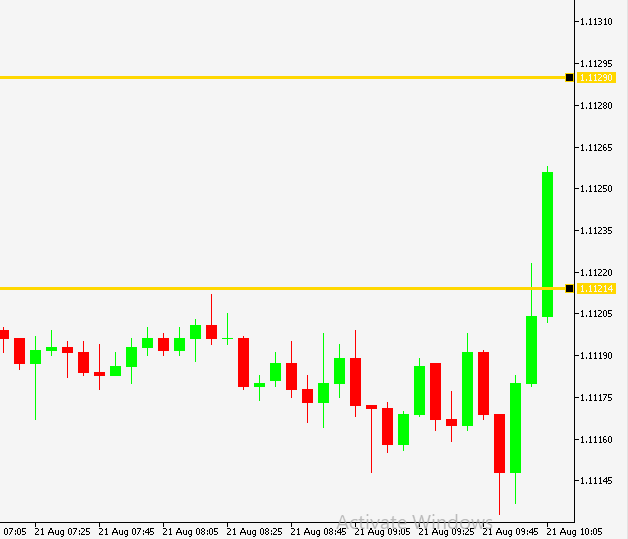
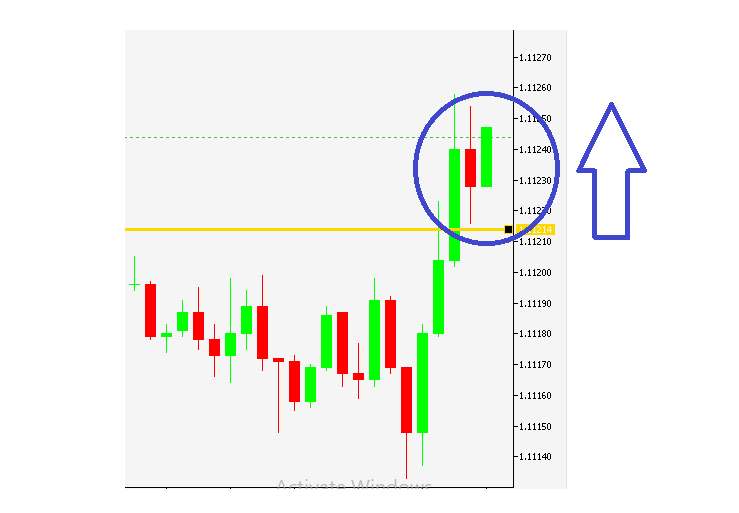
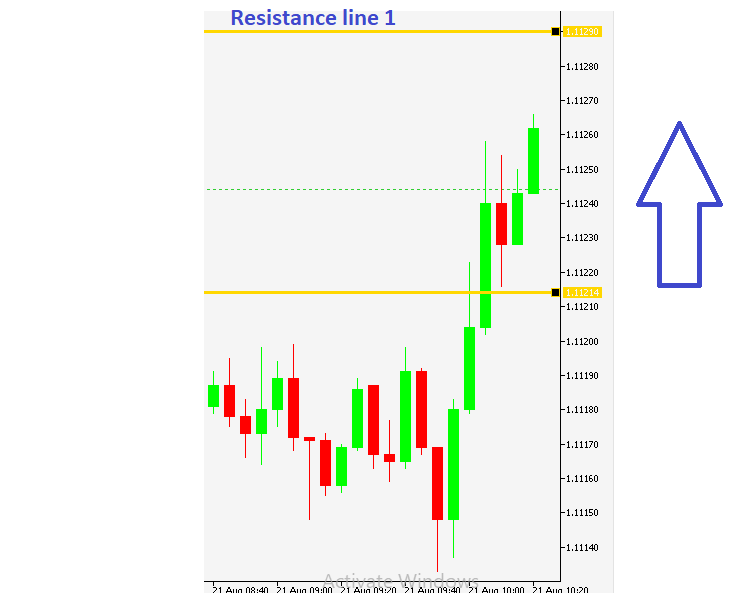
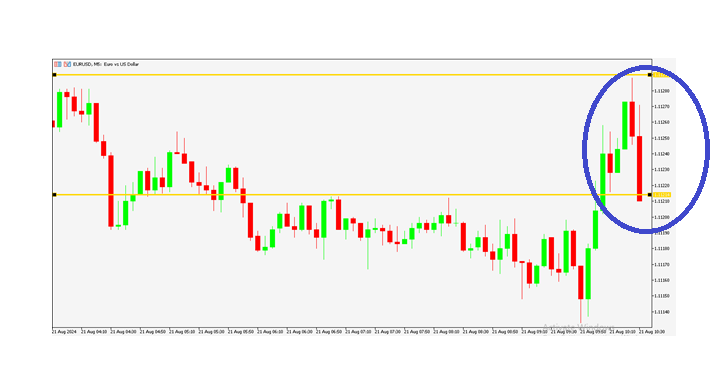
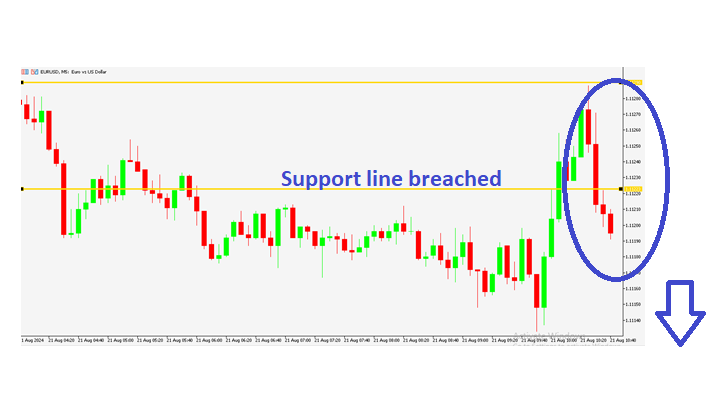
Now notice how price interacts with this new résistance/support level
After price breached this line and moved downwards, it is having a problem breaking the line and going upwards so the line is acting as a resistance ceiling.