NASDAQ weekly Projections

N
@nsg_usd - 20 hours ago

NAS-100 D1 PROJECTION

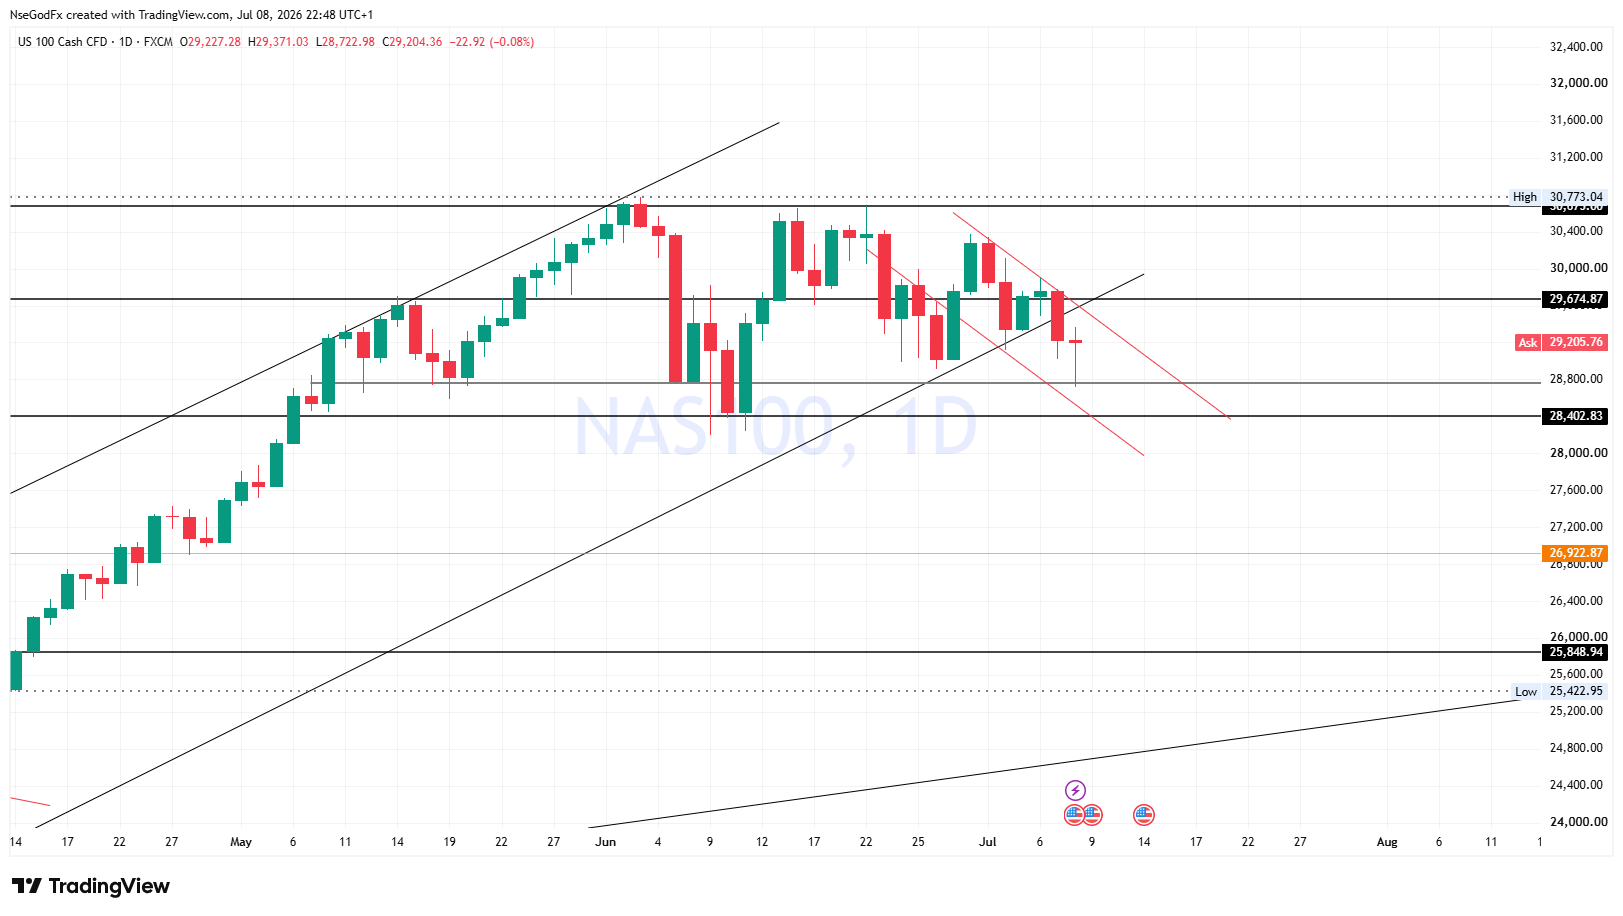
Price has broken the trend support (lower channel), but reacted strongly at the 28,761 H-support level, forming a daily pinbar. A bearish trajectory Channel has been formed, which further confirms price intentions to drop further on the downside.

N
@nsg_usd - 9 hours ago

NAS 100 DAILY PROJECTION

DATE: Thursday 9th July 2026.
TREND: Range

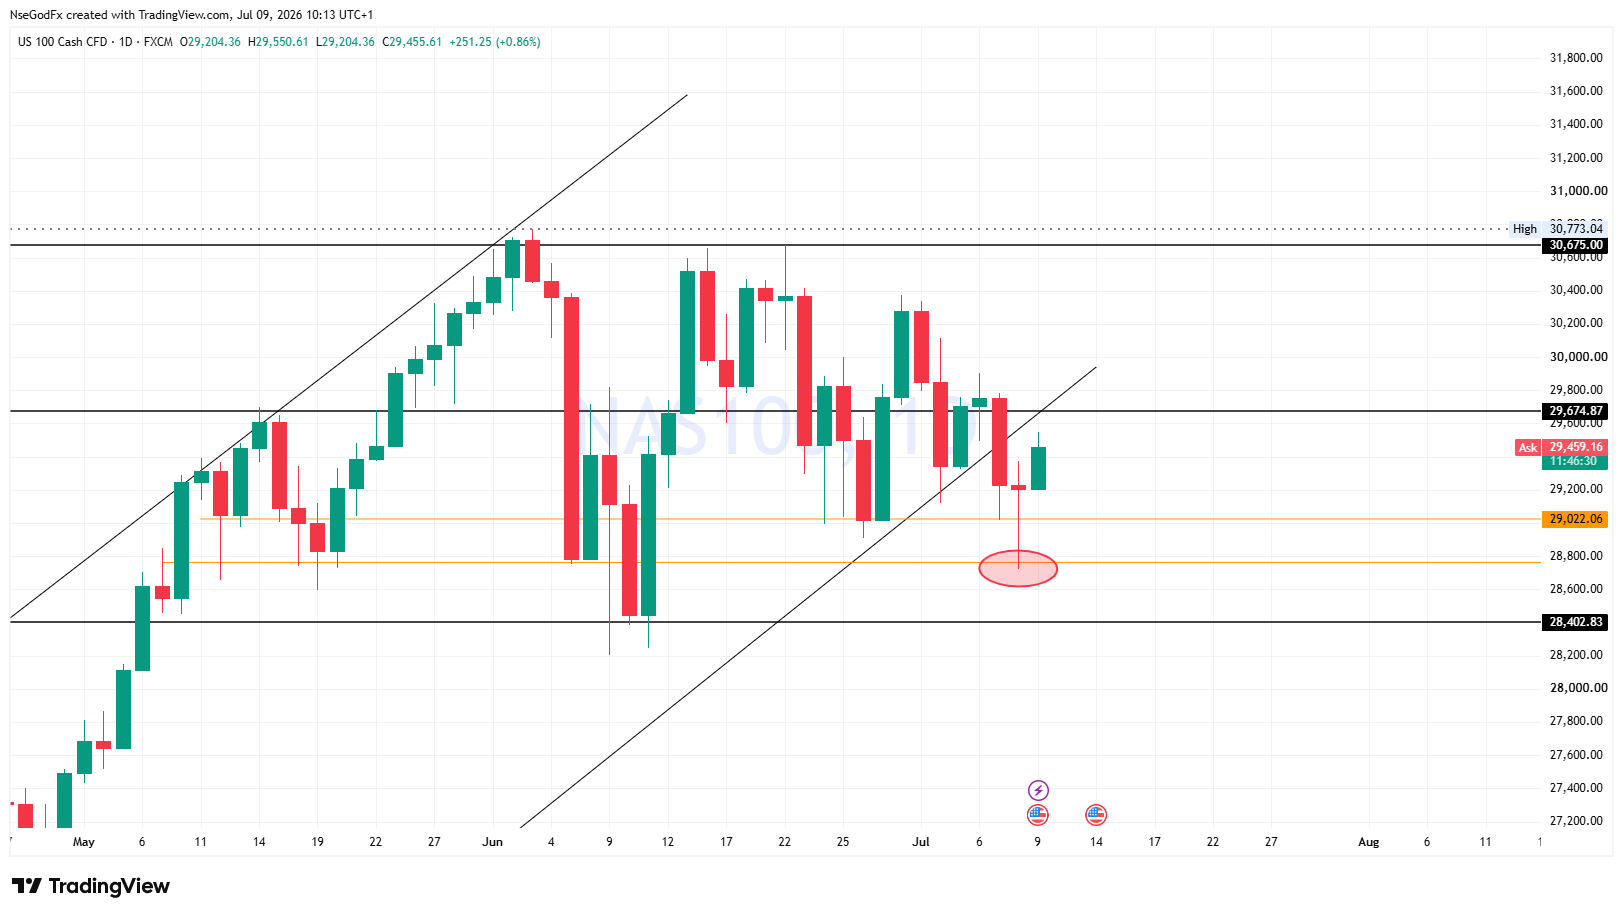
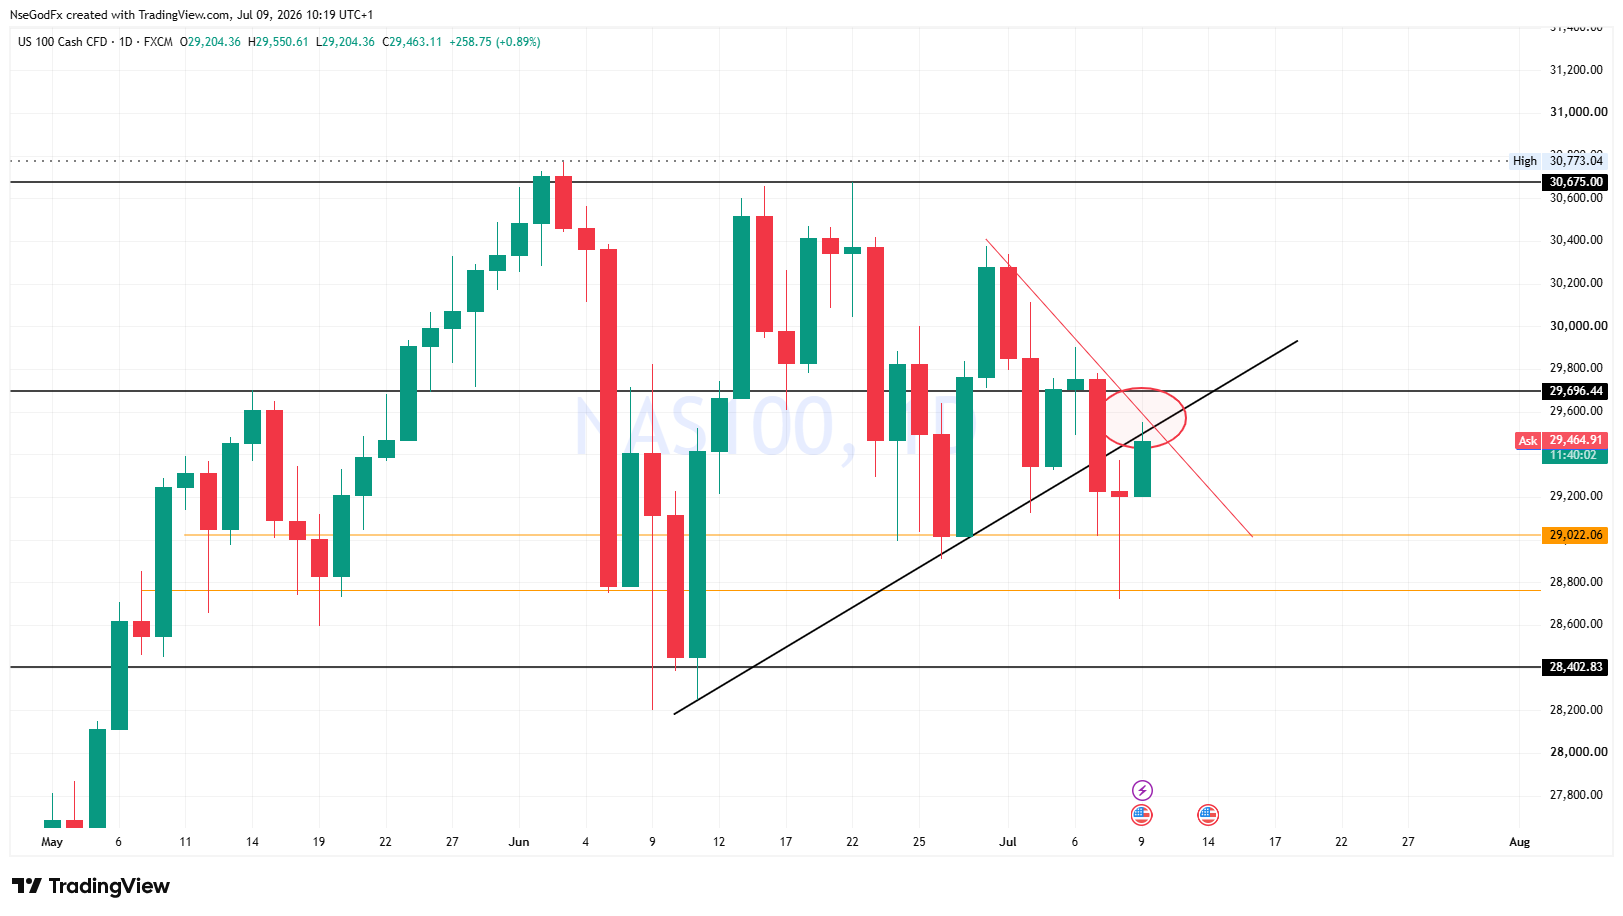
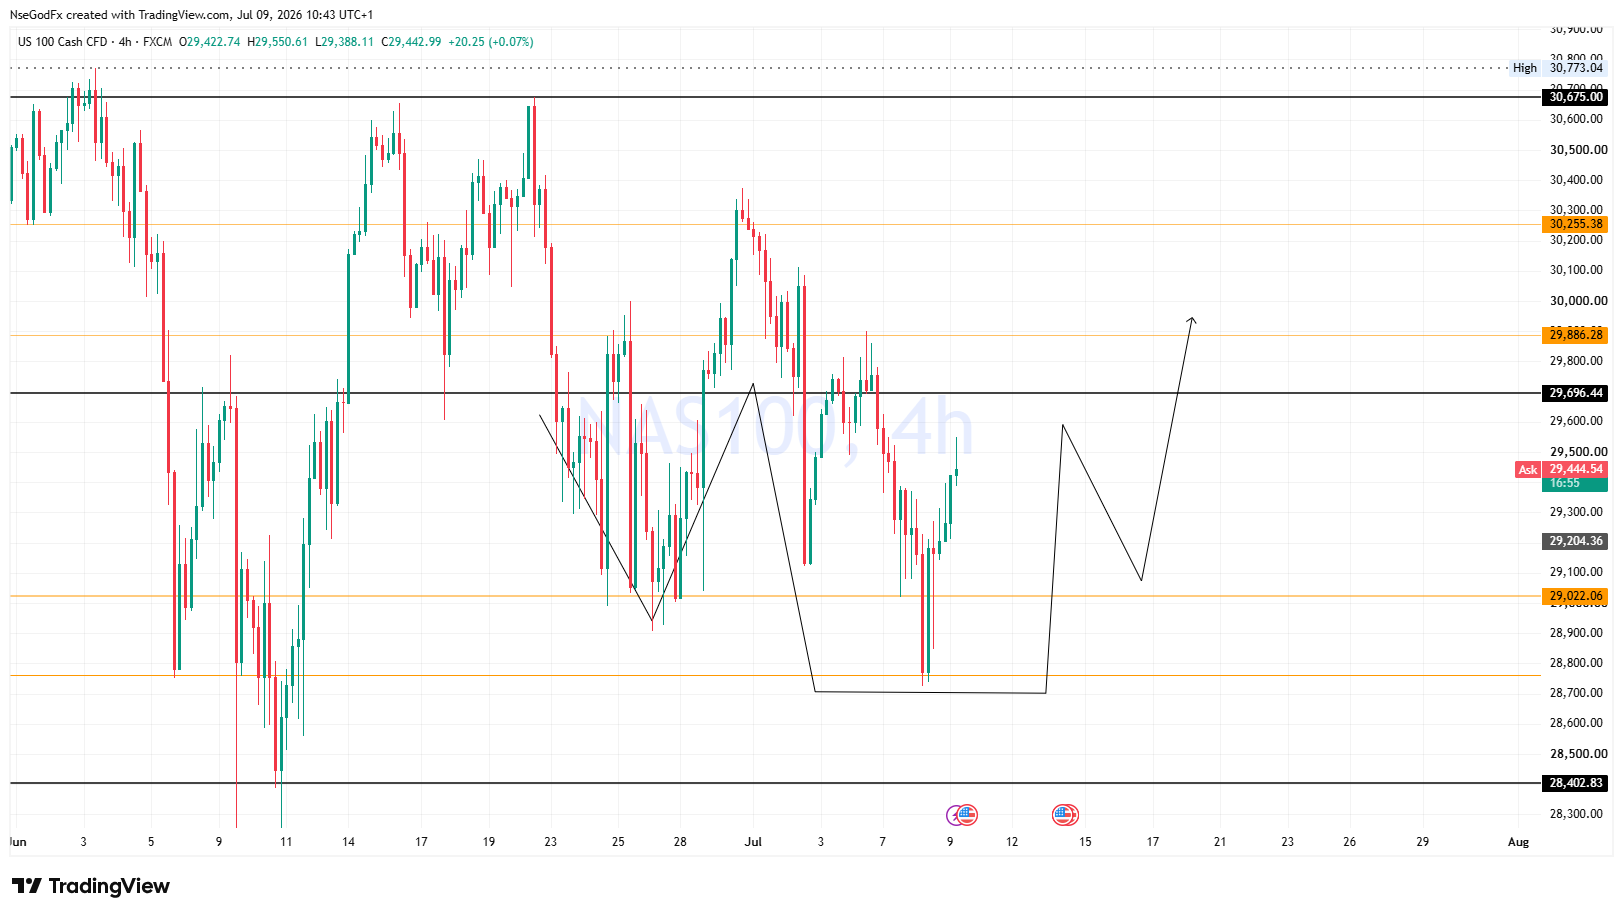
TECHNICAL OUTLOOK: Despite the strong sells we've witnessed on Nasdaq for the past 2 days, price has been unable to break below 29000. It traded below the internal suppport region yesterday (wednesday), but rejected strongly @ 28,722 H-support and closed back above 29000 price region.

A
@asuquokelvin - 9 hours ago
Quoted - asuquokelvin

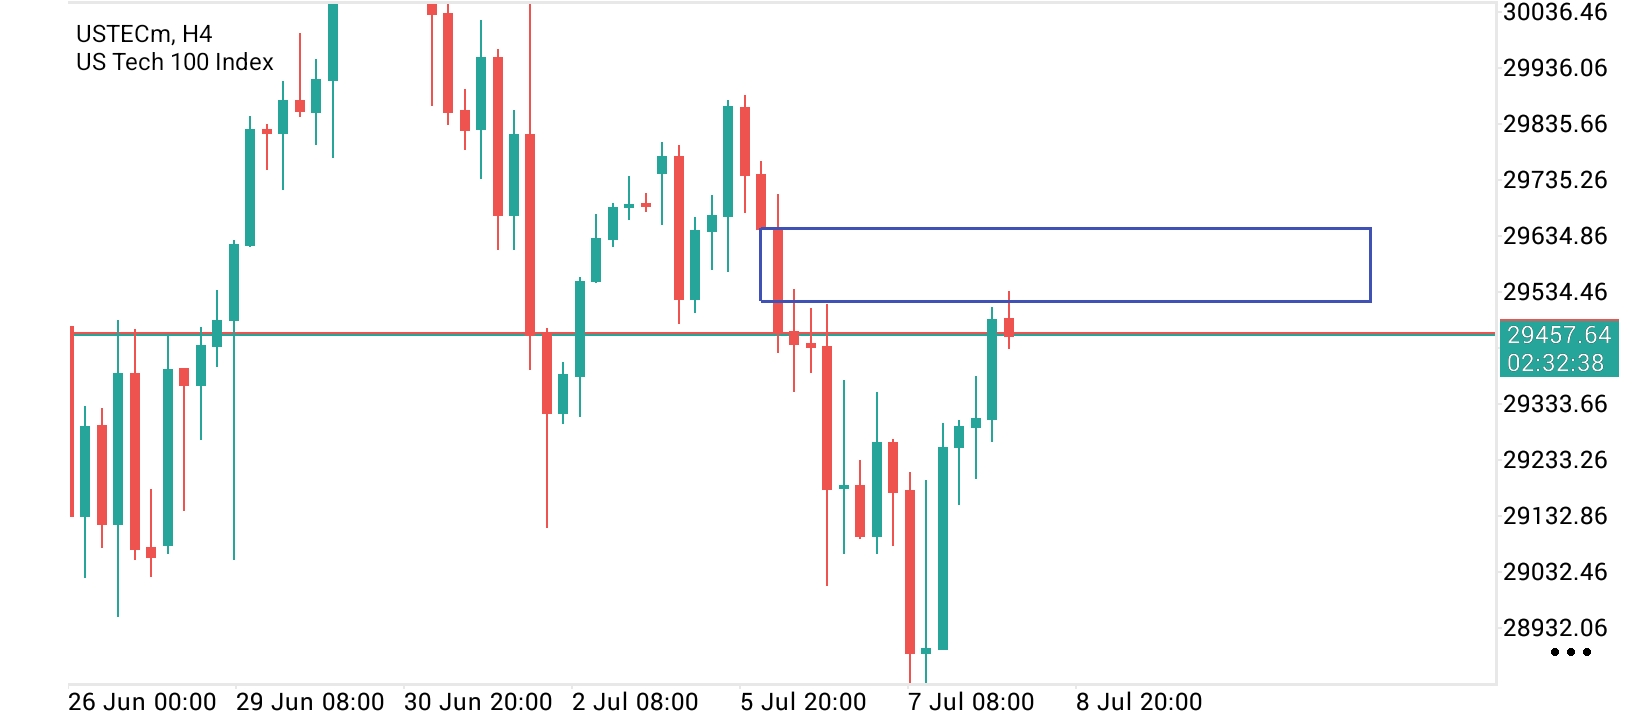
I will be considering reactions at that box before 5pm to trade nas100

If you look at that box closely you will see that there's an fvg there so I will consider that level as my reaction zone

N
@nsg_usd - 8 hours ago
Quoted - nsg_usd

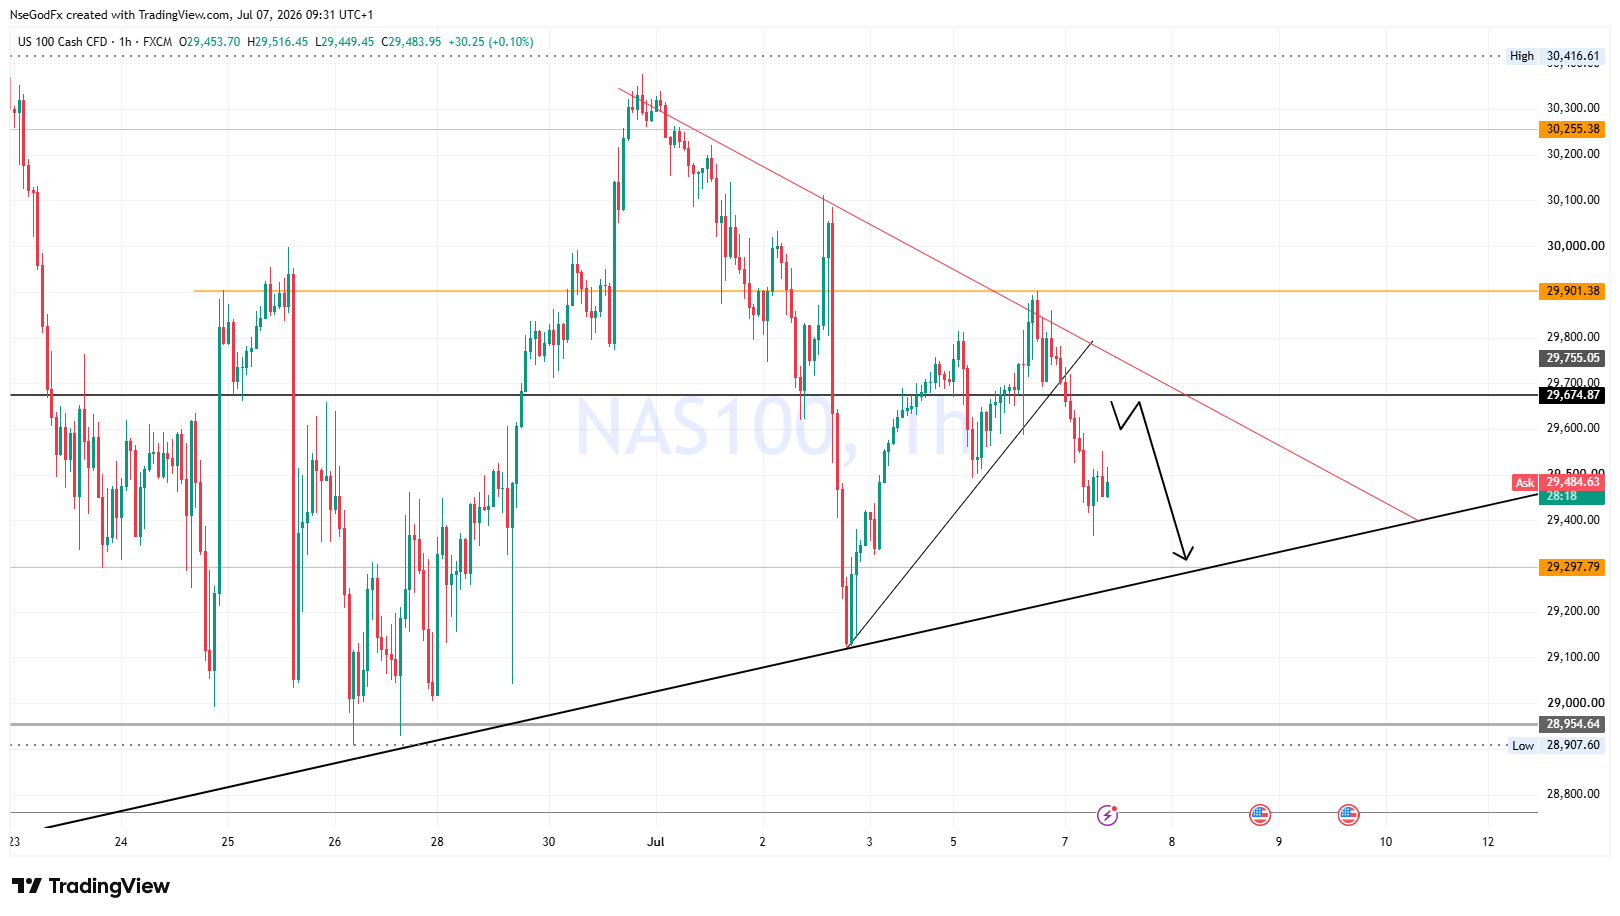
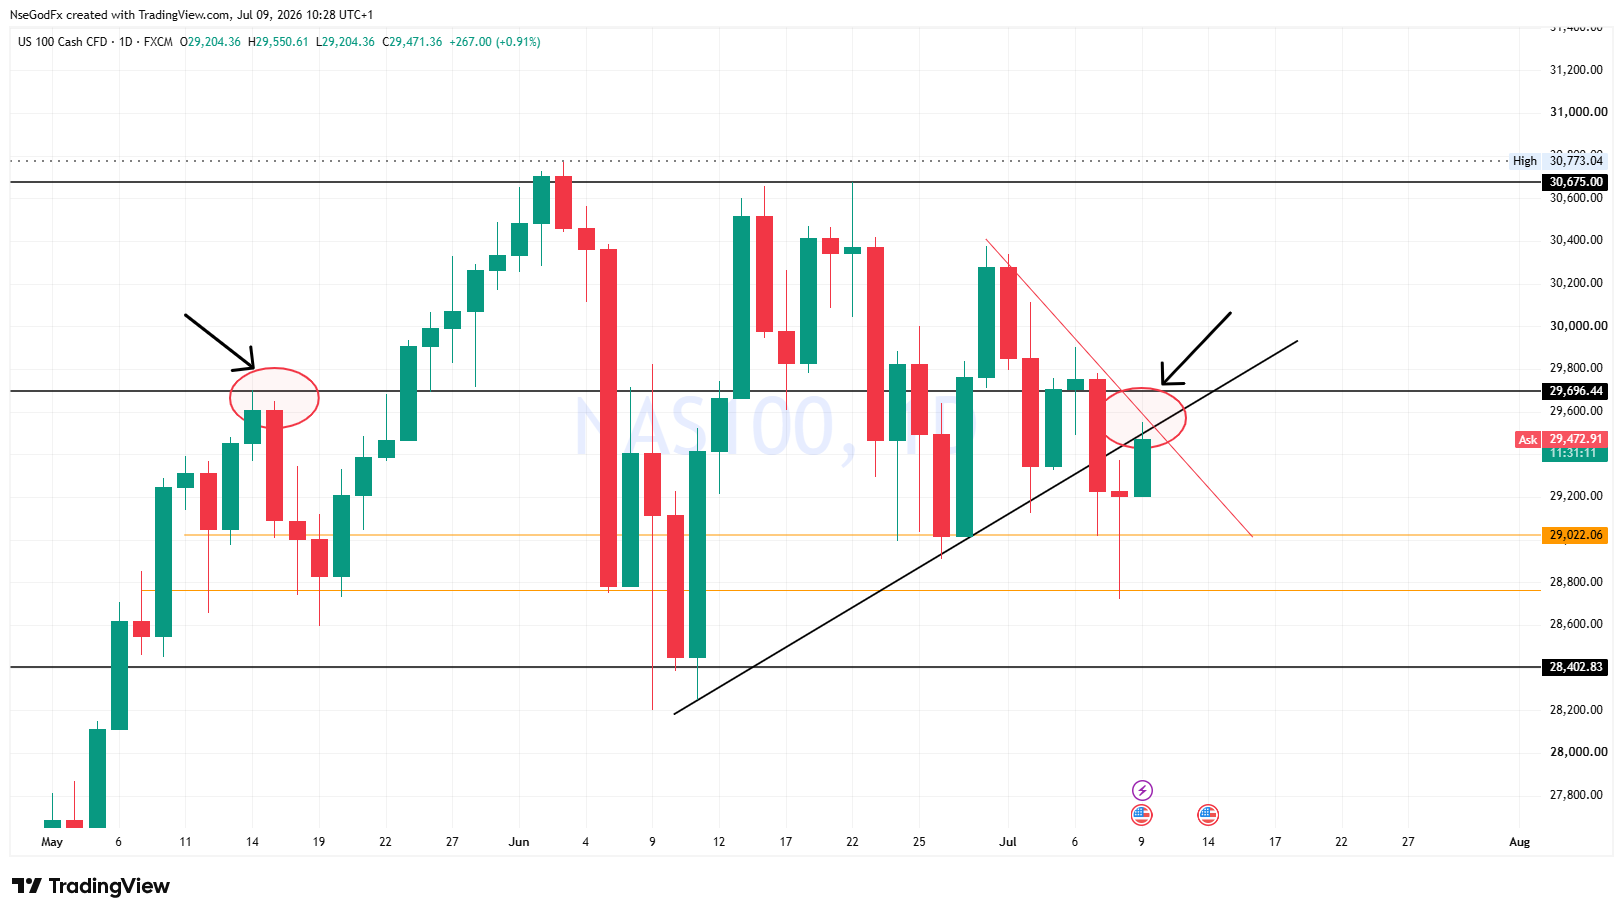
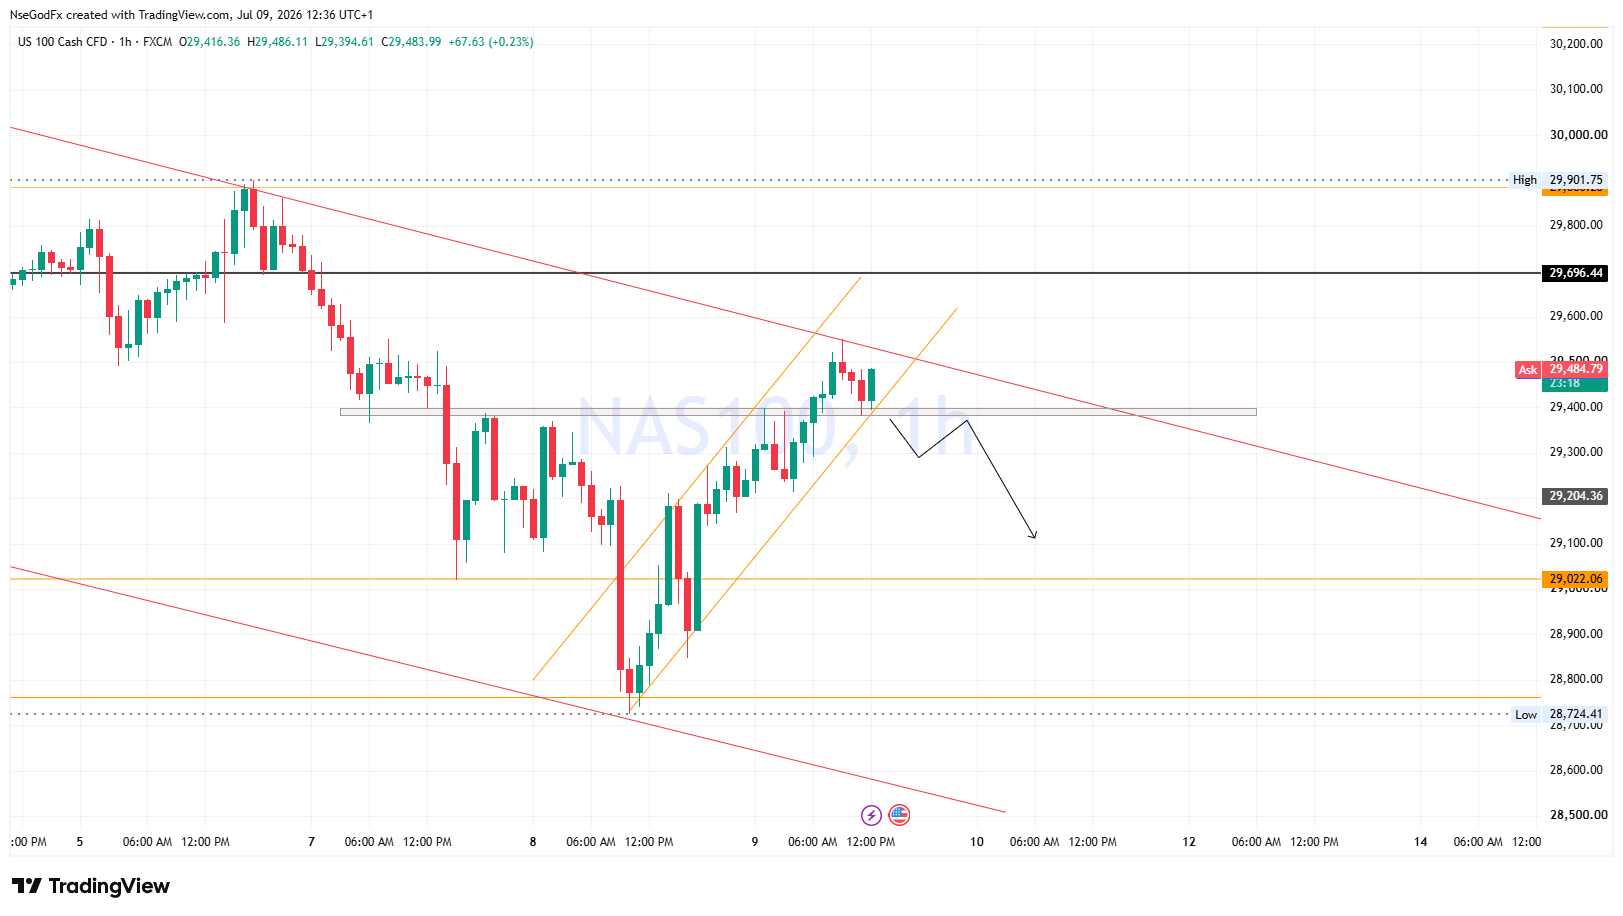
Nas 100- Price invalidated the Daily trendline support on Tuesday, and has rallied back for a retest for a possible sells back to the 29,000 H-support.

Nas 100- the retest confluences with an upper trendline resistance channel which conjoins near the 29600 Resistance price region which price sold from two months ago on Friday 15th May 2026. since May, Price keeps selling off around the price region every time it revisits as a resistance zone.

N
@nsg_usd - 8 hours ago
Quoted - israeljasspu

Nah I just forgot the pair since then

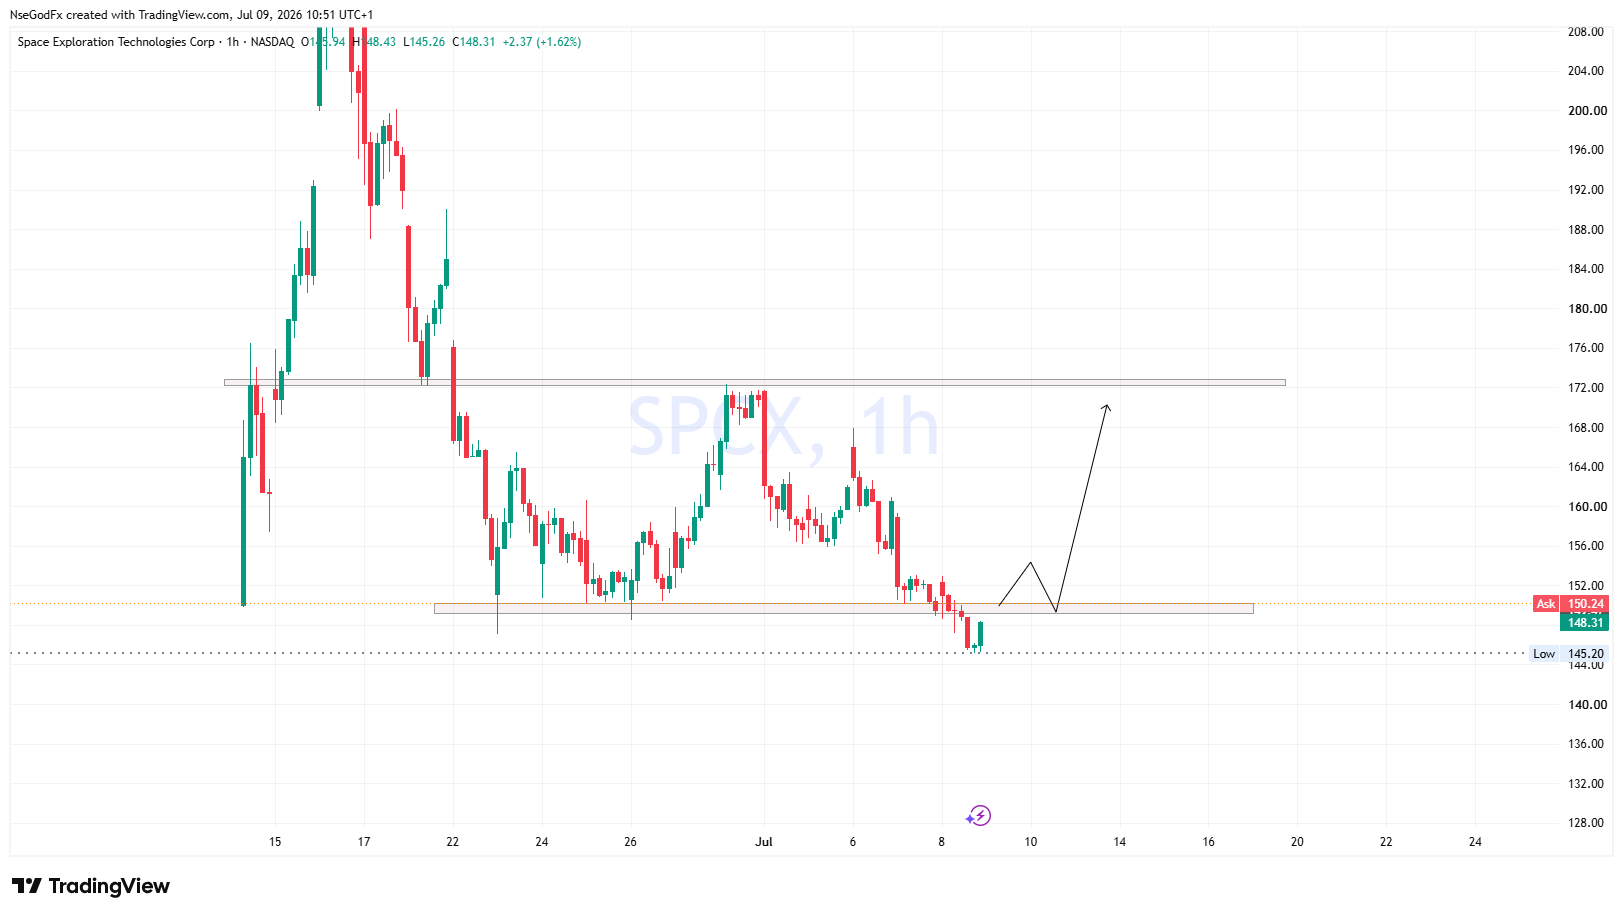
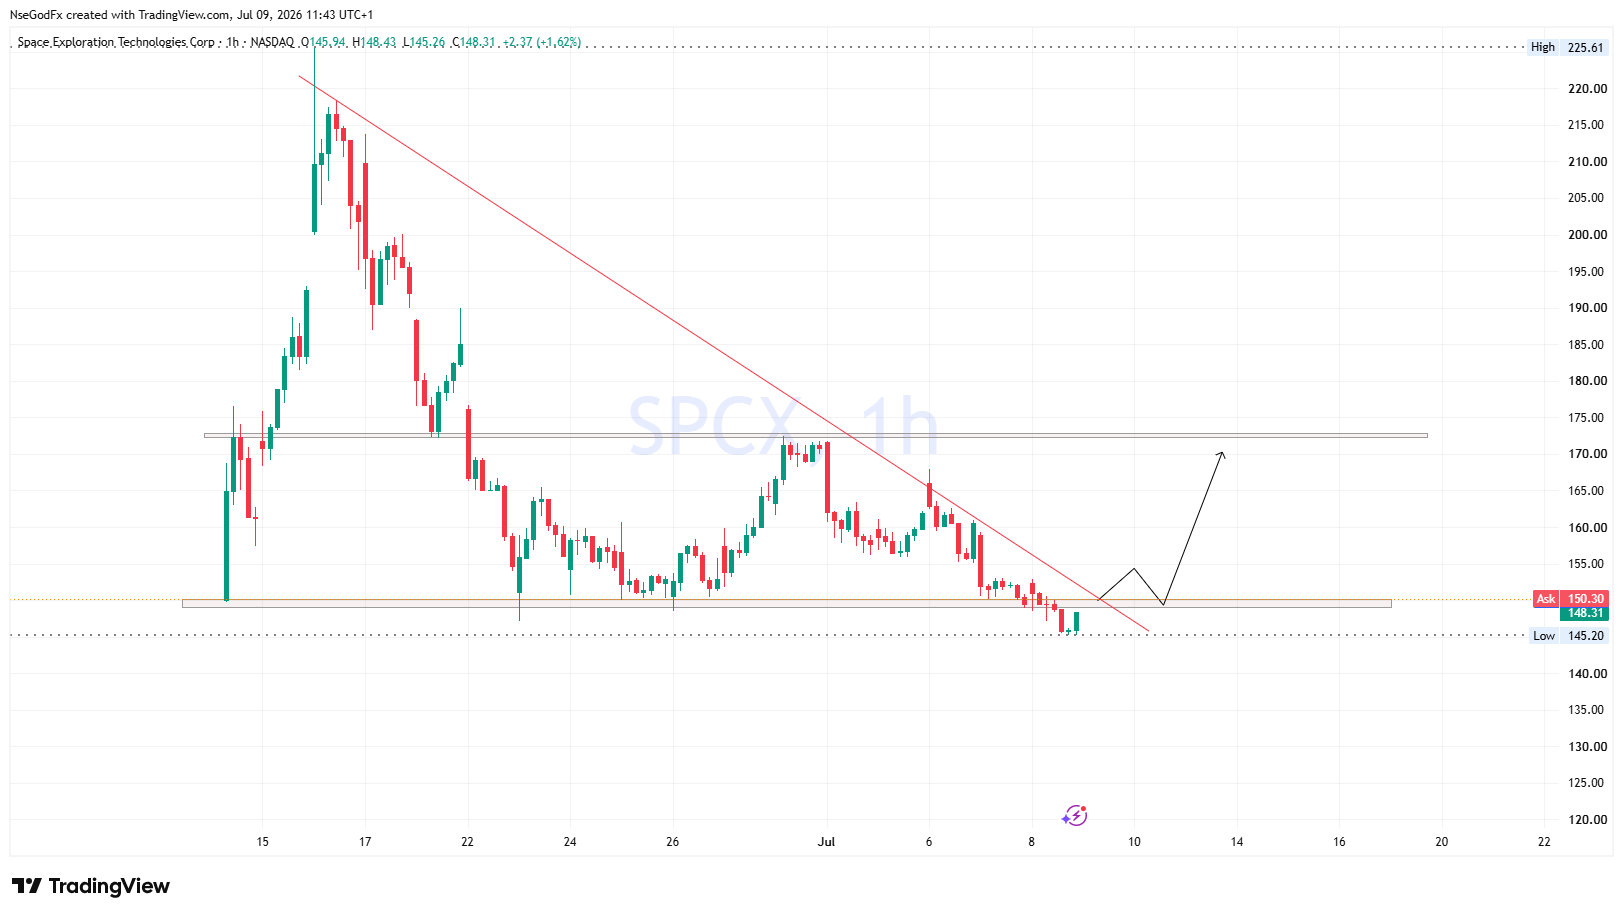
Oh. Okay. SpaceX shares price dipped down to 145 price level, and is buying back again. Technically, a break above the 150 price level, will result in a strong rally back to 170 price level.

A
@asuquokelvin - 8 hours ago
Quoted - nsg_usd

Oh. Okay. SpaceX shares price dipped down to 145 price level, and is buying back again. Technically, a break above the 150 price level, will result in a strong rally back to 170 price level.

150 is not really the strong resistance level to watch above 170 is what is to be considered and there is a weekly opening gap around there, above that gap gives a strong buy

N
@nsg_usd - 8 hours ago
Quoted - nsg_usd

NAS 100 DAILY PROJECTION

DATE: Thursday 9th July 2026.
TREND: Range

TECHNICAL OUTLOOK: Despite the strong sells we've witnessed on Nasdaq for the past 2 days, price has been unable to break below 29000. It traded below the internal suppport region yesterday (wednesday), but rejected strongly @ 28,722 H-support and closed back above 29000 price region.

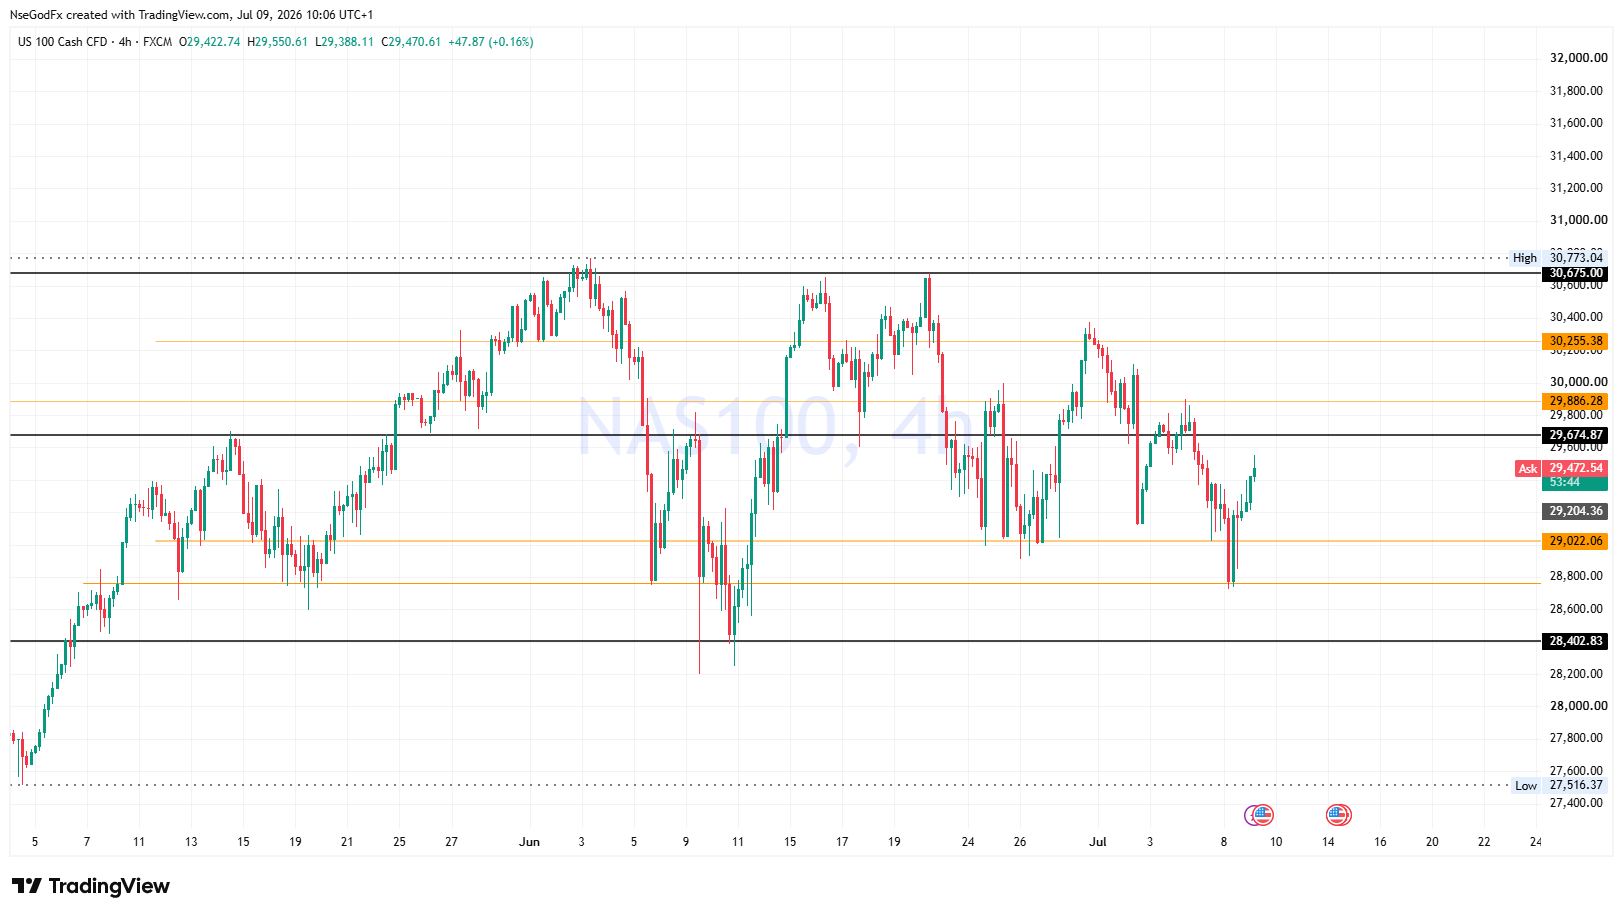
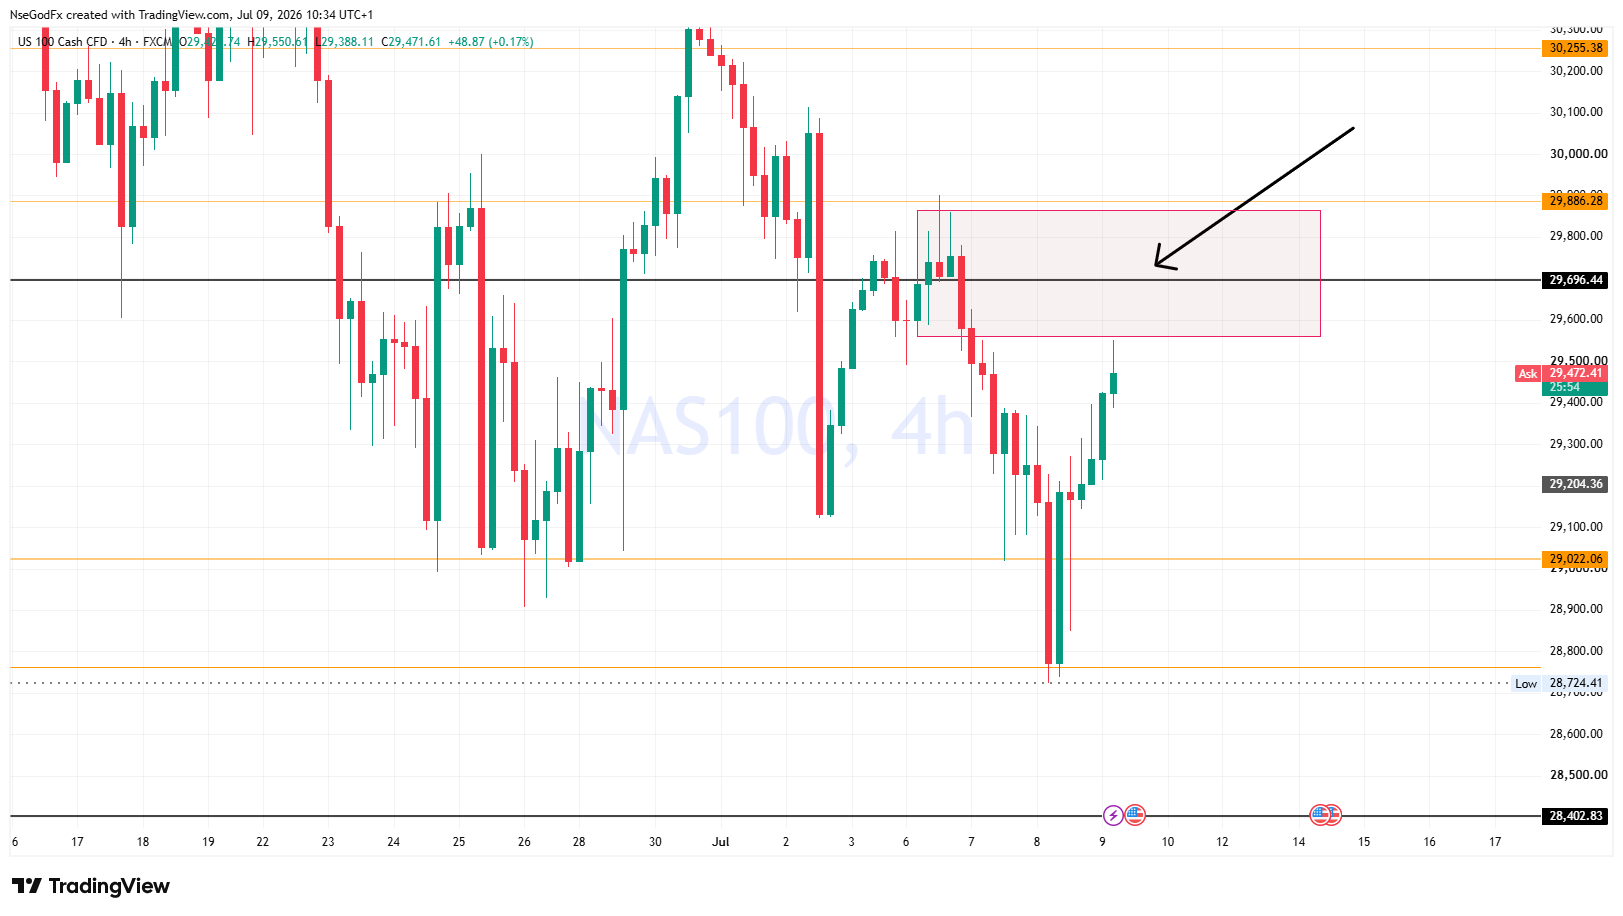
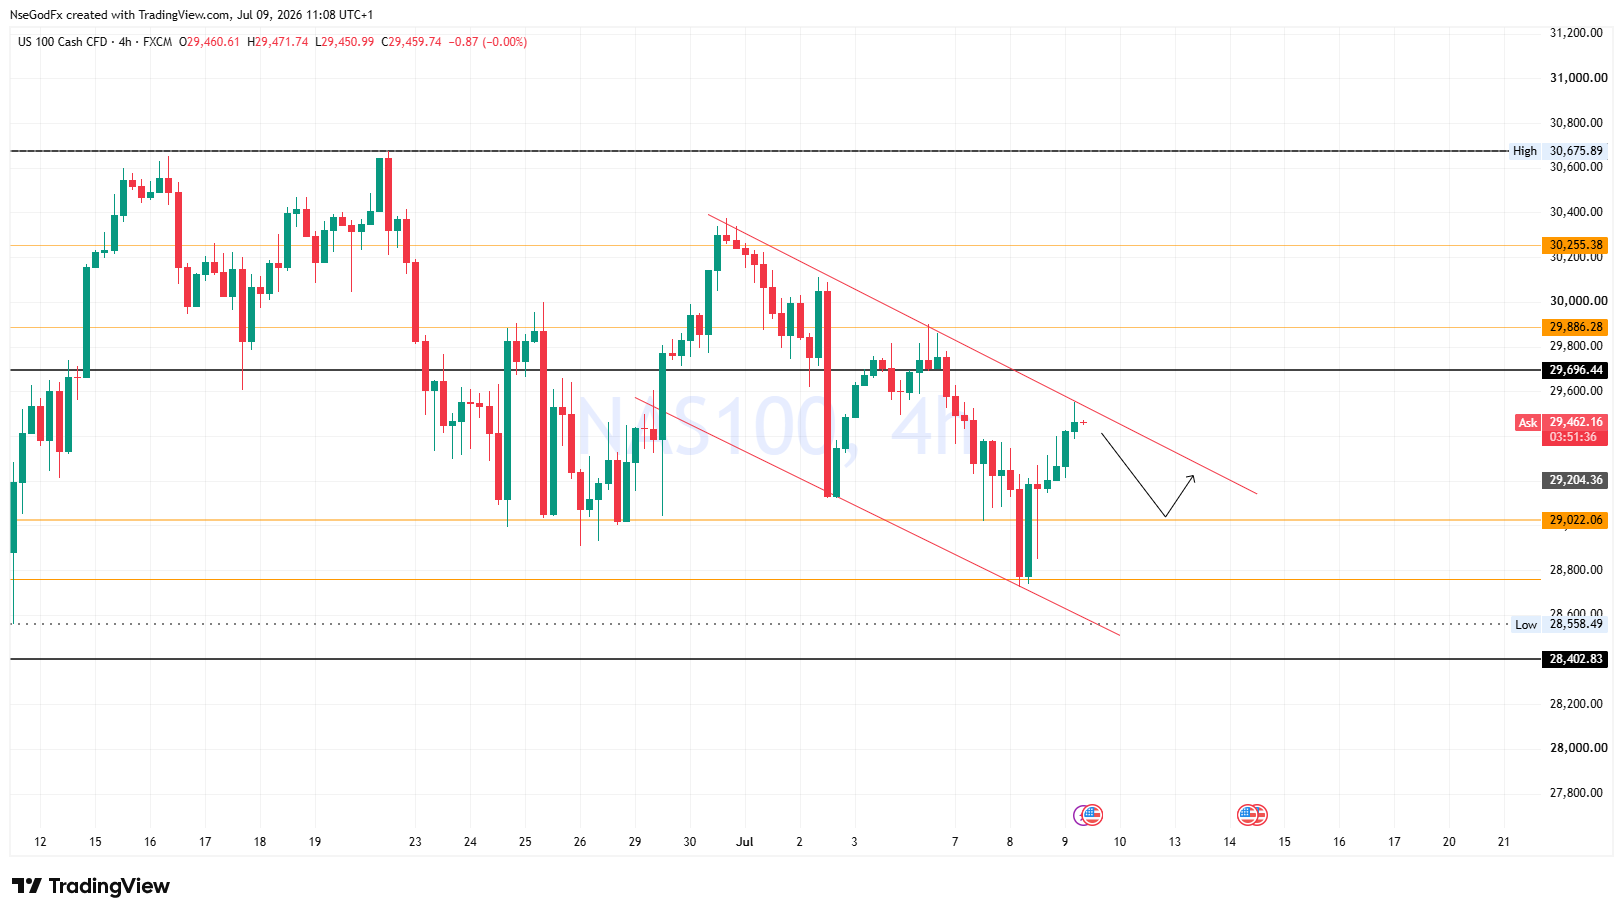
Nas 100- 4hr Setup
Trend: Bearish

Technical outlook: Price has formed a bearish channel, and is trading within it. I'll be expecting sells, down to 29002 price level during NY session. failure to break below, will cause price to rally and invalidate the bearish channel.

N
@nsg_usd - 7 hours ago
Quoted - asuquokelvin

150 is not really the strong resistance level to watch above 170 is what is to be considered and there is a weekly opening gap around there, above that gap gives a strong buy

150 is a strong pschological zone, because that was the Opening Market price of the Space X shares on Nasdaq. If price trades above it again, it will give investors confidence to keep holding and i'm quite sure those that missed the opening price must have bought at 145, which is the reason the buys is pumping from that price level.

N
@nsg_usd - 6 hours ago
Quoted - nsg_usd

NAS 100 DAILY PROJECTION

DATE: Thursday 9th July 2026.
TREND: Range

TECHNICAL OUTLOOK: Despite the strong sells we've witnessed on Nasdaq for the past 2 days, price has been unable to break below 29000. It traded below the internal suppport region yesterday (wednesday), but rejected strongly @ 28,722 H-support and closed back above 29000 price region.

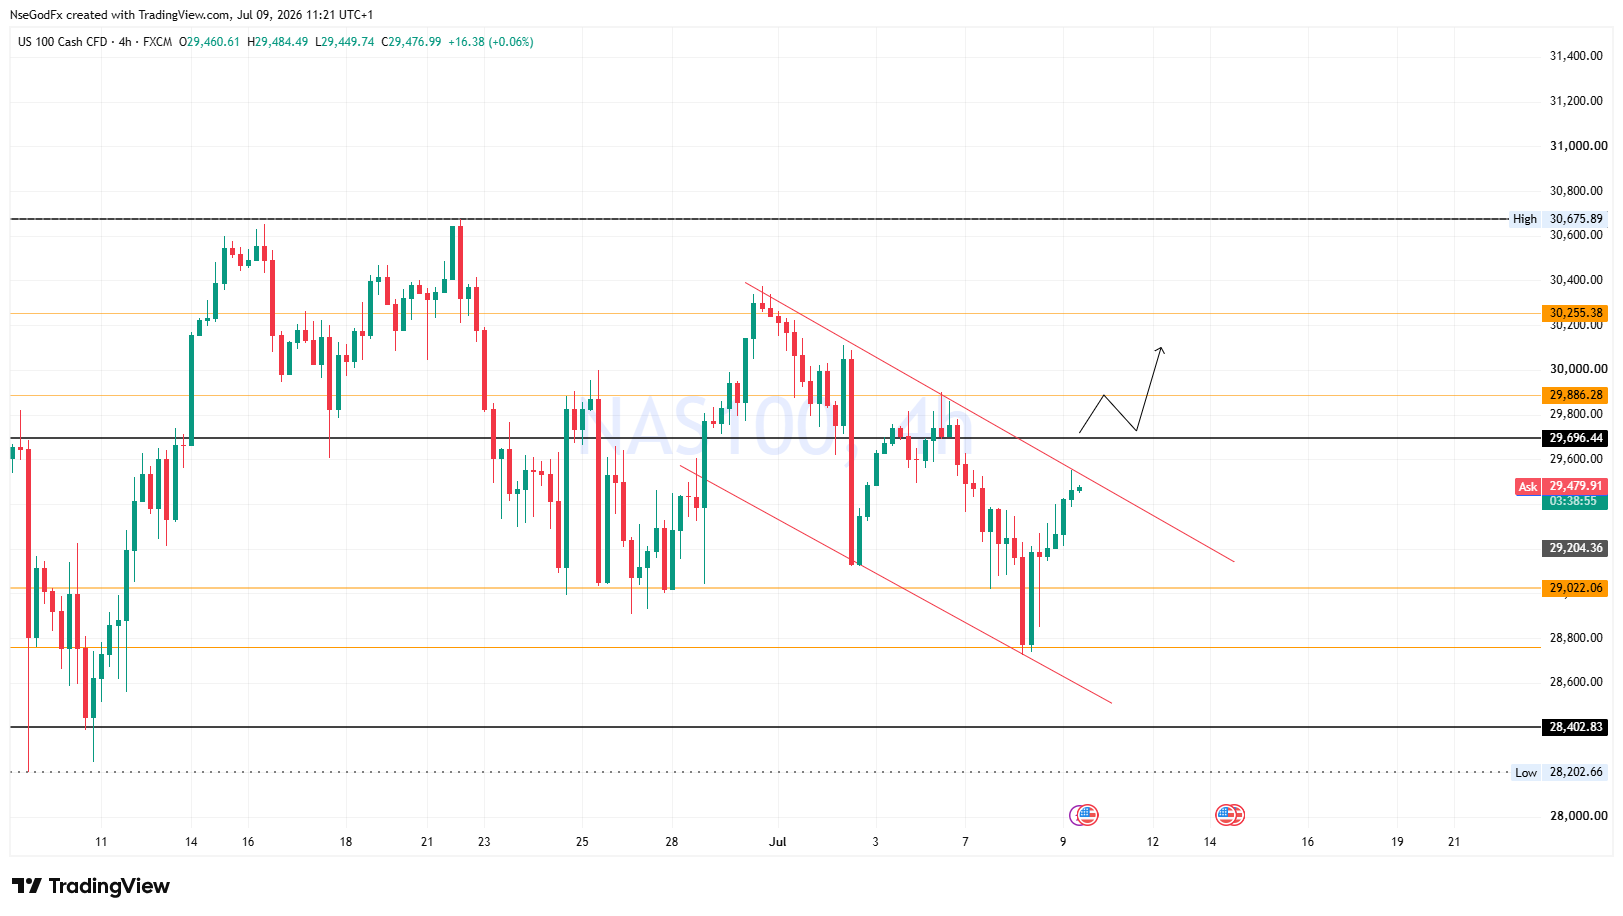
NAS 100- 1hr Entry confirmation

To go short on Nasdaq today, i'll wait to see a bearish candle break below 29,398 price level, and close below it. And then wait for price to retest the zone as a resistance with a bearish candle close, before executing the trade.

Disclaimer:

At MyTradingLand.com, we connect you with forex brokers and provide a community for traders. While we offer valuable information and resources, please note that we are not financial advisors and cannot provide personalized financial advice. Always conduct your own research and invest responsibly.

Community Guidelines: The MyTradingLand.com community is designed as a resource for forex traders, promoting respectful and constructive discussions. We reserve the right to remove any content that is misleading, abusive, or violates our terms of service.

Broker Information: While we may receive commissions or advertising income from some of the brokers listed, this does not imply an endorsement of any broker, nor does it affect our review process. Our evaluations are based solely on objective criteria and user feedback.

Always verify the regulatory status of any broker with your local financial authority, along with their terms and privacy policies, before engaging with them. It is crucial to conduct thorough research to ensure that you are making informed decisions.

Risk Warning: At MyTradingLand.com, we strive to provide accurate information; however, the forex market is highly volatile and can change rapidly. It is essential to verify any information before making investment decisions.

Please be aware that trading in forex involves substantial risk, and it is possible to lose more than your trading equity/investment capital. 70-90% of retail CFD traders incur losses in their trading activities as per information from various brokers.

You are solely responsible for your use of MyTradingLand.com and any trading decisions you make. We encourage all users to educate themselves thoroughly about forex trading and to consider seeking advice from qualified financial professionals.

Advertising Disclosure: We may earn commissions from recommended brokers, but our reviews are independent (not influenced by potential earnings). Sponsored content is clearly marked and doesn't reflect our views.

©2026 ©2025 All rights reserved Mytradingland.com