NASDAQ weekly Projections

1 2 ... 8 9 10 11 12 13 14 15 16 17 Next »
N
@nsg_usd - 17 hours ago
Quoted - nsg_usd

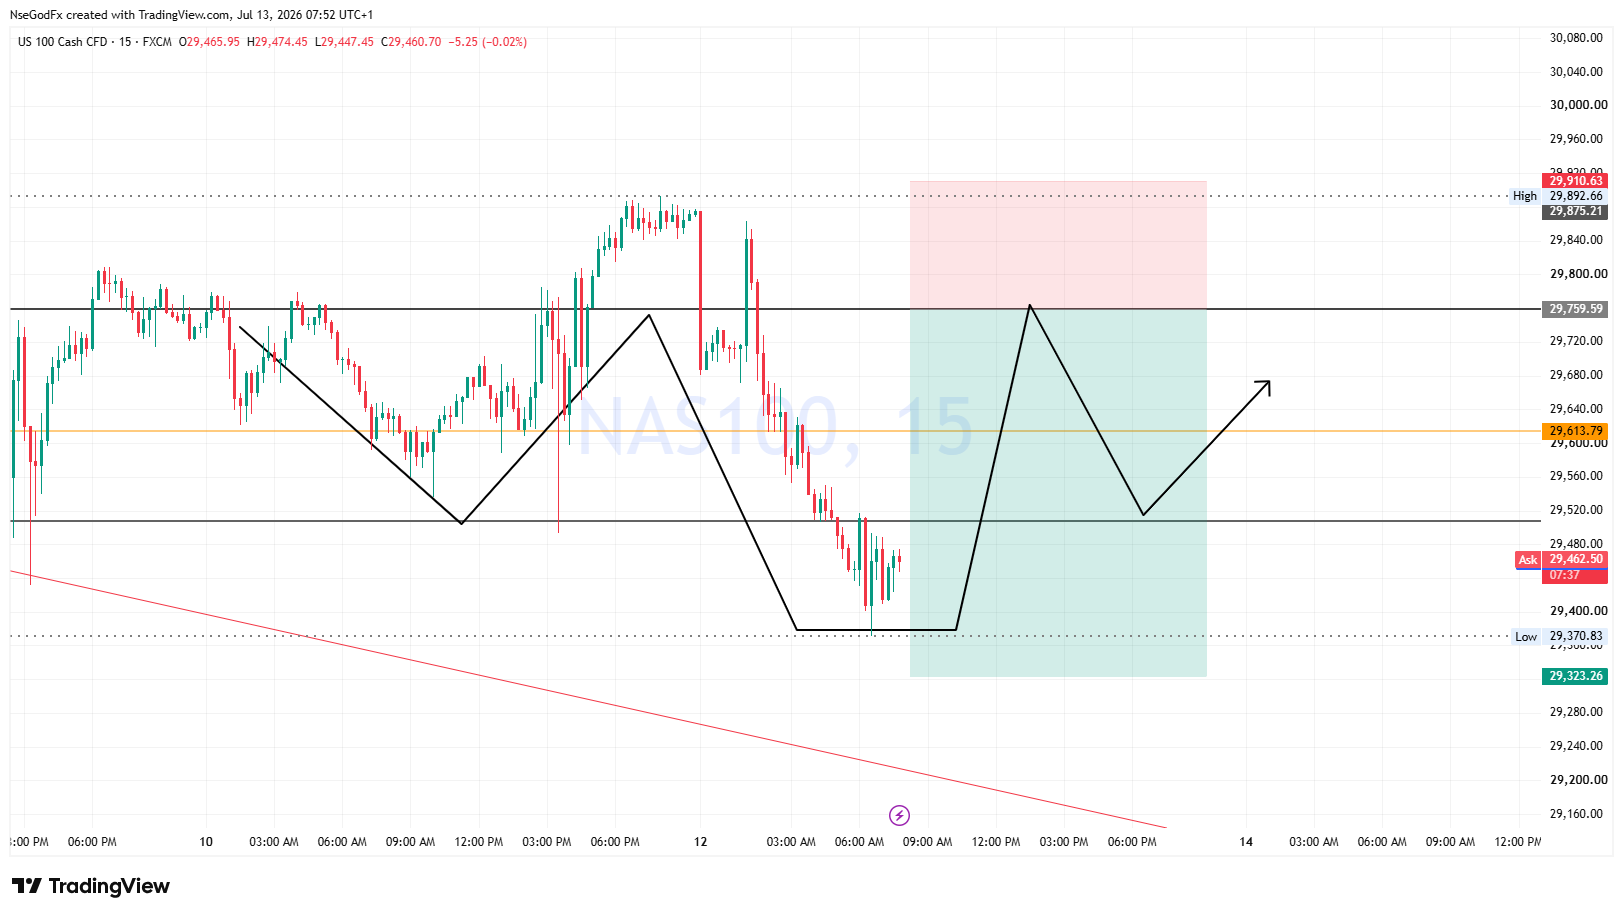
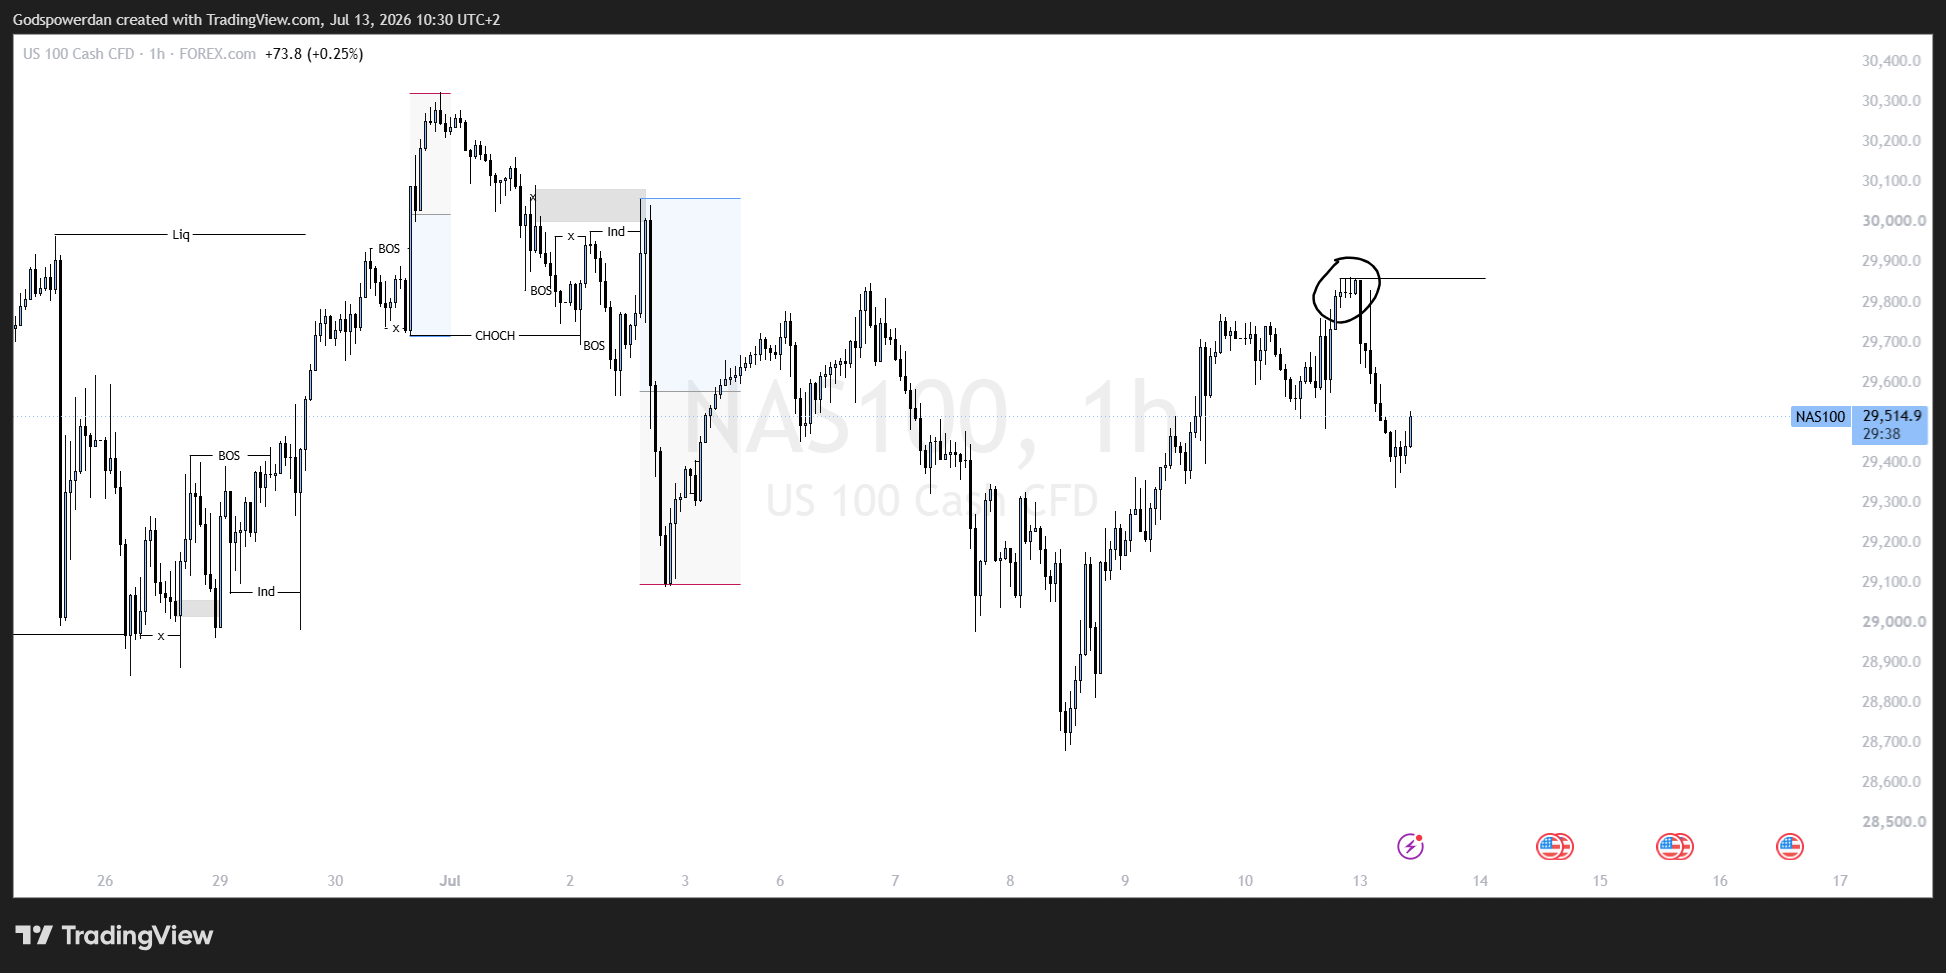
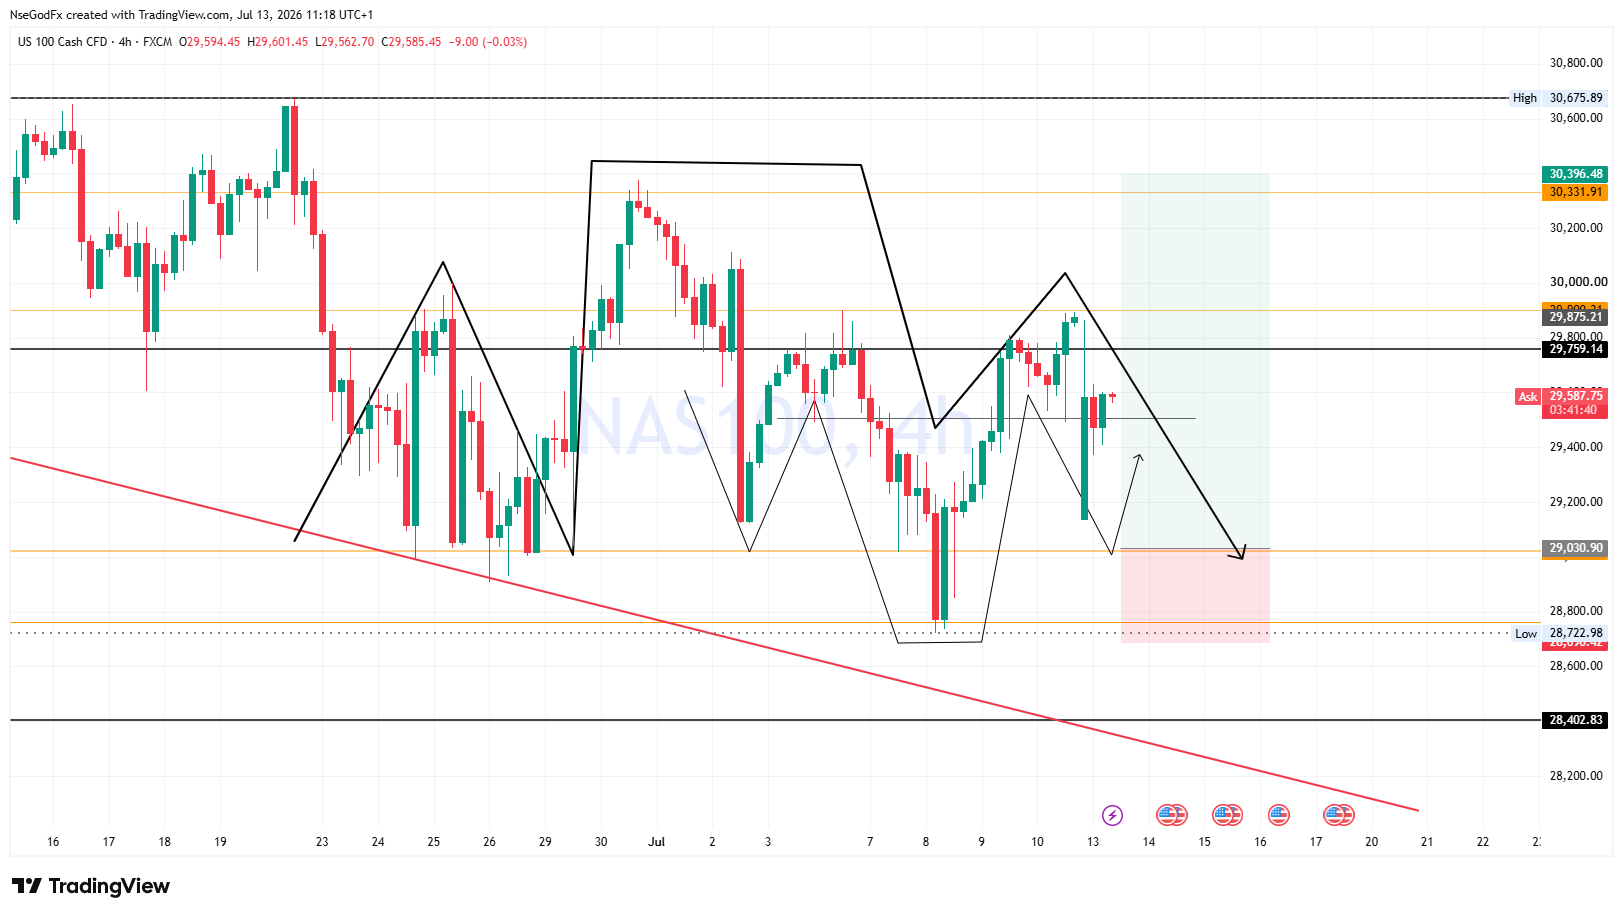
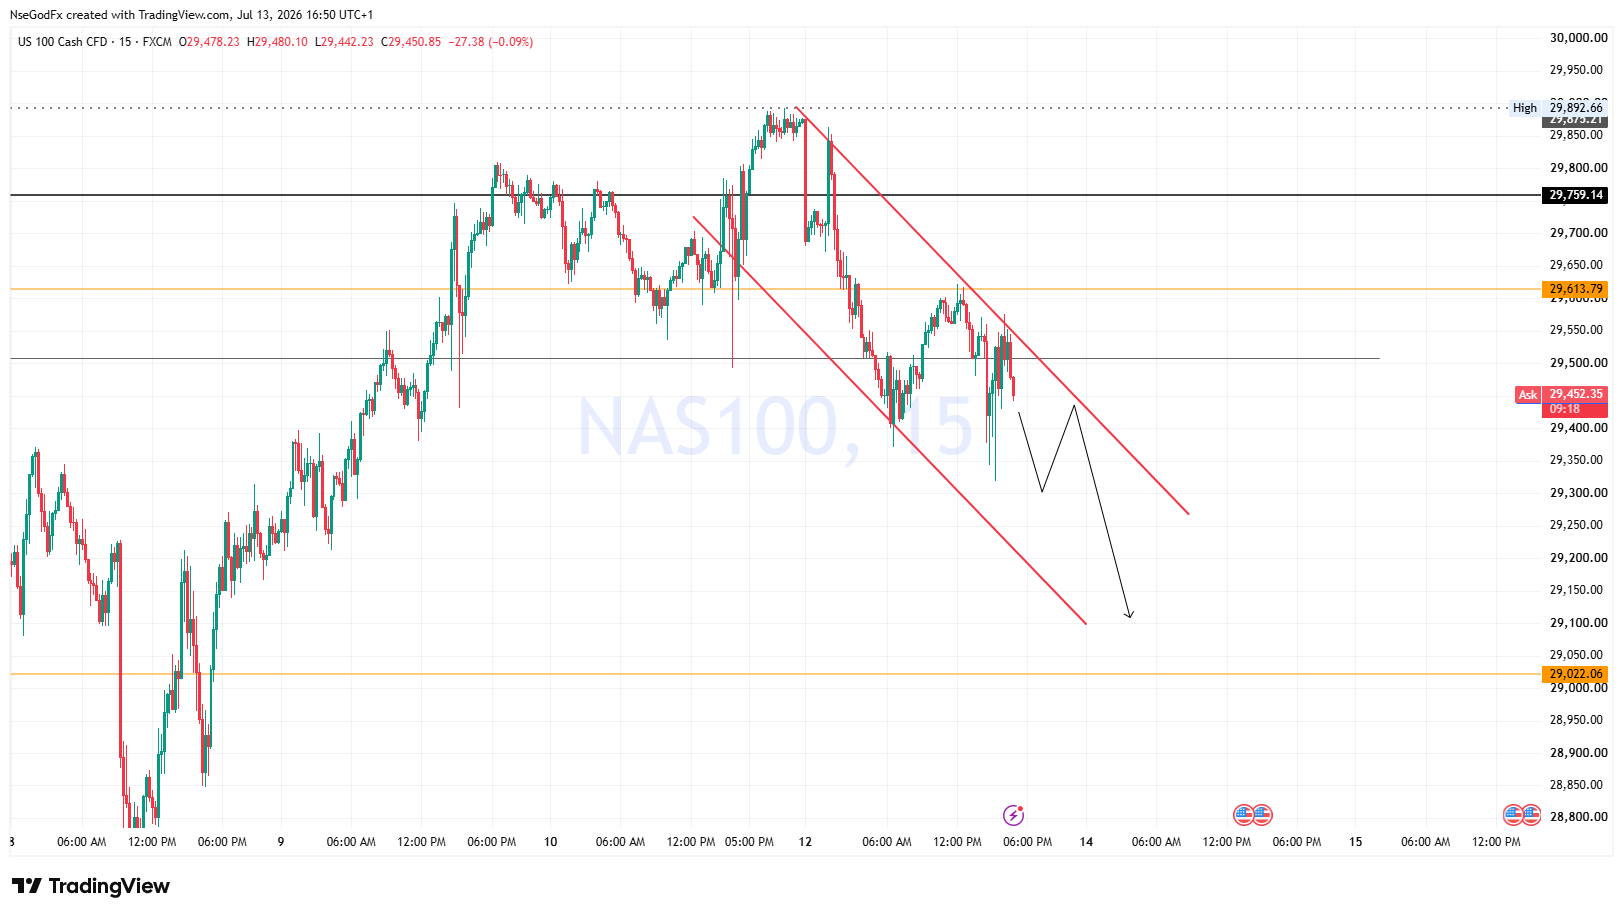
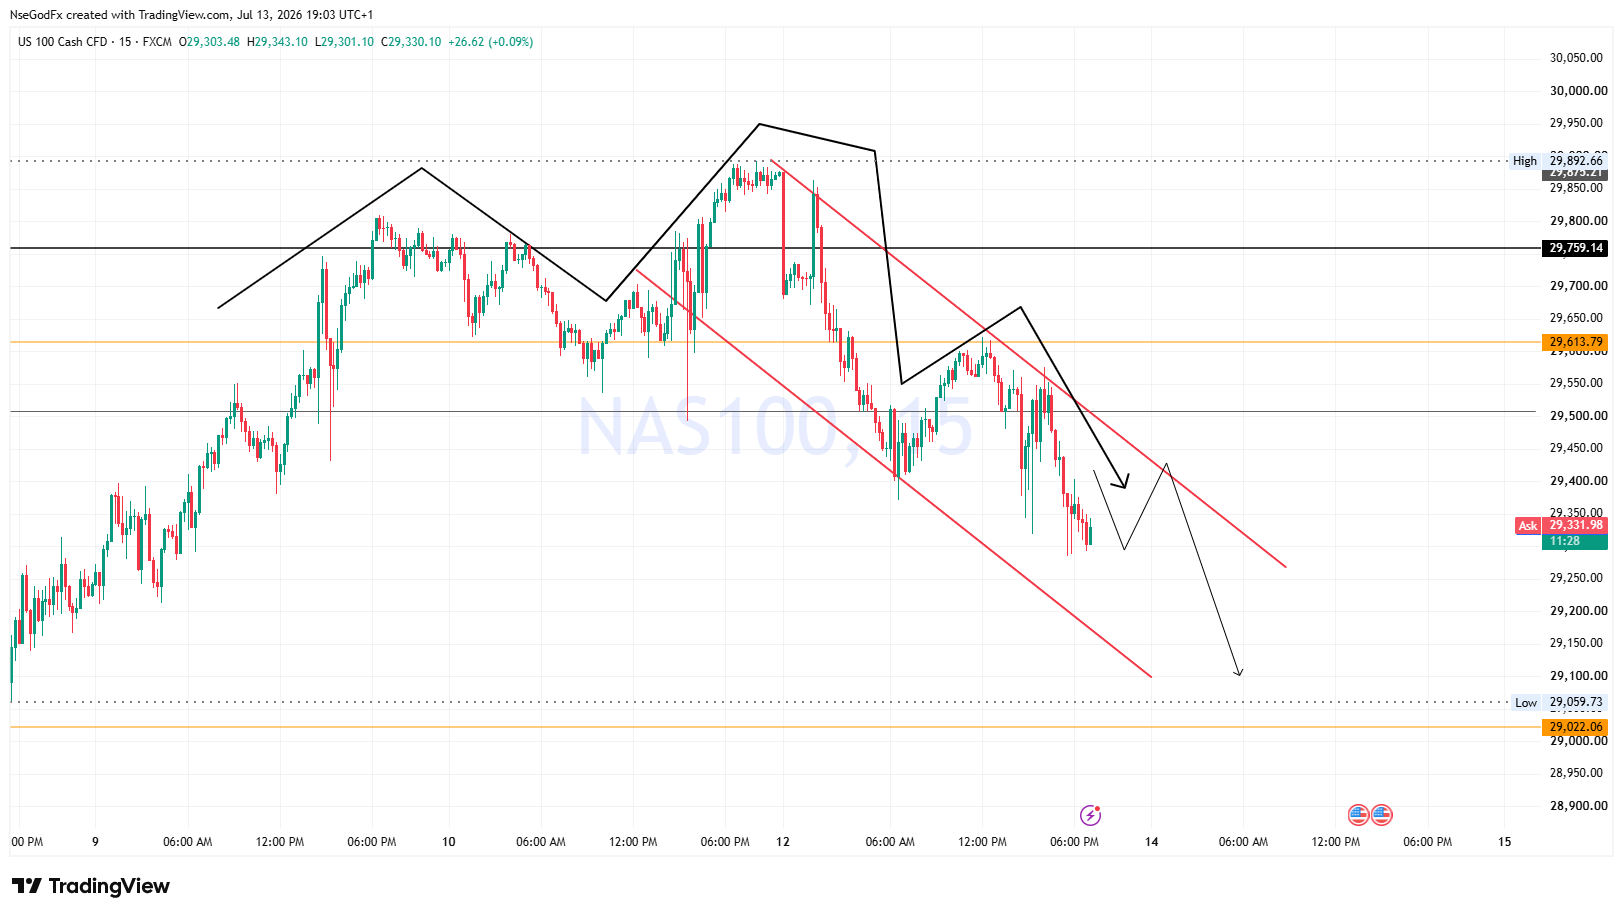
To trade the 15mins bearish pattern, I'll have my entry at 29759, My Sl above the 15mins high at 29910 and my TP at 29300 price level.

While my TP will be placed at the 29300 price level, I'll also pay attention to the possibility of price respecting the reverse of the bearish pattern, thus making 59507 price level more reasonable for Take Profit.

N
@nsg_usd - 16 hours ago
Quoted - nsg_usd

While my TP will be placed at the 29300 price level, I'll also pay attention to the possibility of price respecting the reverse of the bearish pattern, thus making 59507 price level more reasonable for Take Profit.

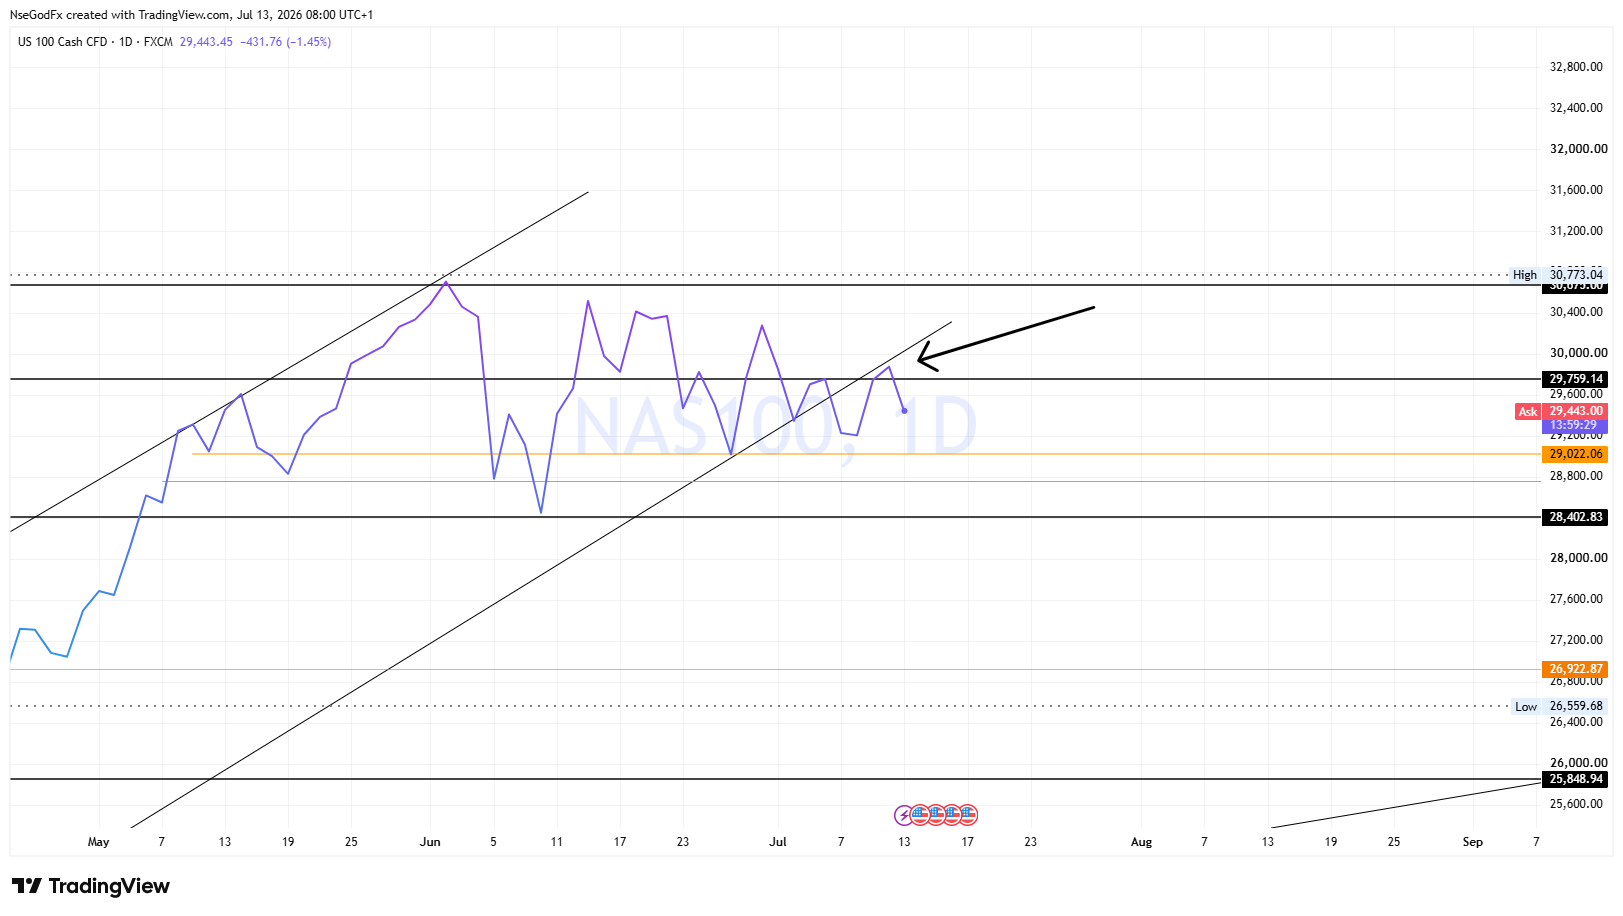
Nas Daily Trend Analysis- Price made a retest of the daily trendline on friday, which it invalidated on Tuesday. The Daily trendline support has now become a bearish resistance trendline at the 29875 Price Level.

N
@nsg_usd - 16 hours ago
Quoted - nsg_usd

Nas Daily Trend Analysis- Price made a retest of the daily trendline on friday, which it invalidated on Tuesday. The Daily trendline support has now become a bearish resistance trendline at the 29875 Price Level.

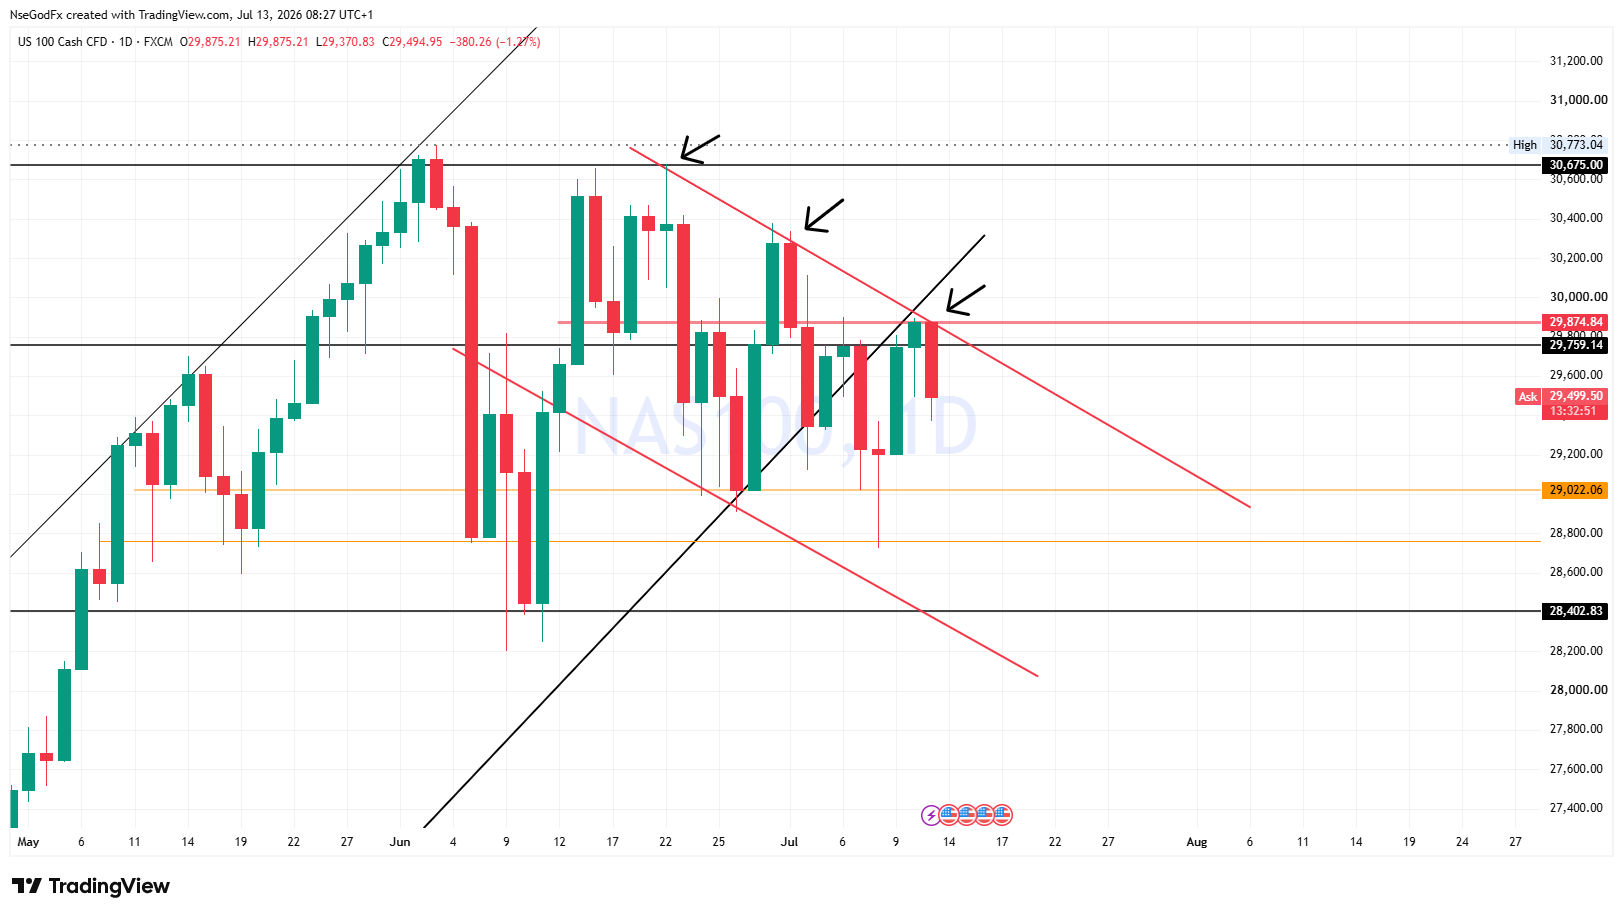
The trendline retest also confluences with a Daily Bearish Trendline Upper Channel which connects monday 22 june's high (30675), with tuesday 30th June /wed 1st July as the second touch, and Last week's Friday/today's High (29857) as a 3rd touch creating Lower Highs sequence on the Daily timeframe.

N
@nsg_usd - 16 hours ago
Quoted - nsg_usd

The trendline retest also confluences with a Daily Bearish Trendline Upper Channel which connects monday 22 june's high (30675), with tuesday 30th June /wed 1st July as the second touch, and Last week's Friday/today's High (29857) as a 3rd touch creating Lower Highs sequence on the Daily timeframe.

The 3 bearish confluences at the 29875 Resistance Zone (Bearish Trendline touch + Invalidated trendline support retest + Major Resistance Zone) is a 60% strong bearish confirmation that price will experience a strong decline down to 29022 price level first and possibly down to 28402 Major support Level before the month is over.

N
@nsg_usd - 15 hours ago
Quoted - nsg_usd

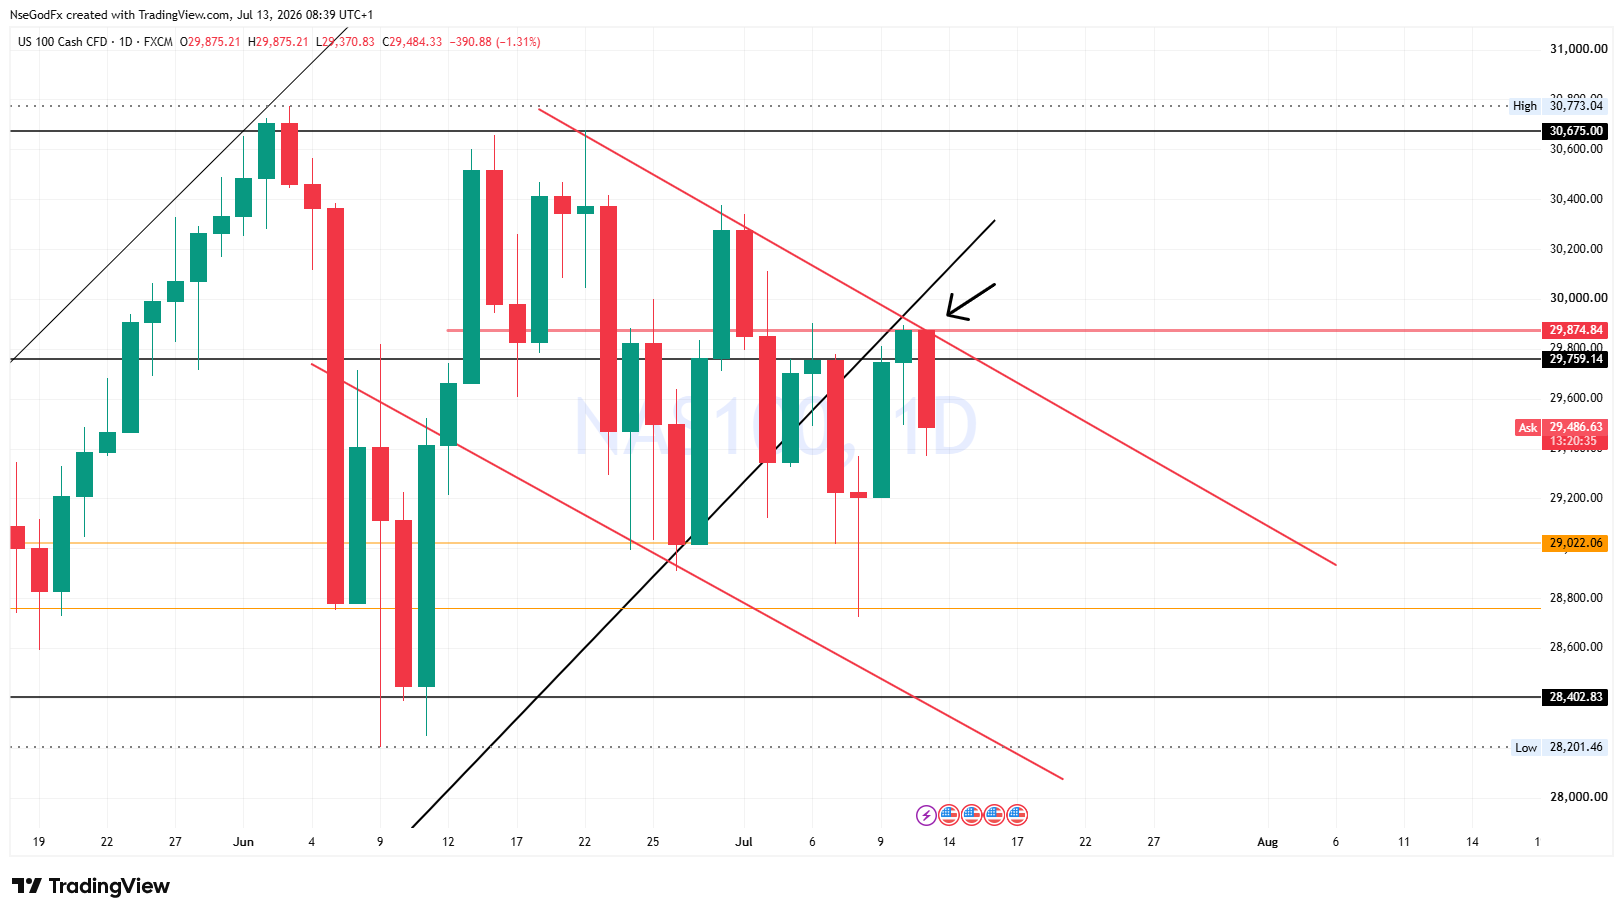
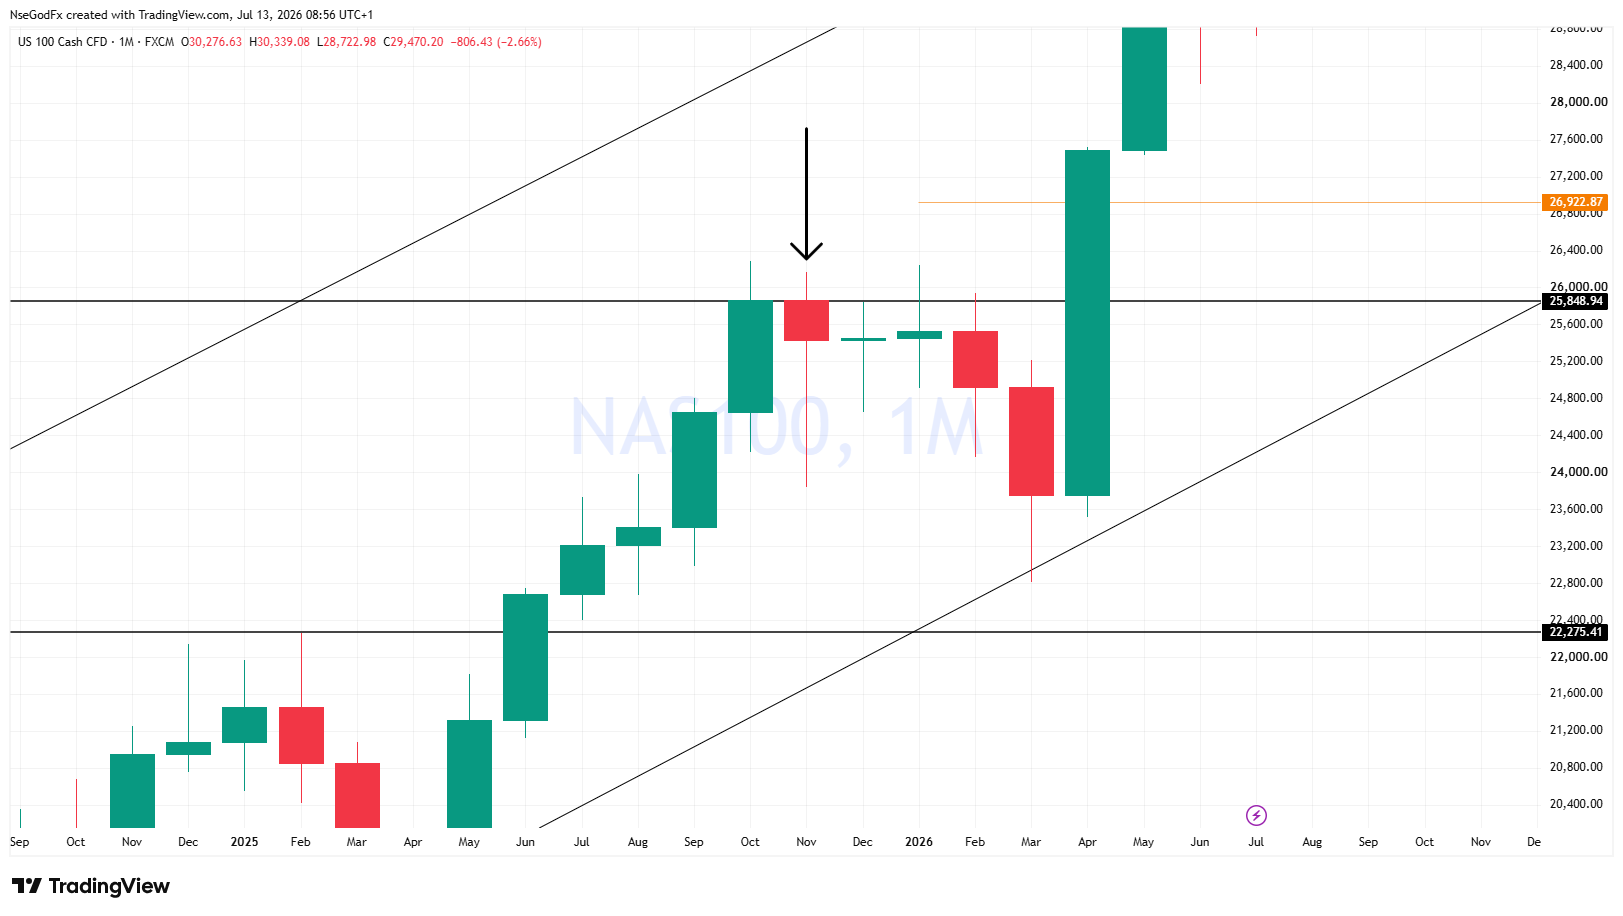
A 4th Confluence that will increase the Bearish decline chances to 70% is today's daily Candle closing a bearish as a hanging man, as shown in the chart below.

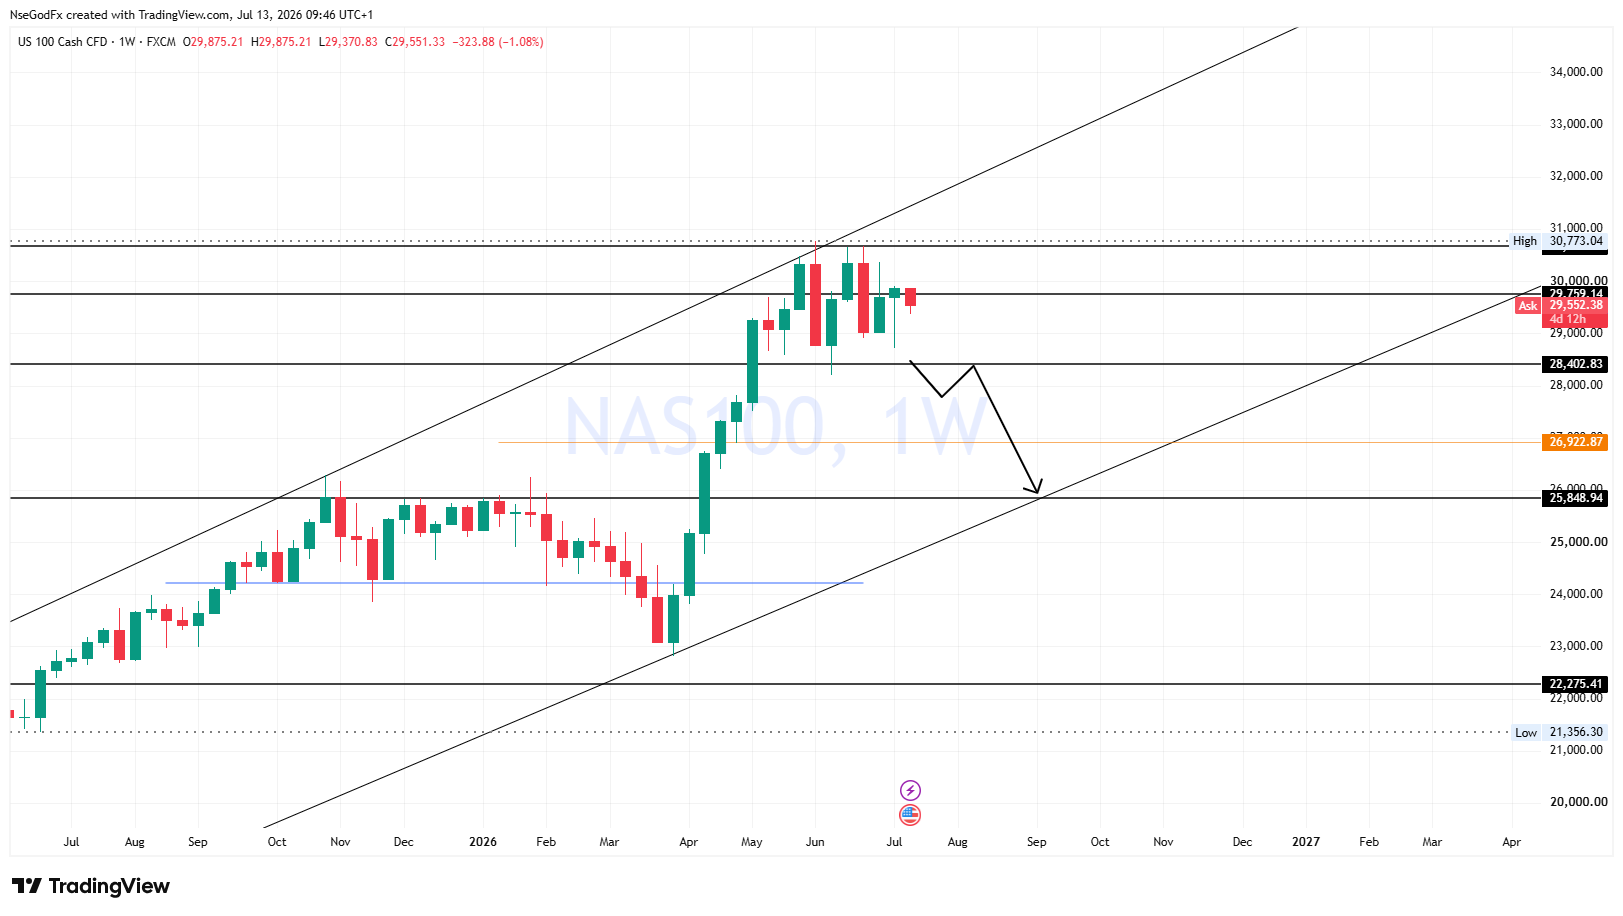
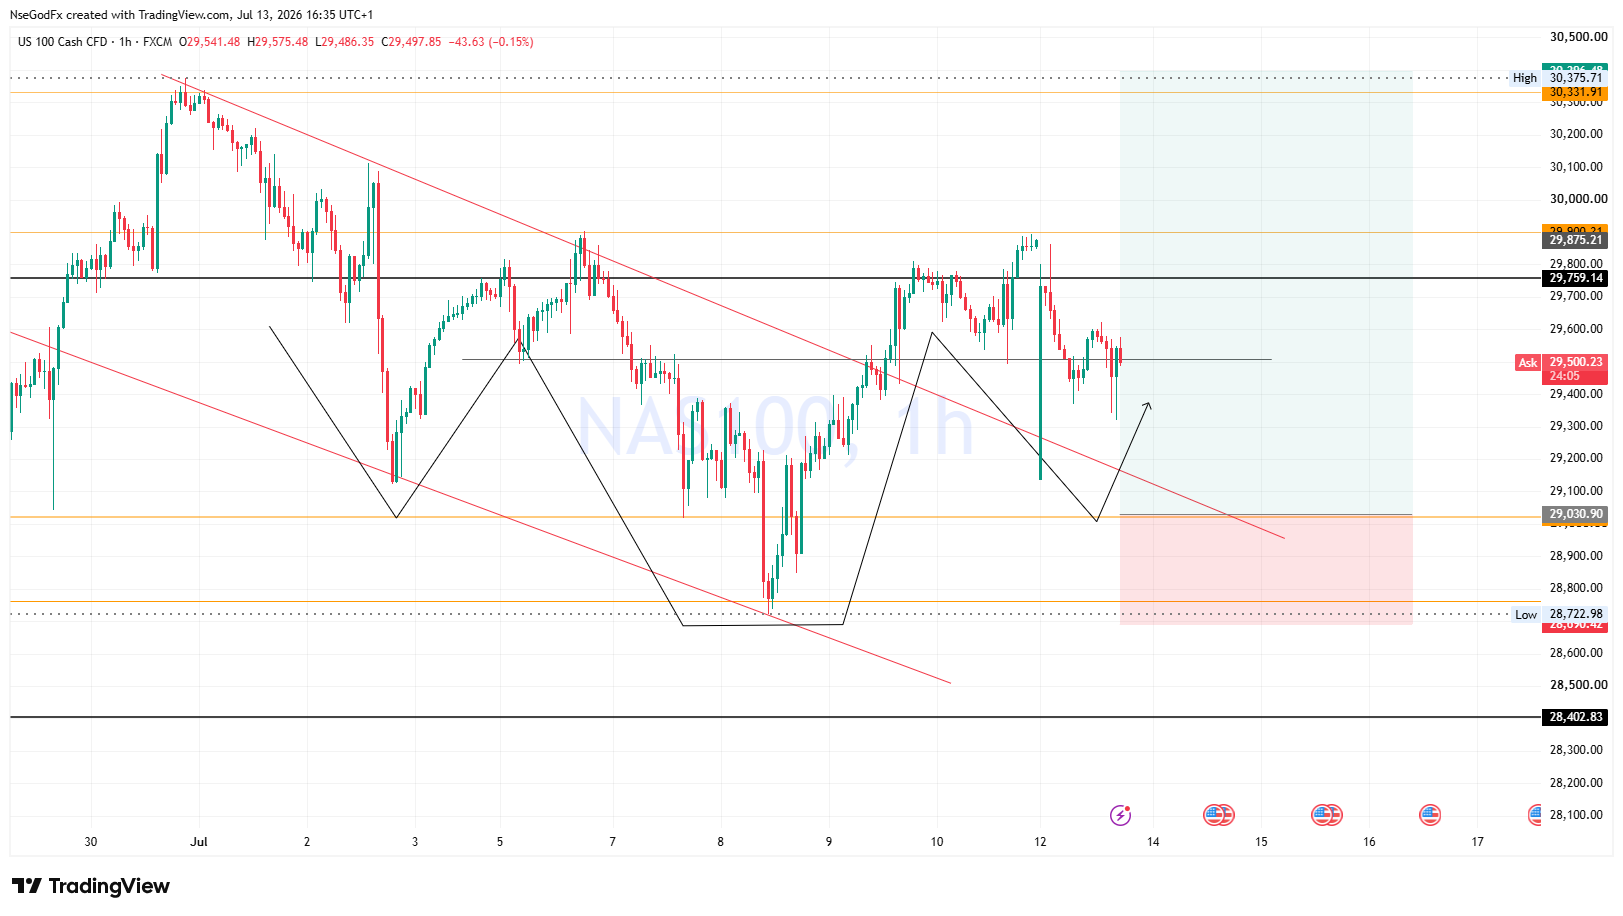
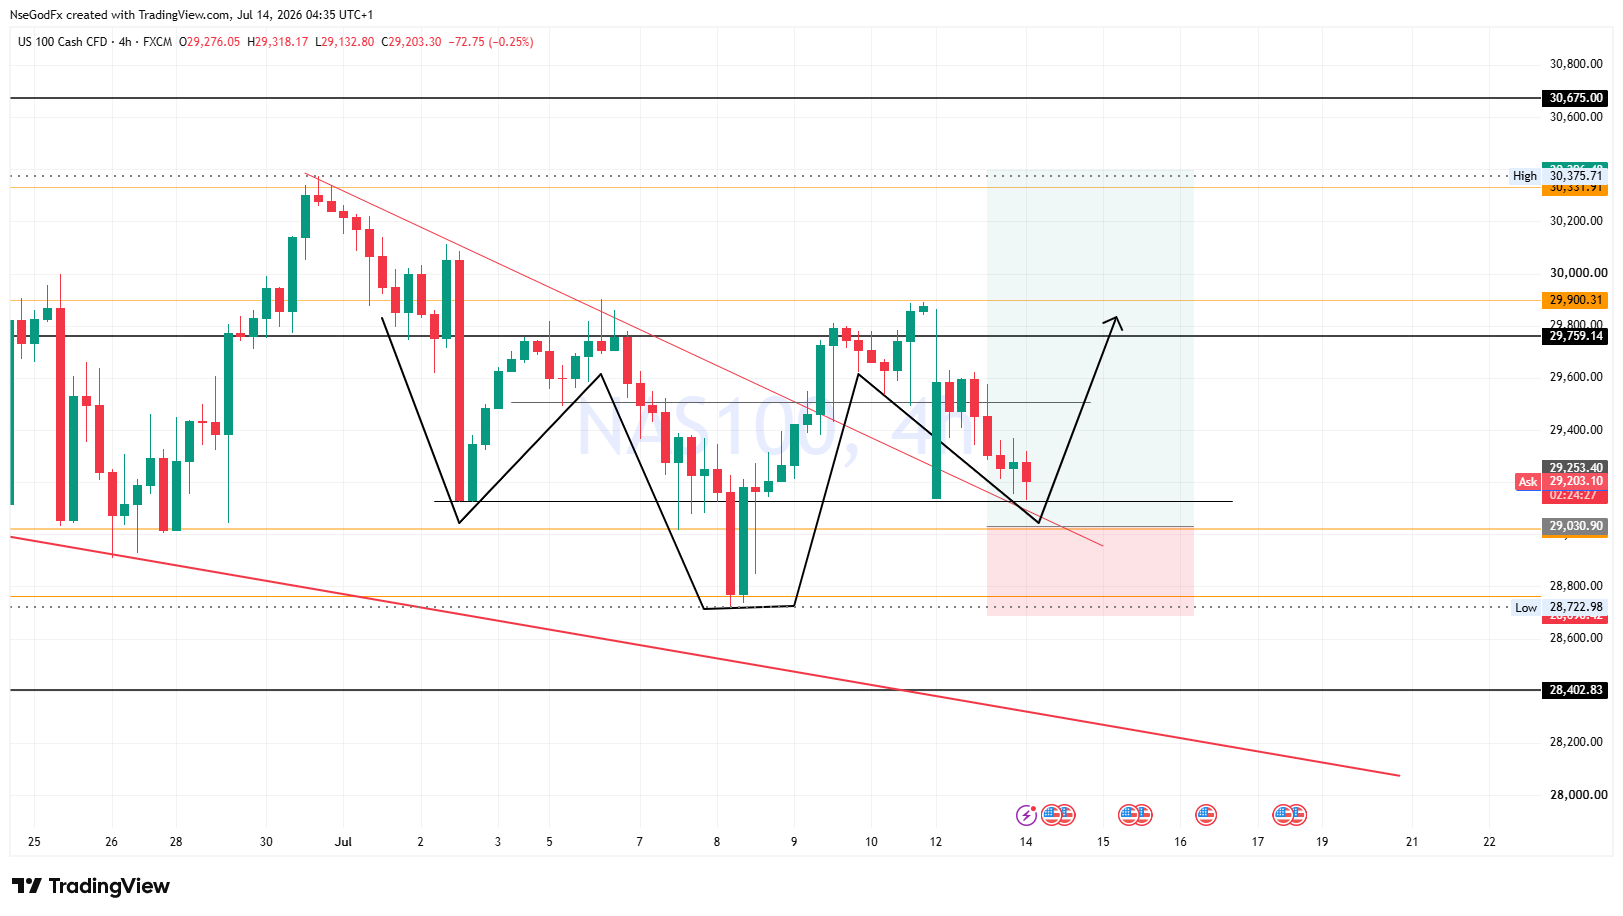
Nas 100 weekly Trend Analysis- Technically, there's enough imbalance to attract price downwards, but it will take a while before we can see price fill it up. A break below 29400 price level is the only guarantee for price decline down to 26,000.

N
@nsg_usd - 14 hours ago
Quoted - nsg_usd

Nas 100 weekly Trend Analysis- Technically, there's enough imbalance to attract price downwards, but it will take a while before we can see price fill it up. A break below 29400 price level is the only guarantee for price decline down to 26,000.

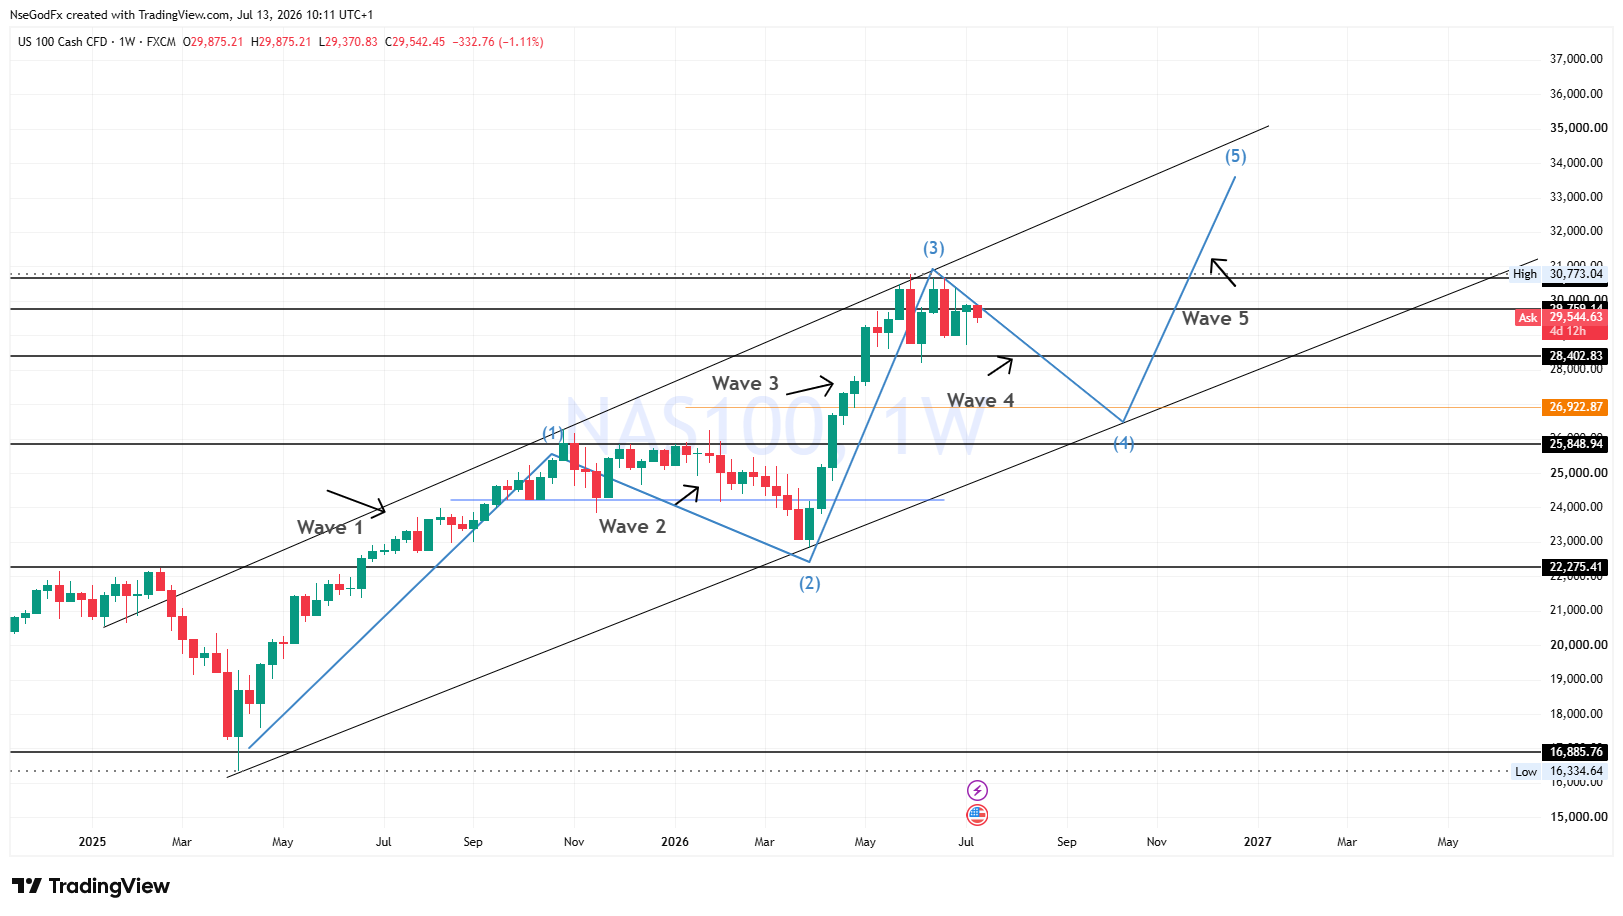
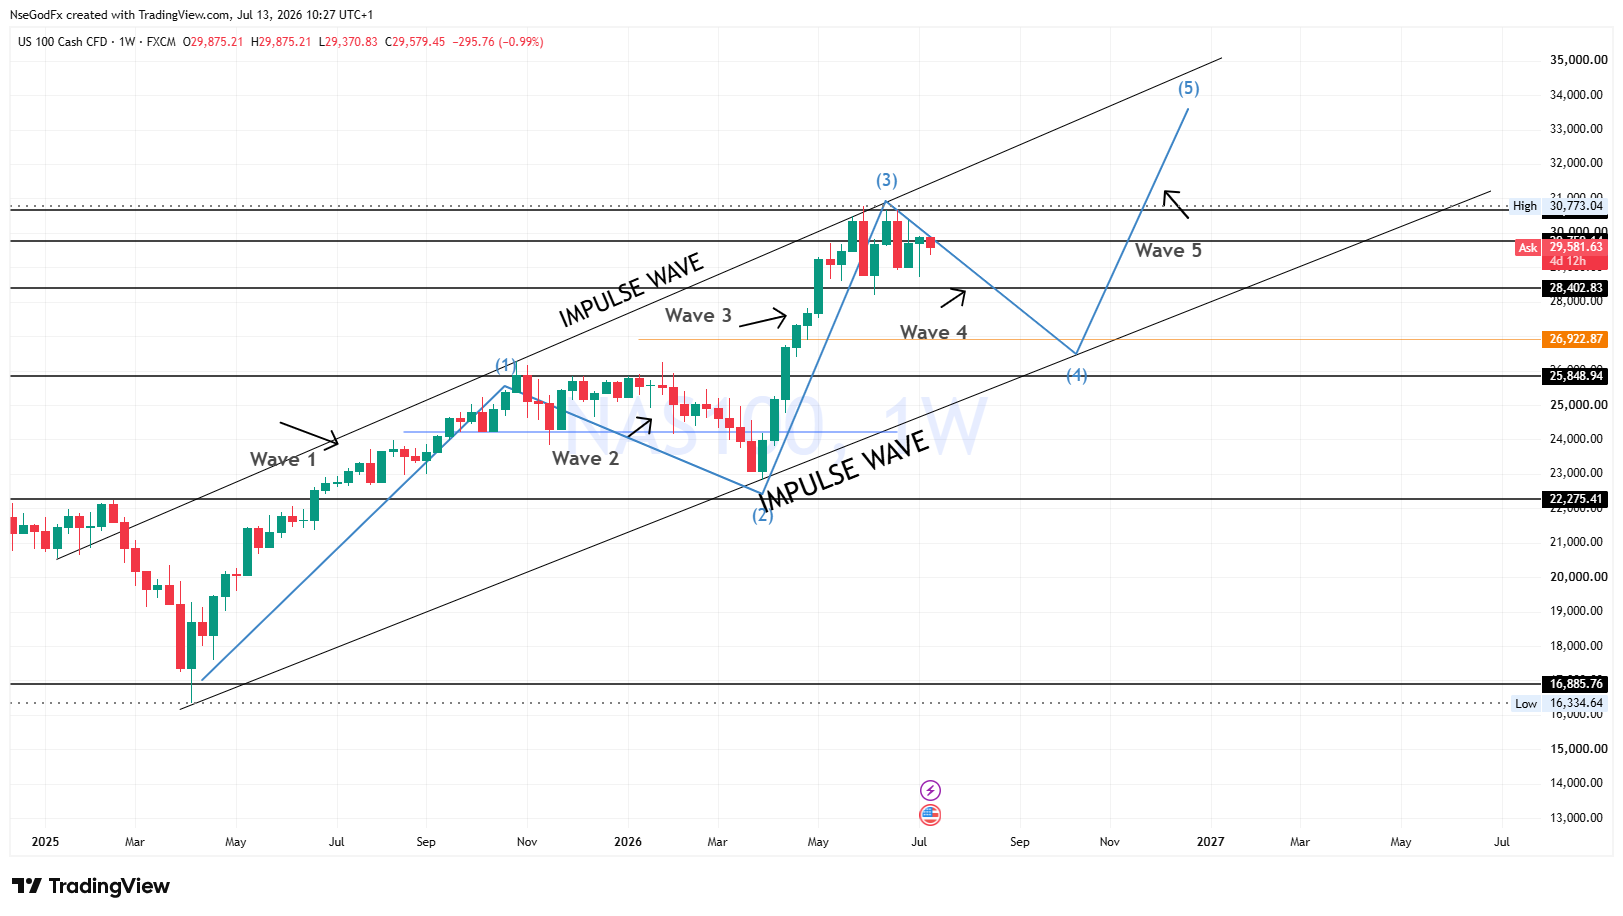
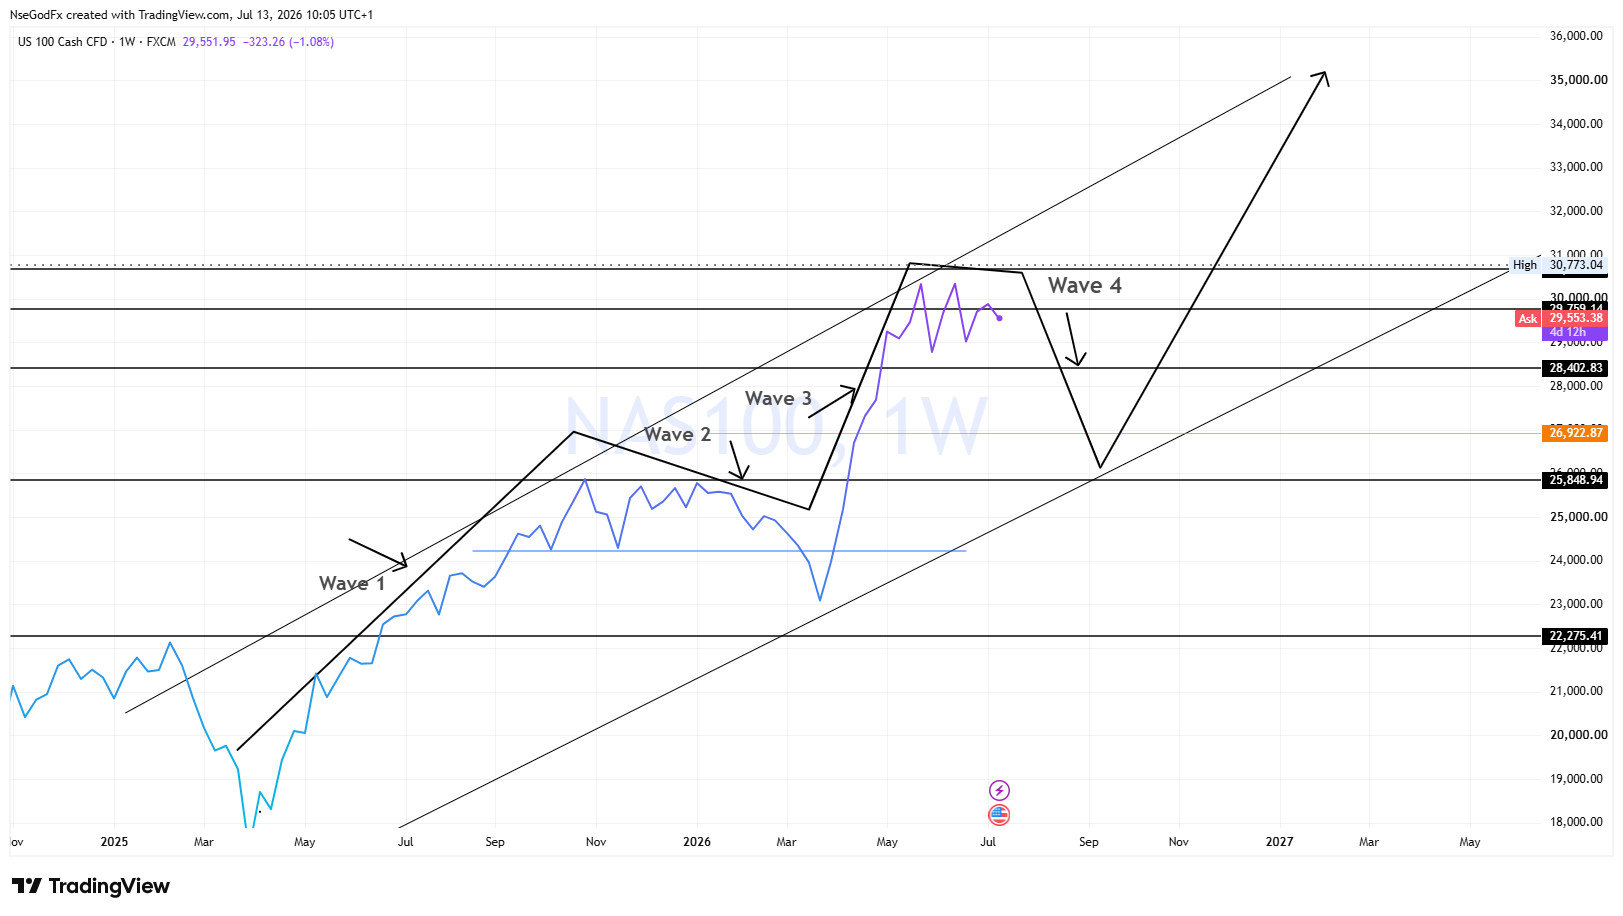
This is the Weekly skeletal framework of NAS 100 trend. Price is currently on the 4th phase of it's Impulse wave, following an Elliot wave theory. Wave 2 and Wave 4 is the correction phase, while Wave 1 and Wave 3 are the impulse phase (wave 5 is not formed yet).

N
@nsg_usd - 14 hours ago
Quoted - nsg_usd

This is the Weekly skeletal framework of NAS 100 trend. Price is currently on the 4th phase of it's Impulse wave, following an Elliot wave theory. Wave 2 and Wave 4 is the correction phase, while Wave 1 and Wave 3 are the impulse phase (wave 5 is not formed yet).

Nas 100- Elliot Wave Theory Trend Analysis
This theory was developed by Ralph Nelson Elliot in the 1930s. It proposes that Markets move in repetitive wave patterns driven by investor psychology and the recurring cycle of optimism and pessimism. The theory divides market movement into impulse waves and corrective waves.

Nas 100 is currently on an impulse wave. This impulse wave began April 2025, last year.

N
@nsg_usd - 14 hours ago
Quoted - nsg_usd

Nas 100- Elliot Wave Theory Trend Analysis
This theory was developed by Ralph Nelson Elliot in the 1930s. It proposes that Markets move in repetitive wave patterns driven by investor psychology and the recurring cycle of optimism and pessimism. The theory divides market movement into impulse waves and corrective waves.

Nas 100 is currently on an impulse wave. This impulse wave began April 2025, last year.

The Impulse wave comprises of 5 phases. Wave1, wave 2 , wave 3, wave 4, wave 5.

Wave 1- Beginning of the trend (1st impulse leg)

Wave 2- a retracement phase that occurs after the impulse move (1st pullback leg)

Wave 3- Usually the strongest and longest of the impulse wave (2nd impulse leg)

Wave 4- Another retracement phase, expected to be shallower than wave 2 (2nd pullback leg)

Wave 5- The final momentum leg of the Impulse wave (3rd impulse leg).

After the 5-wave advance, the market will begin another Market Cycle for a major correction. This is the 2nd part known as the Corrective wave and it is classified as a 3-wave structure. (A, B,C).

In total, The Full Elliot Wave Cycle is. 1,2,3,4,5,A,B,C

A
@asuquokelvin - 13 hours ago
Quoted - nsg_usd

Nas 100- Elliot Wave Theory Trend Analysis
This theory was developed by Ralph Nelson Elliot in the 1930s. It proposes that Markets move in repetitive wave patterns driven by investor psychology and the recurring cycle of optimism and pessimism. The theory divides market movement into impulse waves and corrective waves.

Nas 100 is currently on an impulse wave. This impulse wave began April 2025, last year.

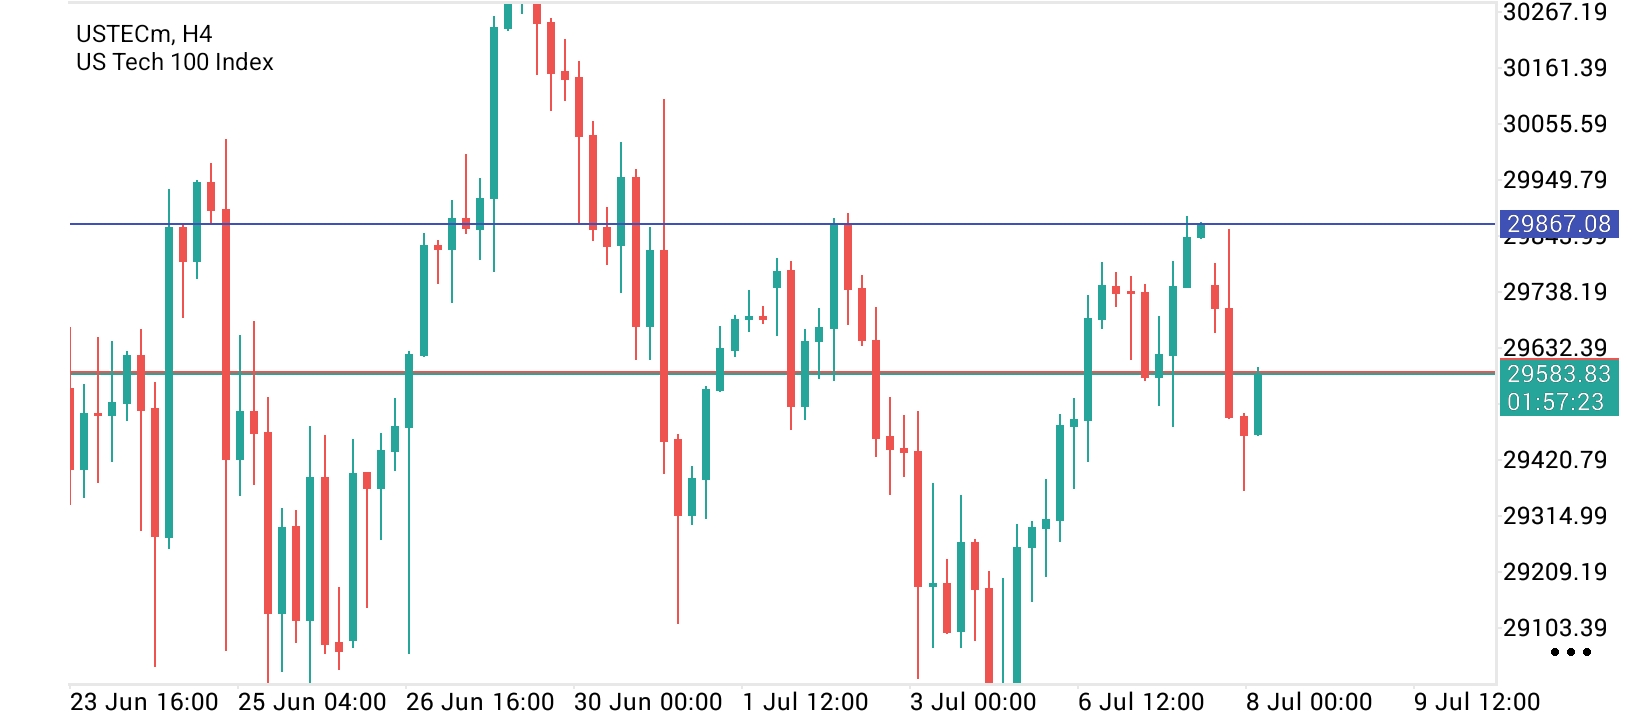
Elliott Wave gives a solid framework, but still combine it with market structure and macro fundamentals. If upcoming CPI, Fed expectations, and earnings continue supporting risk appetite, the impulse wave has a better chance of extending before the next meaningful correction, but if Maybe some don't align like the CPI and fed expectations and risk appetite reduce for a long while then expect some corrective wave move, but not really checking the weekly right now , am considering the 4hrs with a different approach using a different methodology, which is trading the new week opening gap as a support or resistance level, I have marked a key level at the 4hr timeframe @ 29867.08 if price breaks above the new week opening gap before it, then I will use it as a strong support but if price respects it I will trade it as a resistance level, all concepts works in alignment the difference is the timeframe you applied it

A
@asuquokelvin - 13 hours ago
Quoted - nsg_usd

Yeah. Thats right. I'll be trading this formations.

Price may not really come back that deep because of the new week opening gap, if price gets to that level it will be an invalidation, price may even push lower

G
@godspowerdan - 6 hours ago
Quoted - nsg_usd

Alright. I'll hold onto this bias. Sells for buys.

Looks clean though

Let's see how price will play out

G
@godspowerdan - 5 hours ago
Quoted - nsg_usd

Nas 100-The week is starting bearish, the buy's will come in from middle of the week.

I'll pay close attention to price then so I can spot the buys when it comes in

1 2 ... 8 9 10 11 12 13 14 15 16 17 Next »

Disclaimer:

At MyTradingLand.com, we connect you with forex brokers and provide a community for traders. While we offer valuable information and resources, please note that we are not financial advisors and cannot provide personalized financial advice. Always conduct your own research and invest responsibly.

Community Guidelines: The MyTradingLand.com community is designed as a resource for forex traders, promoting respectful and constructive discussions. We reserve the right to remove any content that is misleading, abusive, or violates our terms of service.

Broker Information: While we may receive commissions or advertising income from some of the brokers listed, this does not imply an endorsement of any broker, nor does it affect our review process. Our evaluations are based solely on objective criteria and user feedback.

Always verify the regulatory status of any broker with your local financial authority, along with their terms and privacy policies, before engaging with them. It is crucial to conduct thorough research to ensure that you are making informed decisions.

Risk Warning: At MyTradingLand.com, we strive to provide accurate information; however, the forex market is highly volatile and can change rapidly. It is essential to verify any information before making investment decisions.

Please be aware that trading in forex involves substantial risk, and it is possible to lose more than your trading equity/investment capital. 70-90% of retail CFD traders incur losses in their trading activities as per information from various brokers.

You are solely responsible for your use of MyTradingLand.com and any trading decisions you make. We encourage all users to educate themselves thoroughly about forex trading and to consider seeking advice from qualified financial professionals.

Advertising Disclosure: We may earn commissions from recommended brokers, but our reviews are independent (not influenced by potential earnings). Sponsored content is clearly marked and doesn't reflect our views.

©2026 ©2025 All rights reserved Mytradingland.com