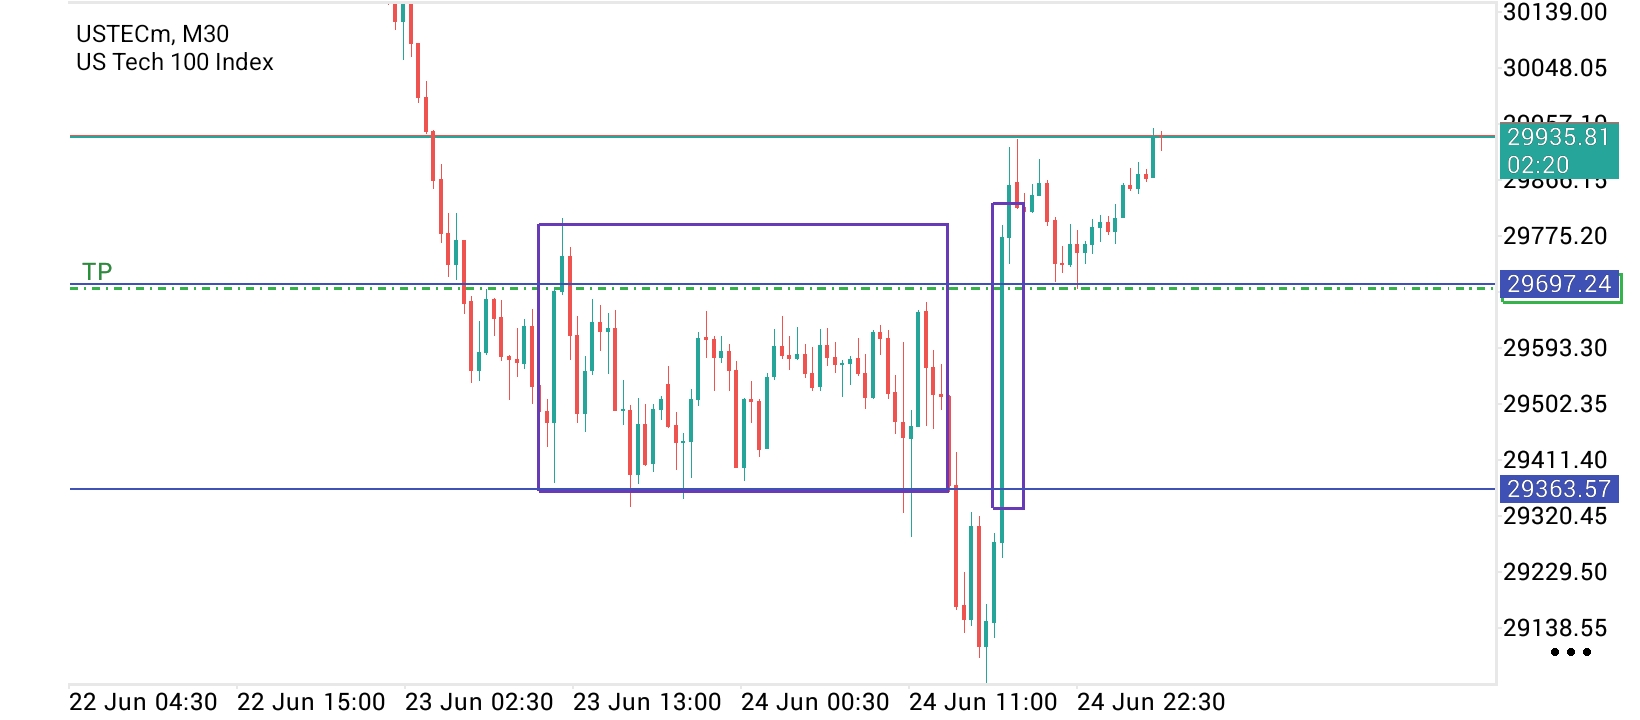
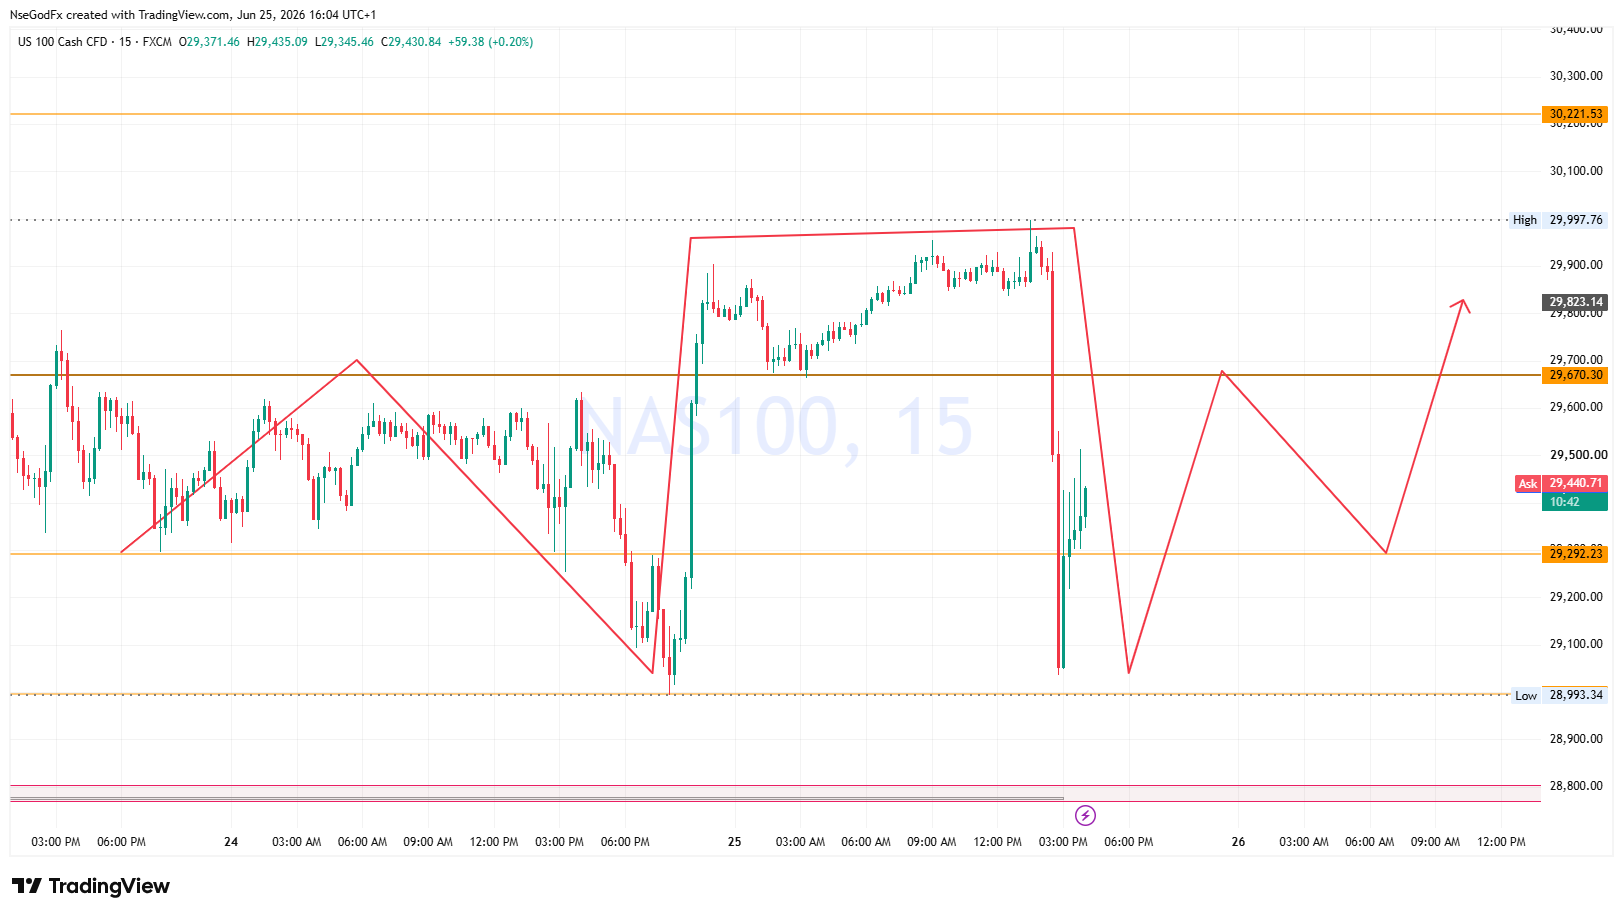
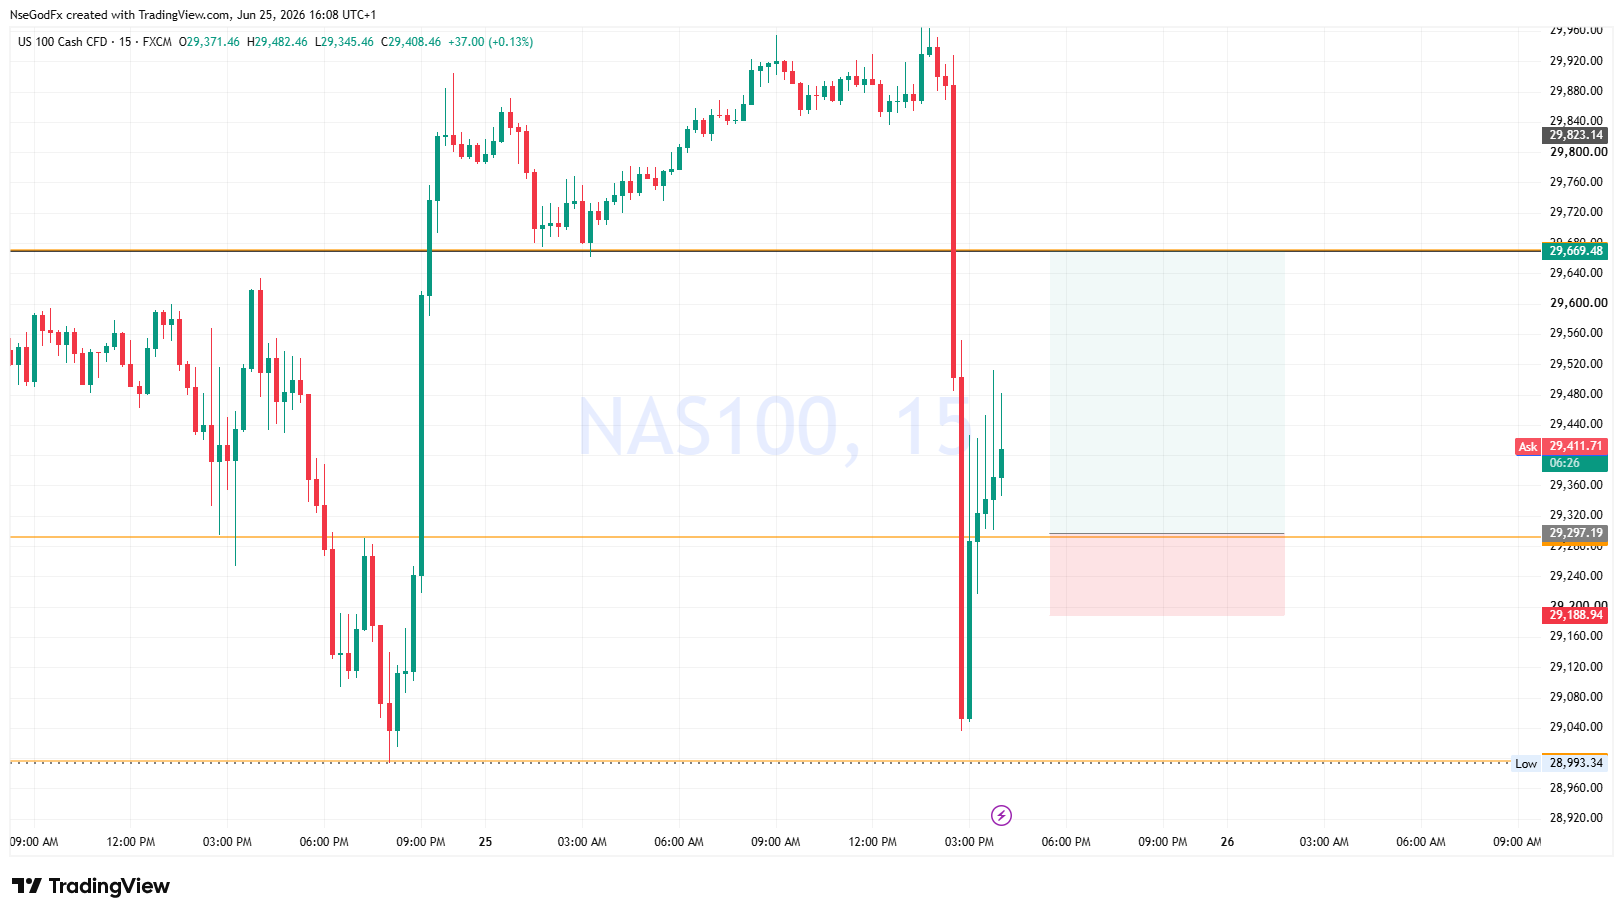
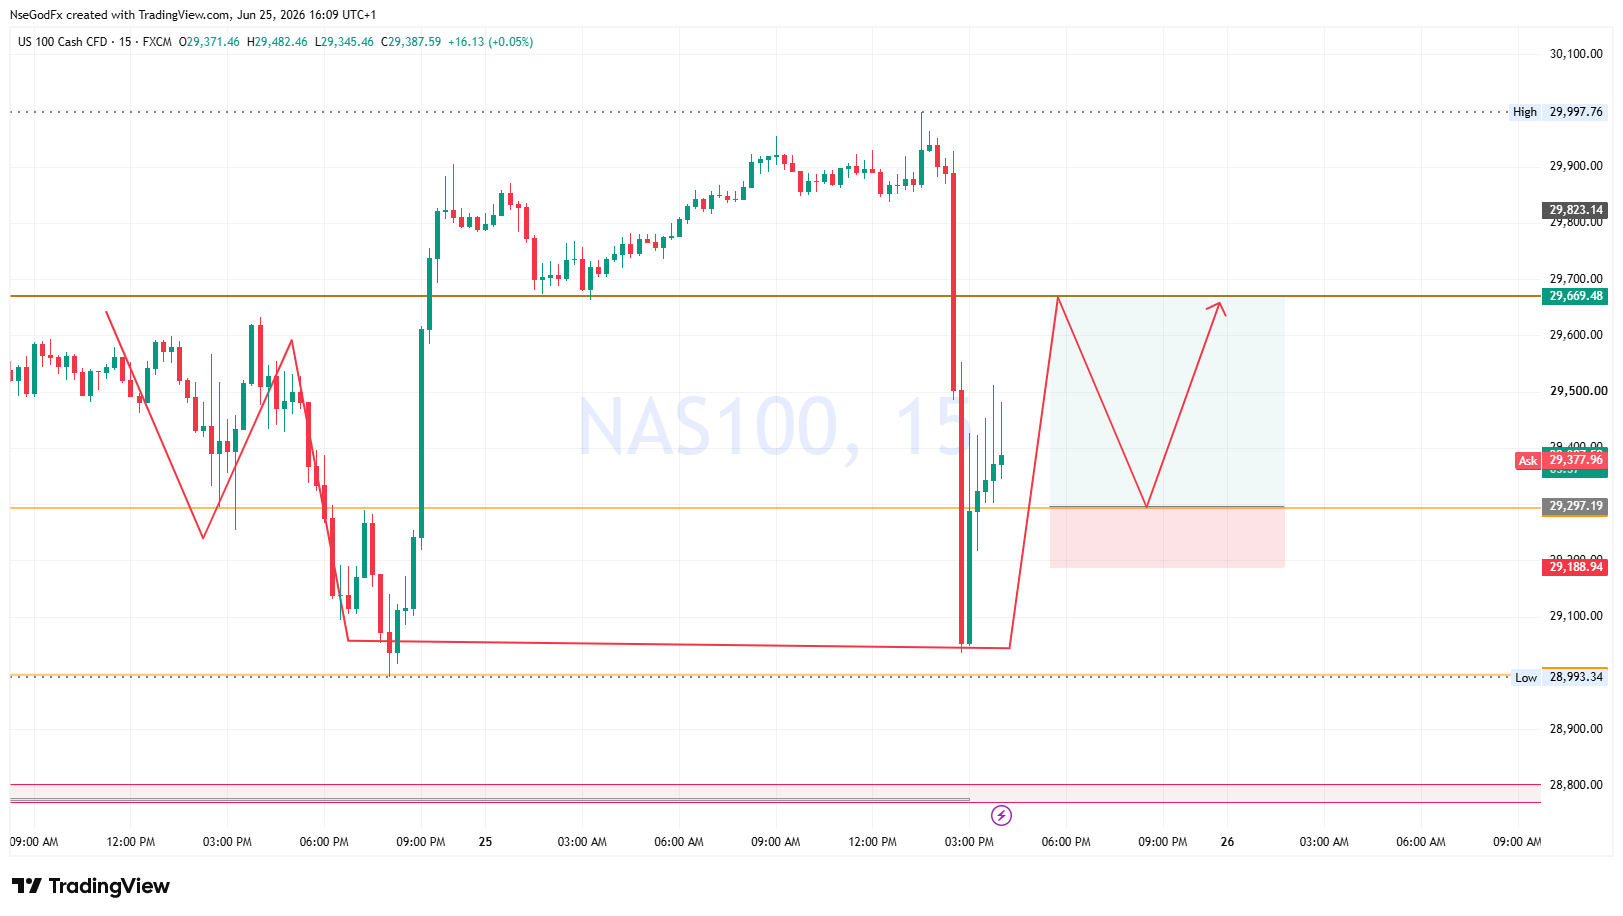
Price broke below after the accumulation @29363 level in Nas100 yesterday but later reversed with high volume candles, presently above the accumulation level @ 29935 but a break below 29697 will give further downward movement
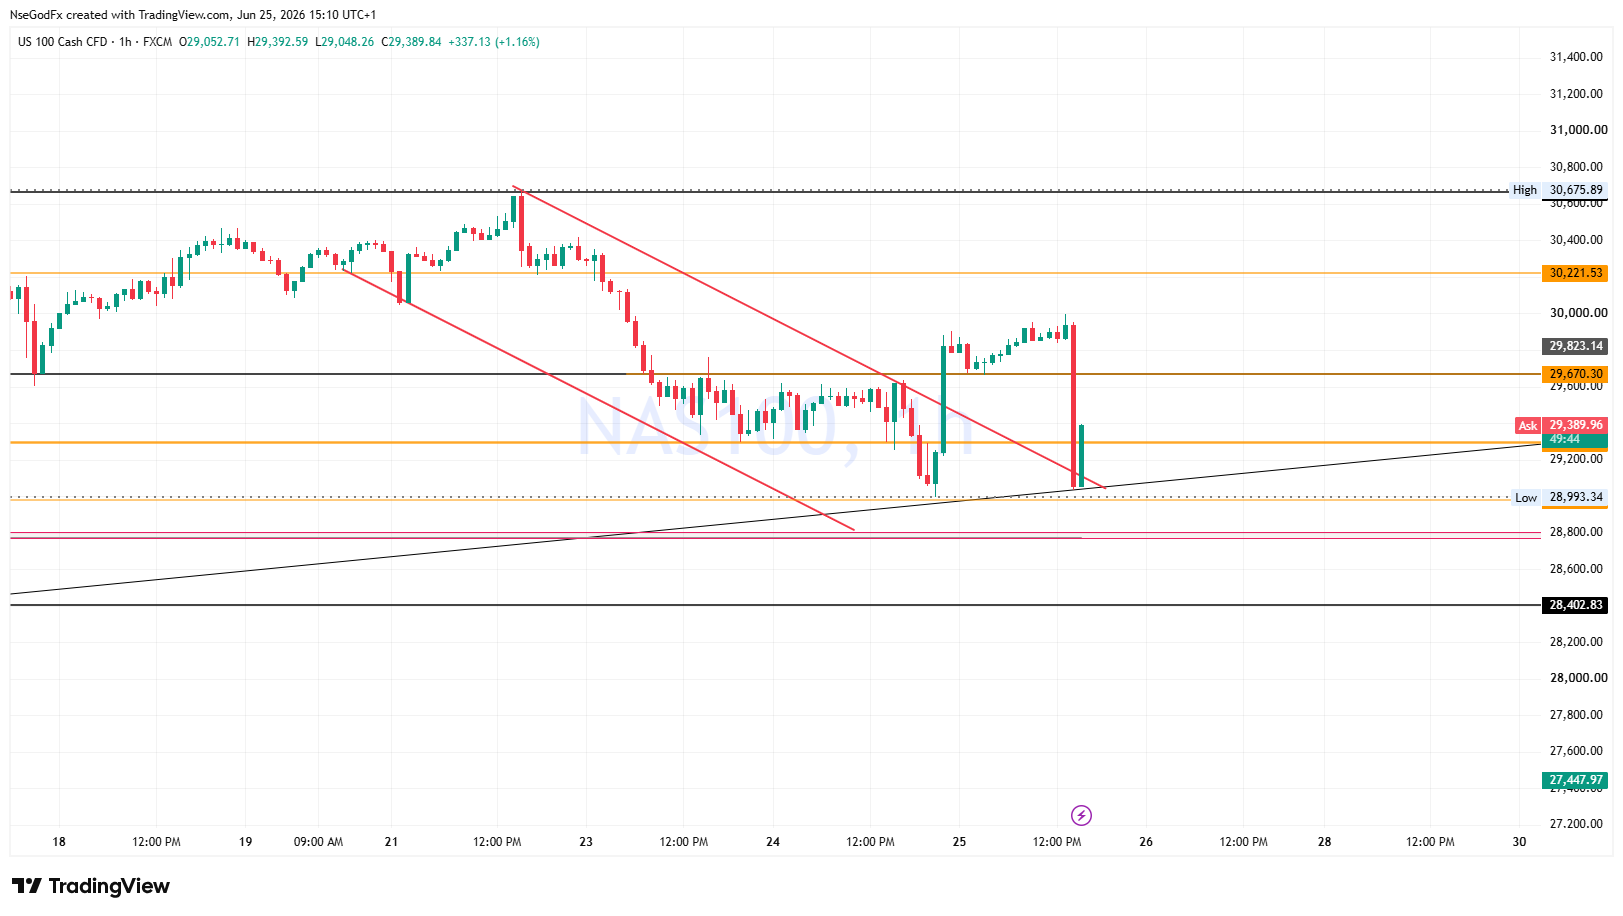
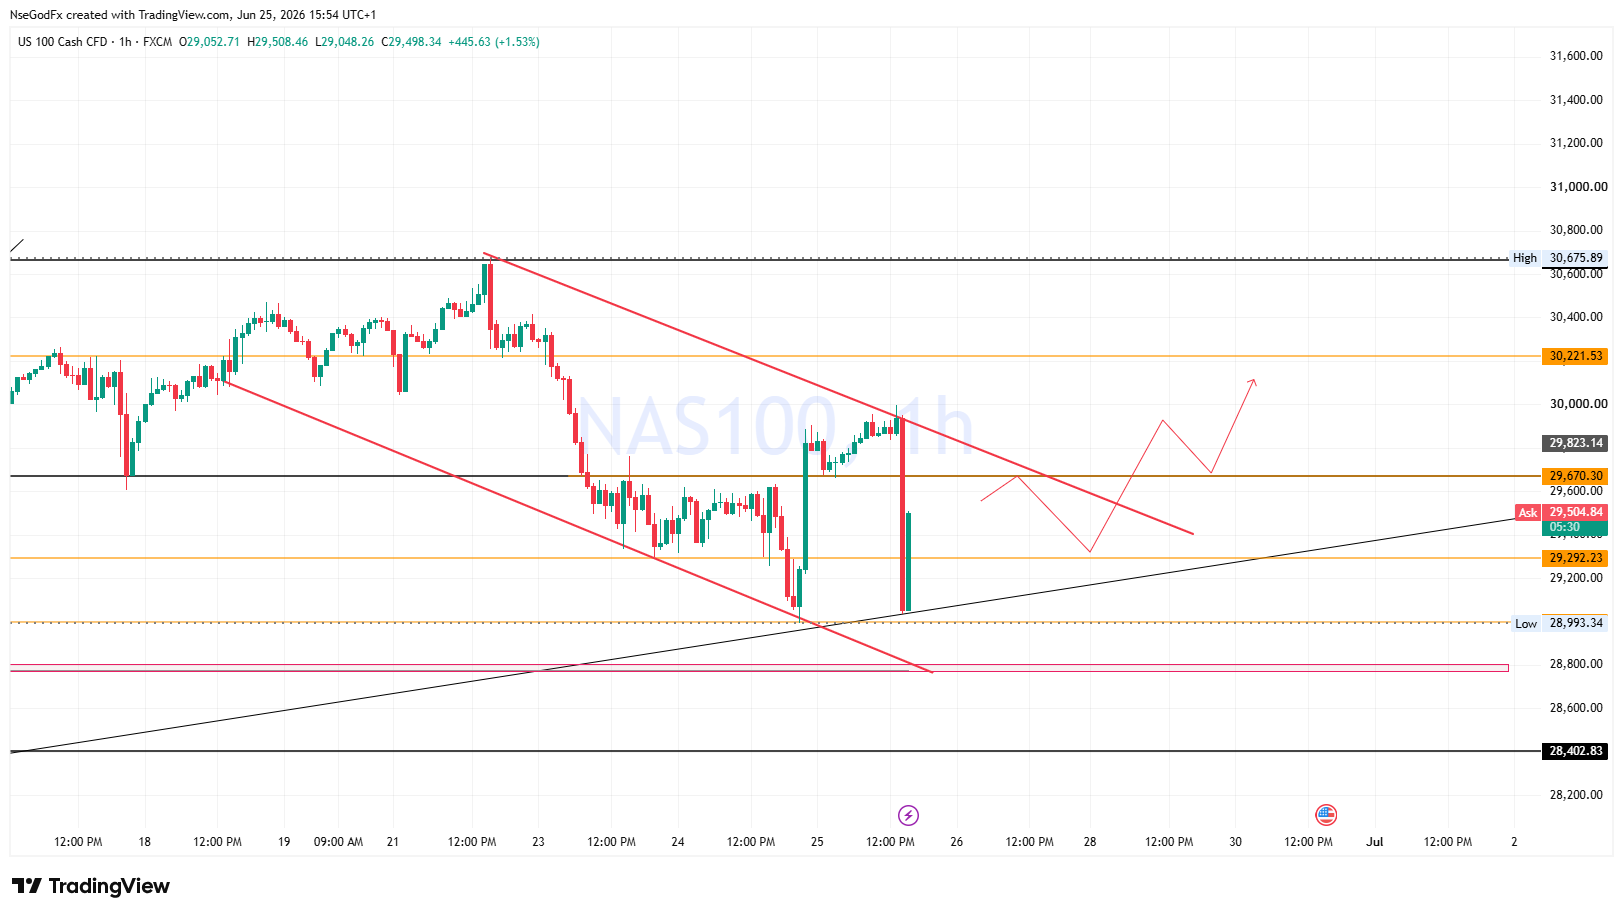
Internally, within the channel on the 1hr, I'll wait to see, if the right shoulder of the HnS, will be completed, before price drives to the next zone.
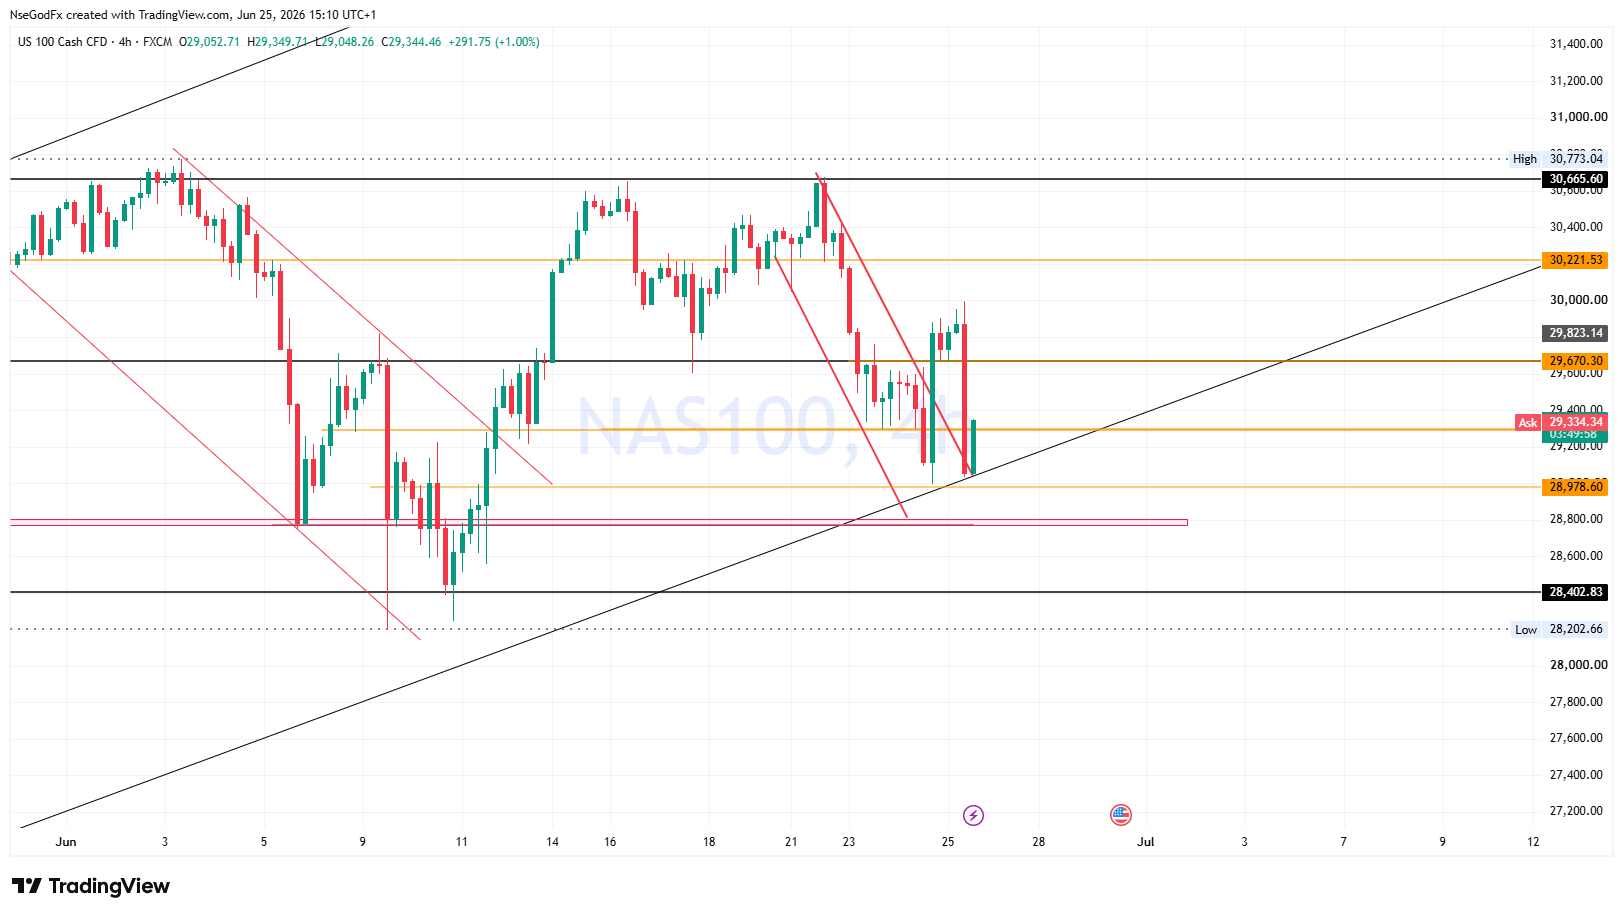
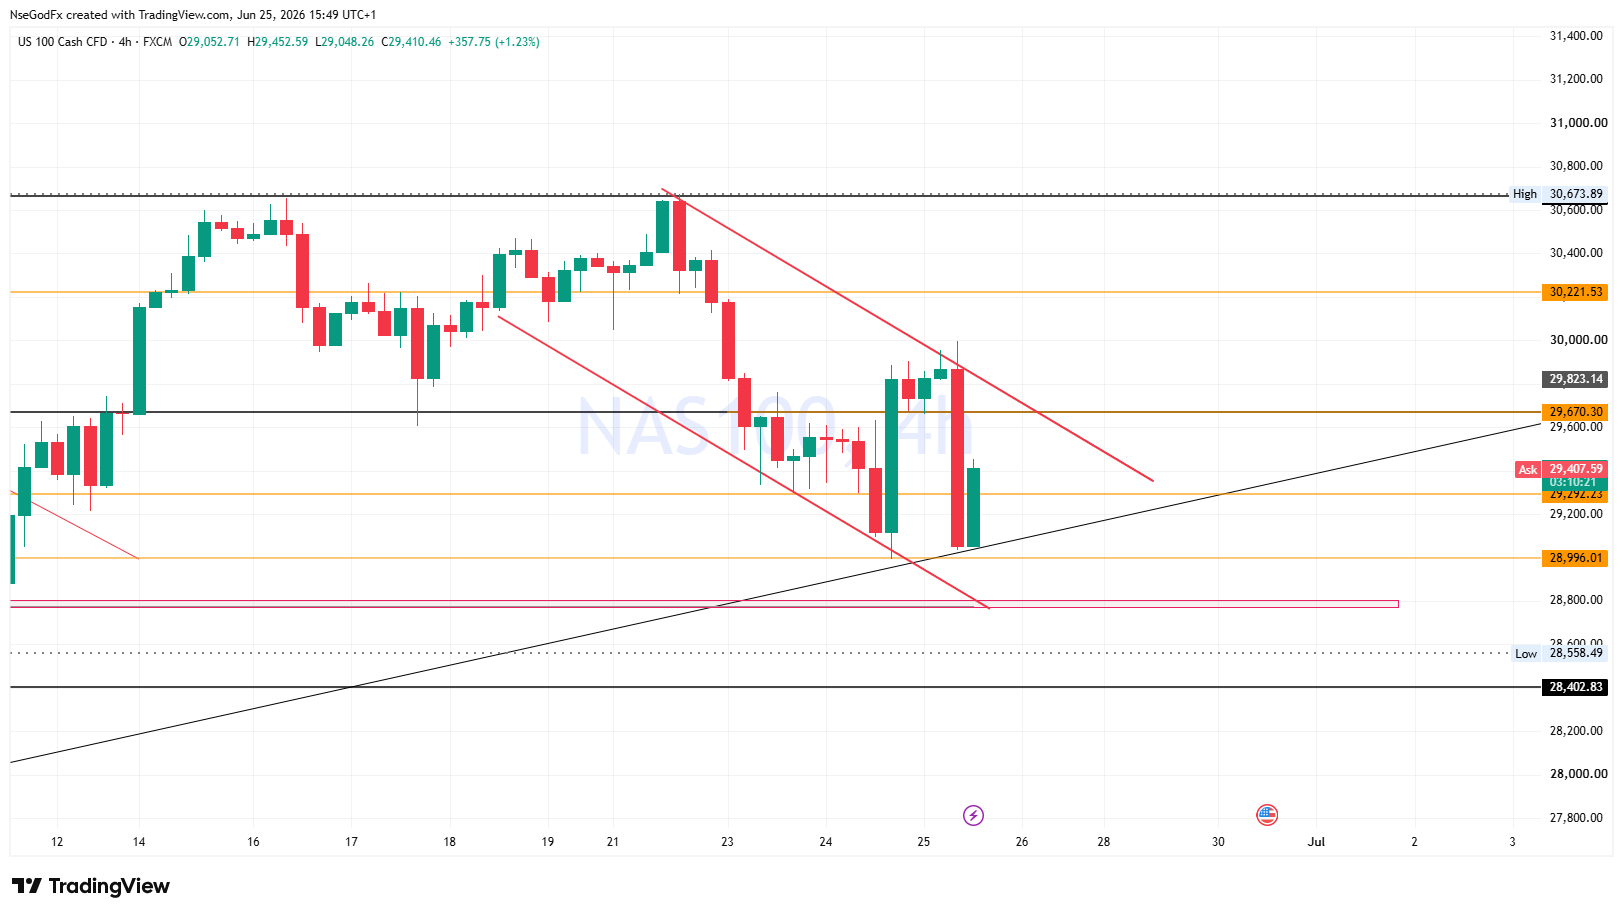
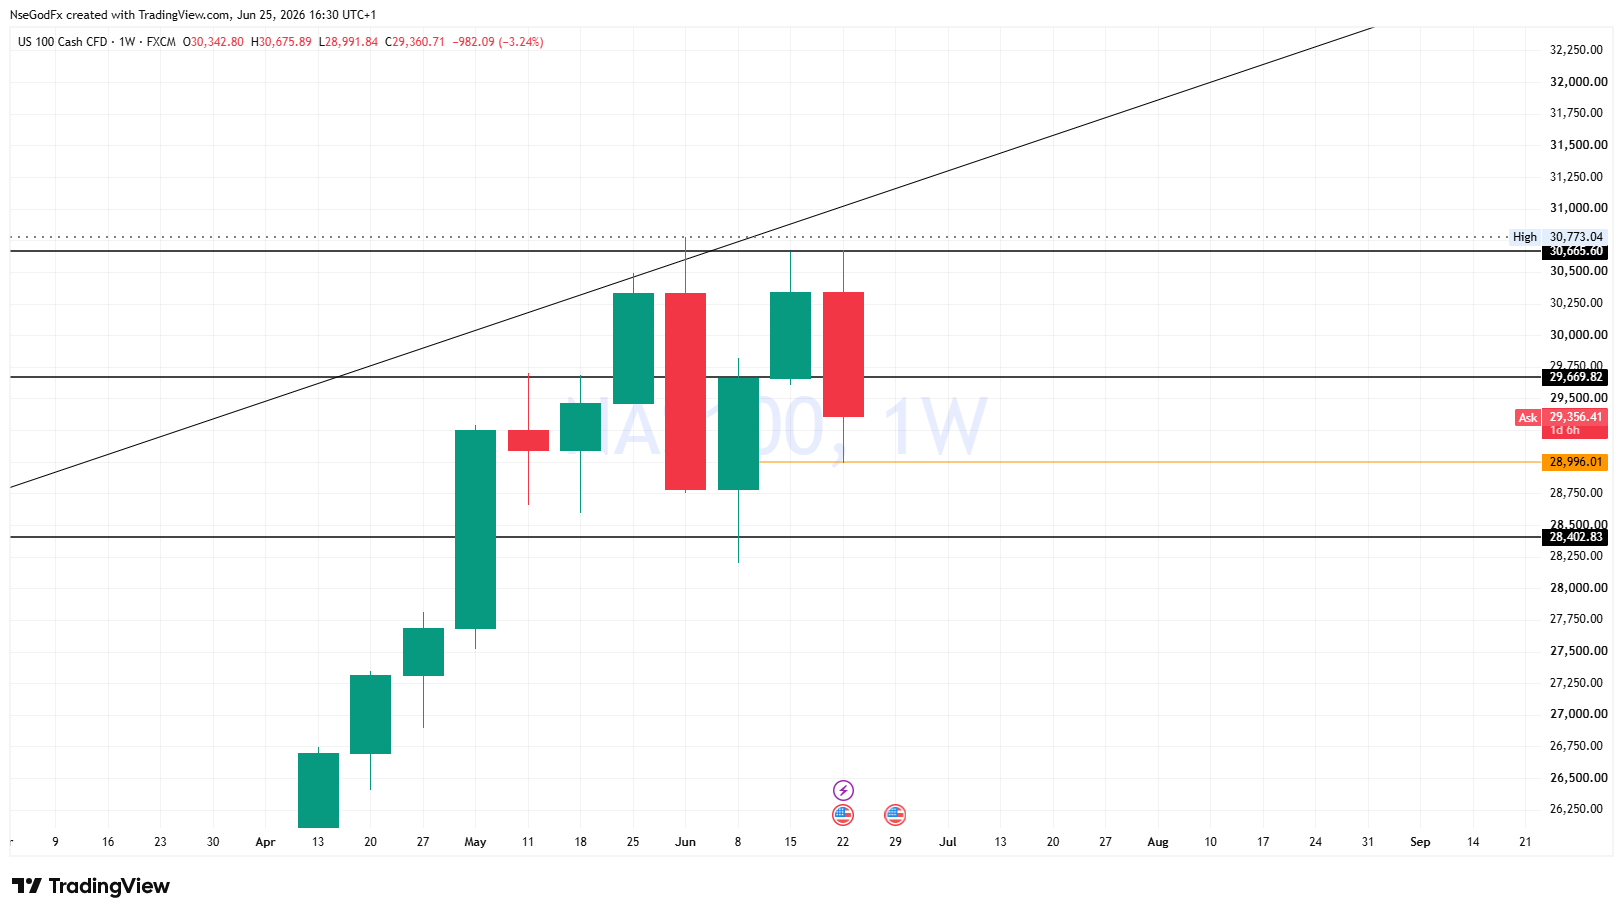
With Just one trading day left for the Weekly Candle on Nasdaq to close, the Double top bearish Chart pattern implies, Price has been unable to Break above the Price level @ 30250-30775 but has rather formed a resistance Region around it, after 5 trading Weeks.
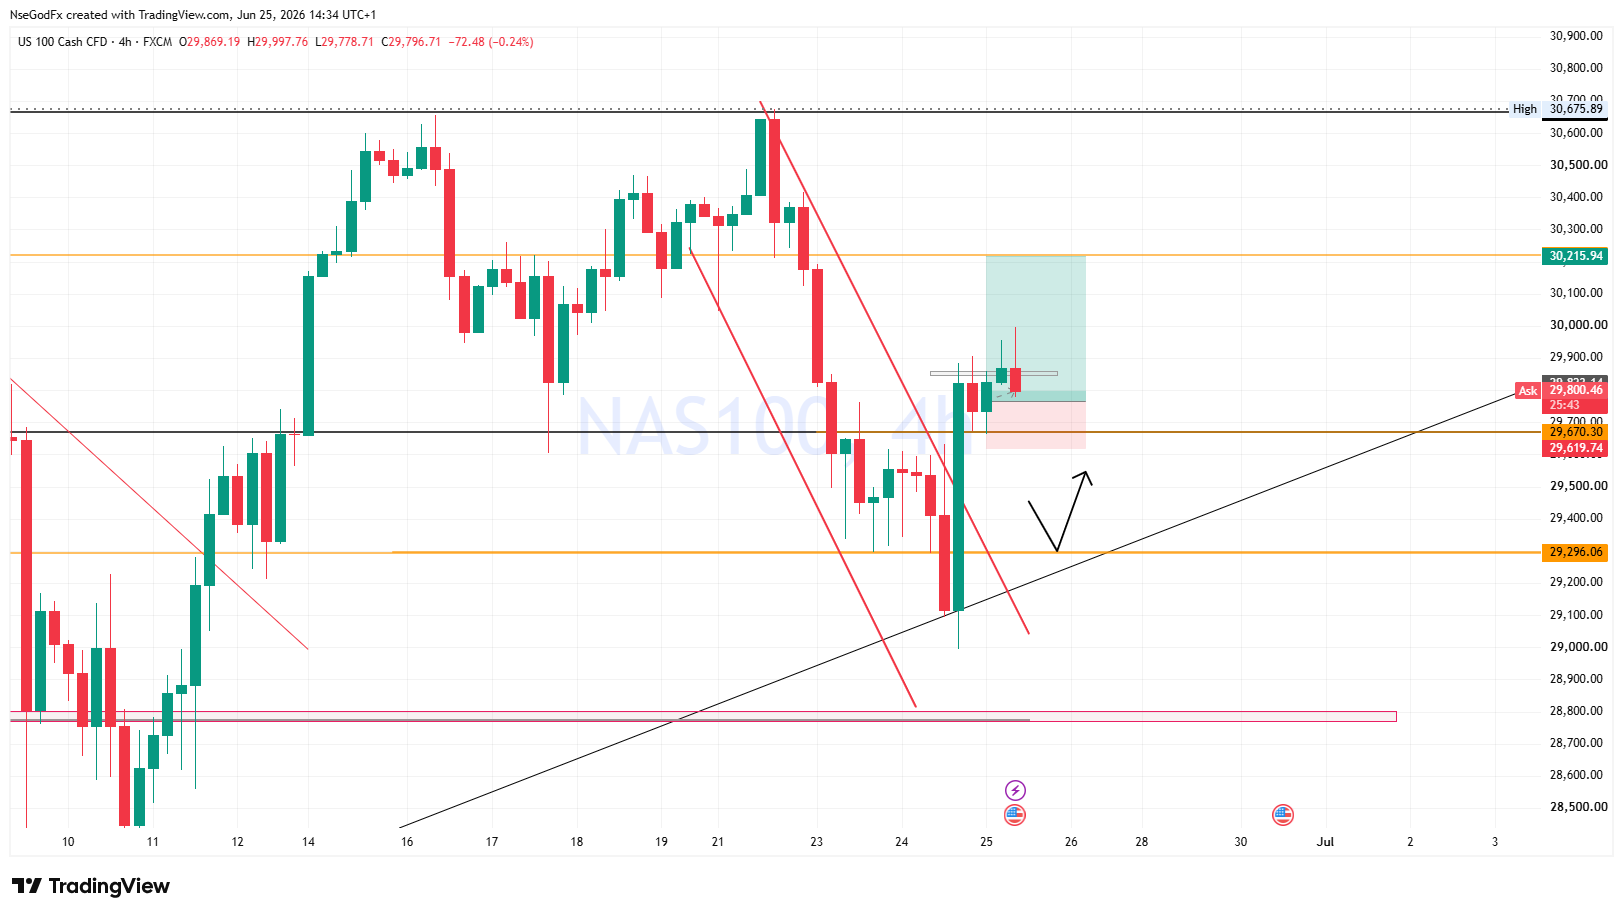
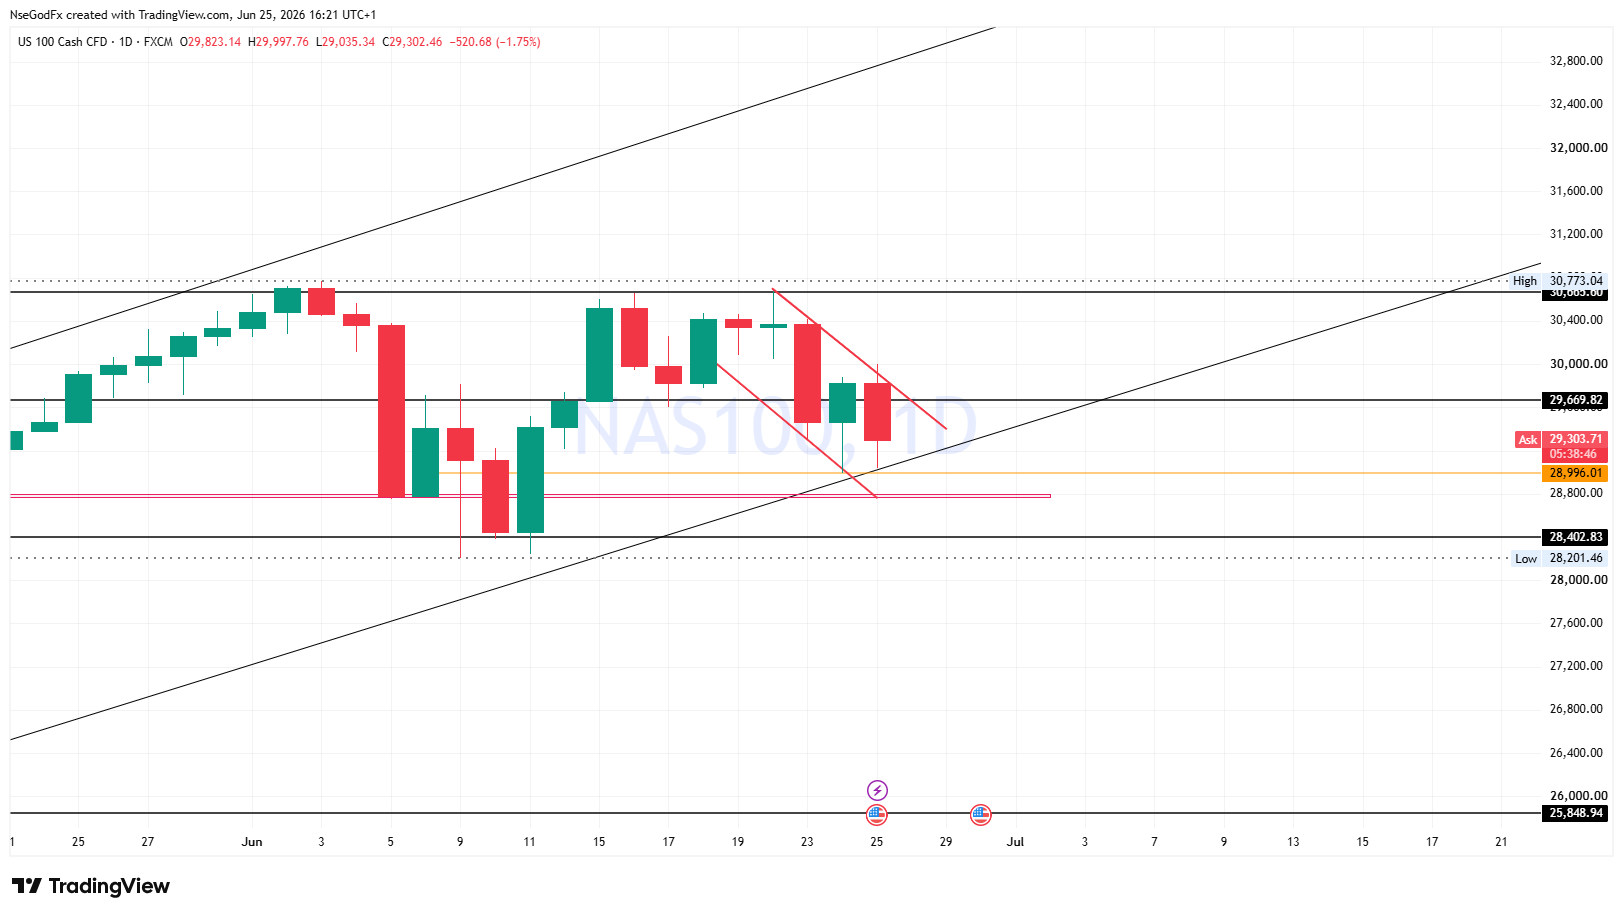
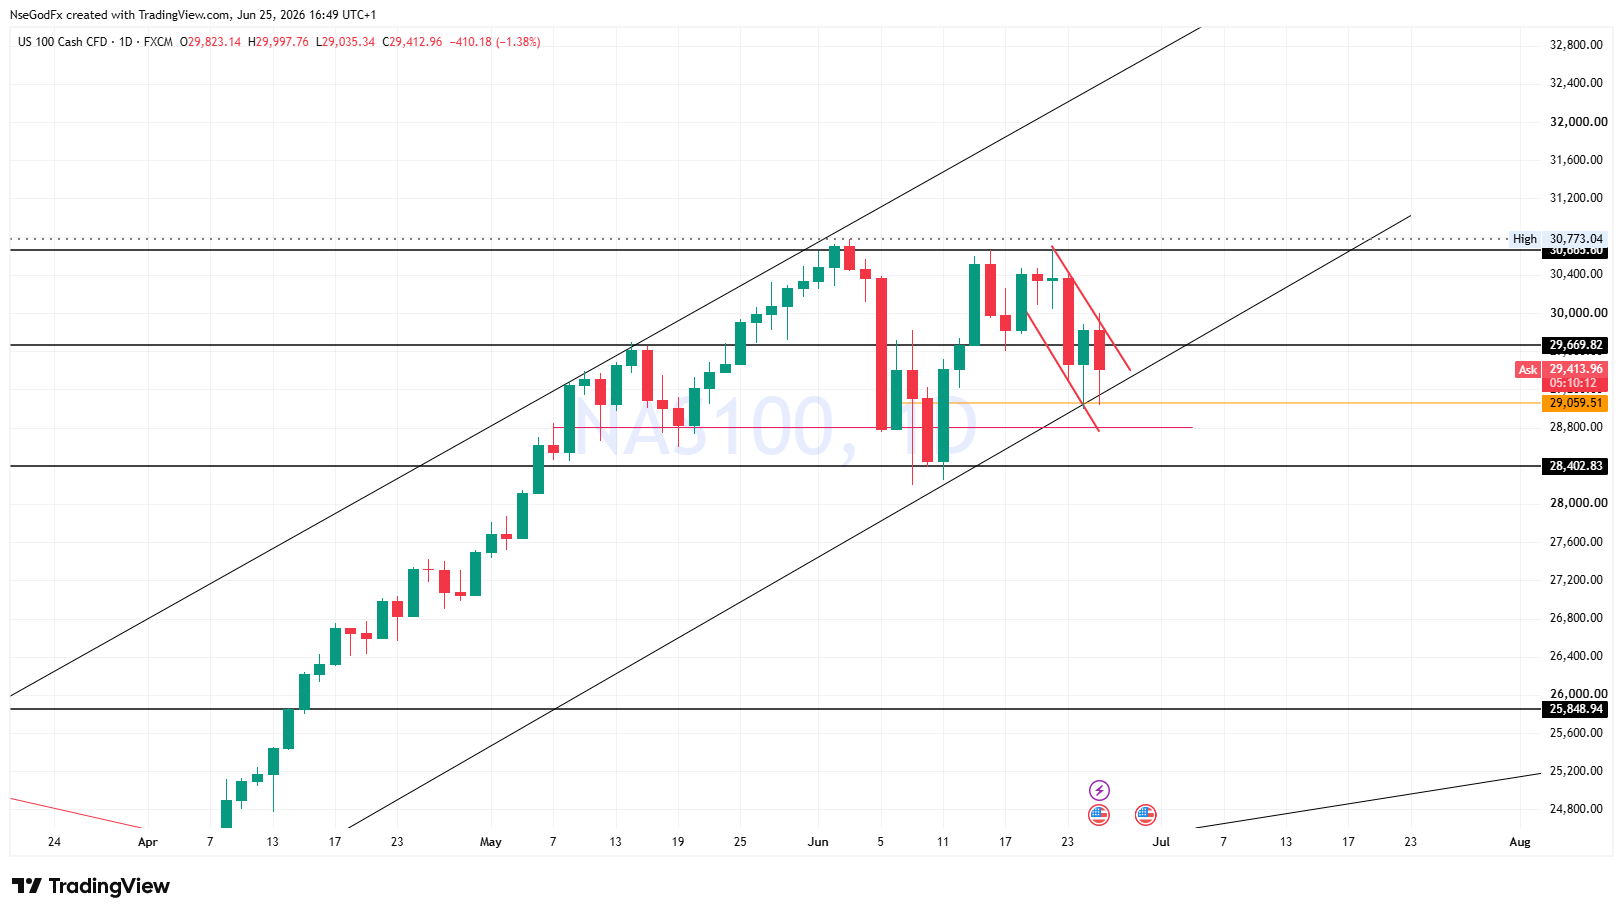
Despite the Double Top Chart Pattern imprint on the Weekly, Price is still Confined to a Daily Bullish trend Channel, having rejected twice (Wednesday and Thursday) this week at the 29000 Price level that confluence with the Trend Channel Support. This Brings me to question Price intentions next week. Whether it'll follow a further decline, or Make a U-turn to the upside!