NASDAQ weekly Projections

N
@nsg_usd - 1 month ago

Yesterday... i took the buys, but didn't close out on time. Still expected buys today, but later closed out today.

N
@nsg_usd - 1 month ago

There where many possible entry scenarios for the buys re entry. Had to seat on my hands today.

N
@nsg_usd - 1 month ago

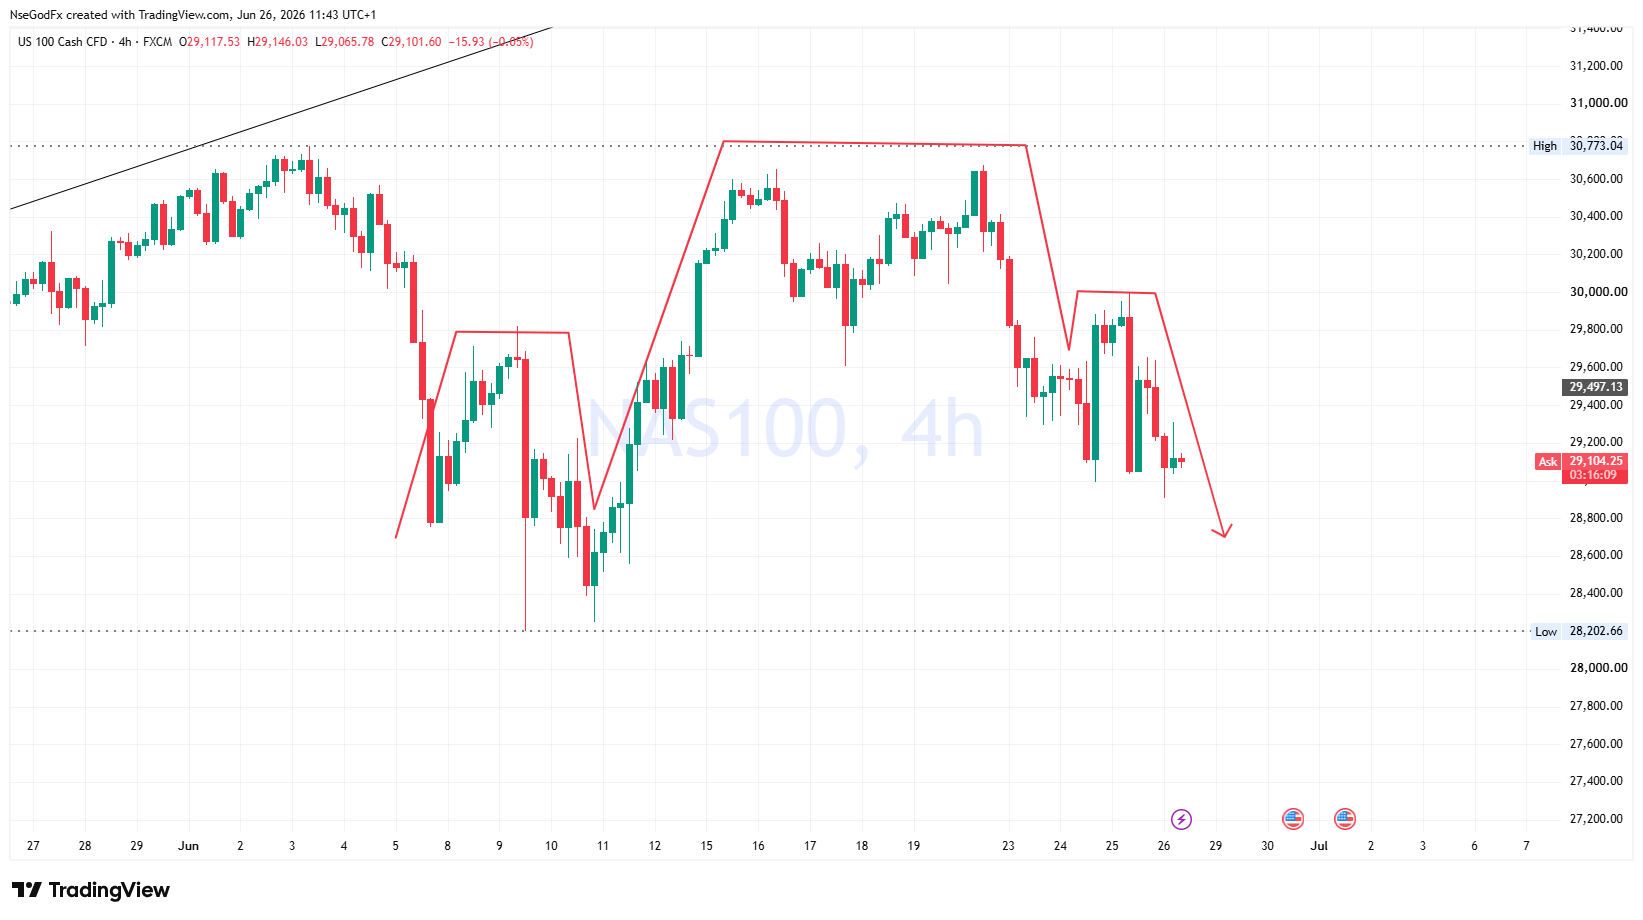
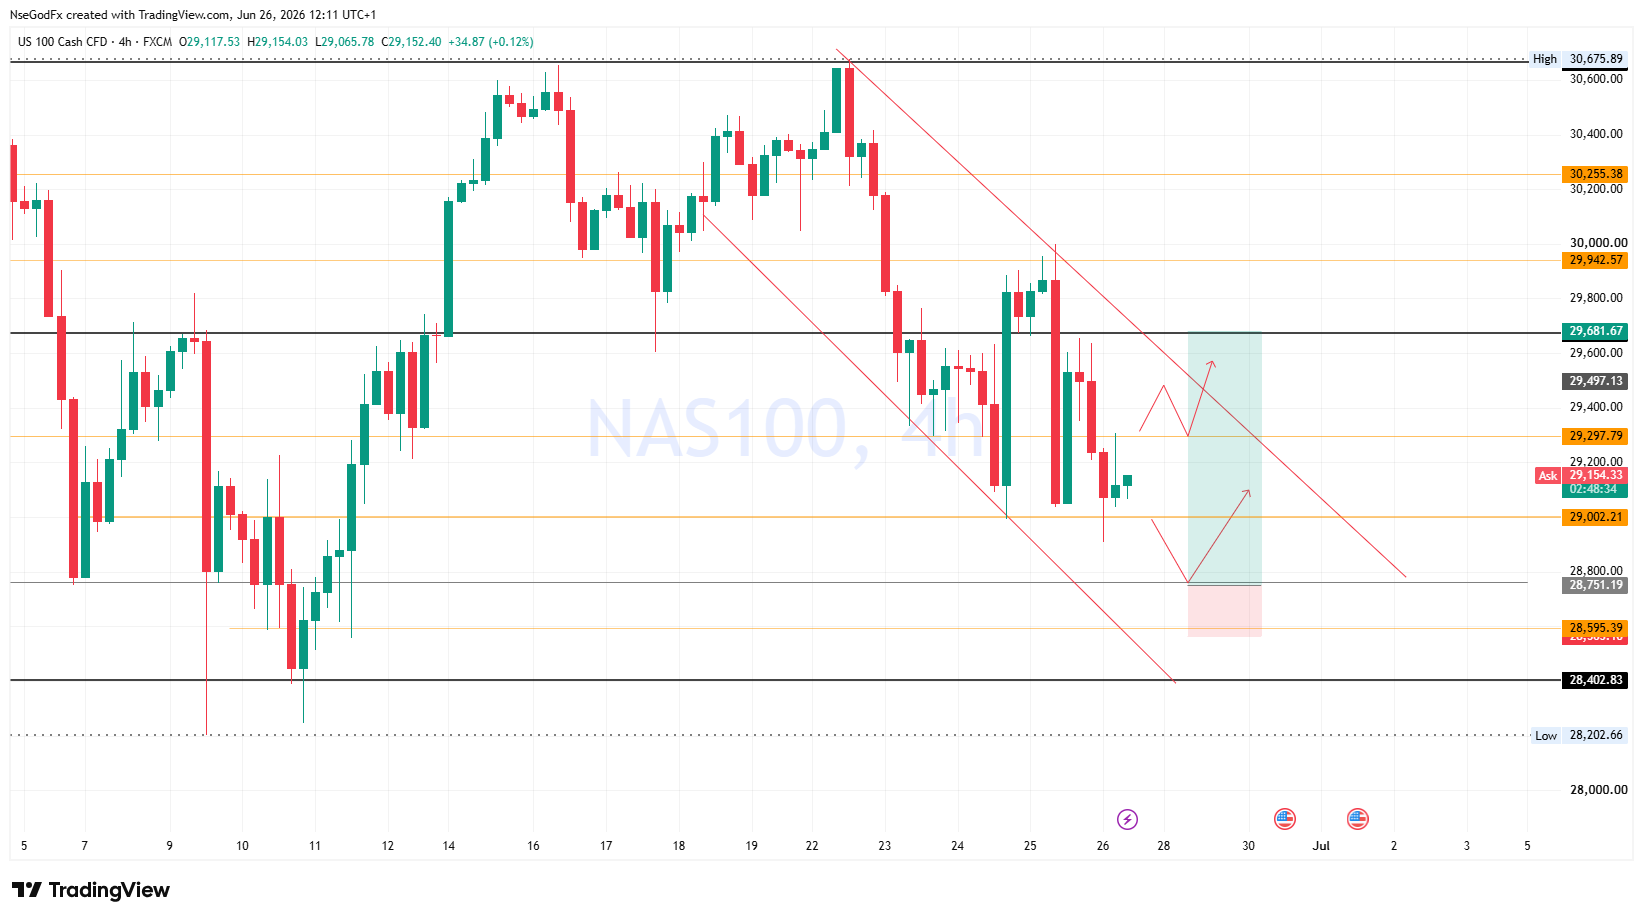
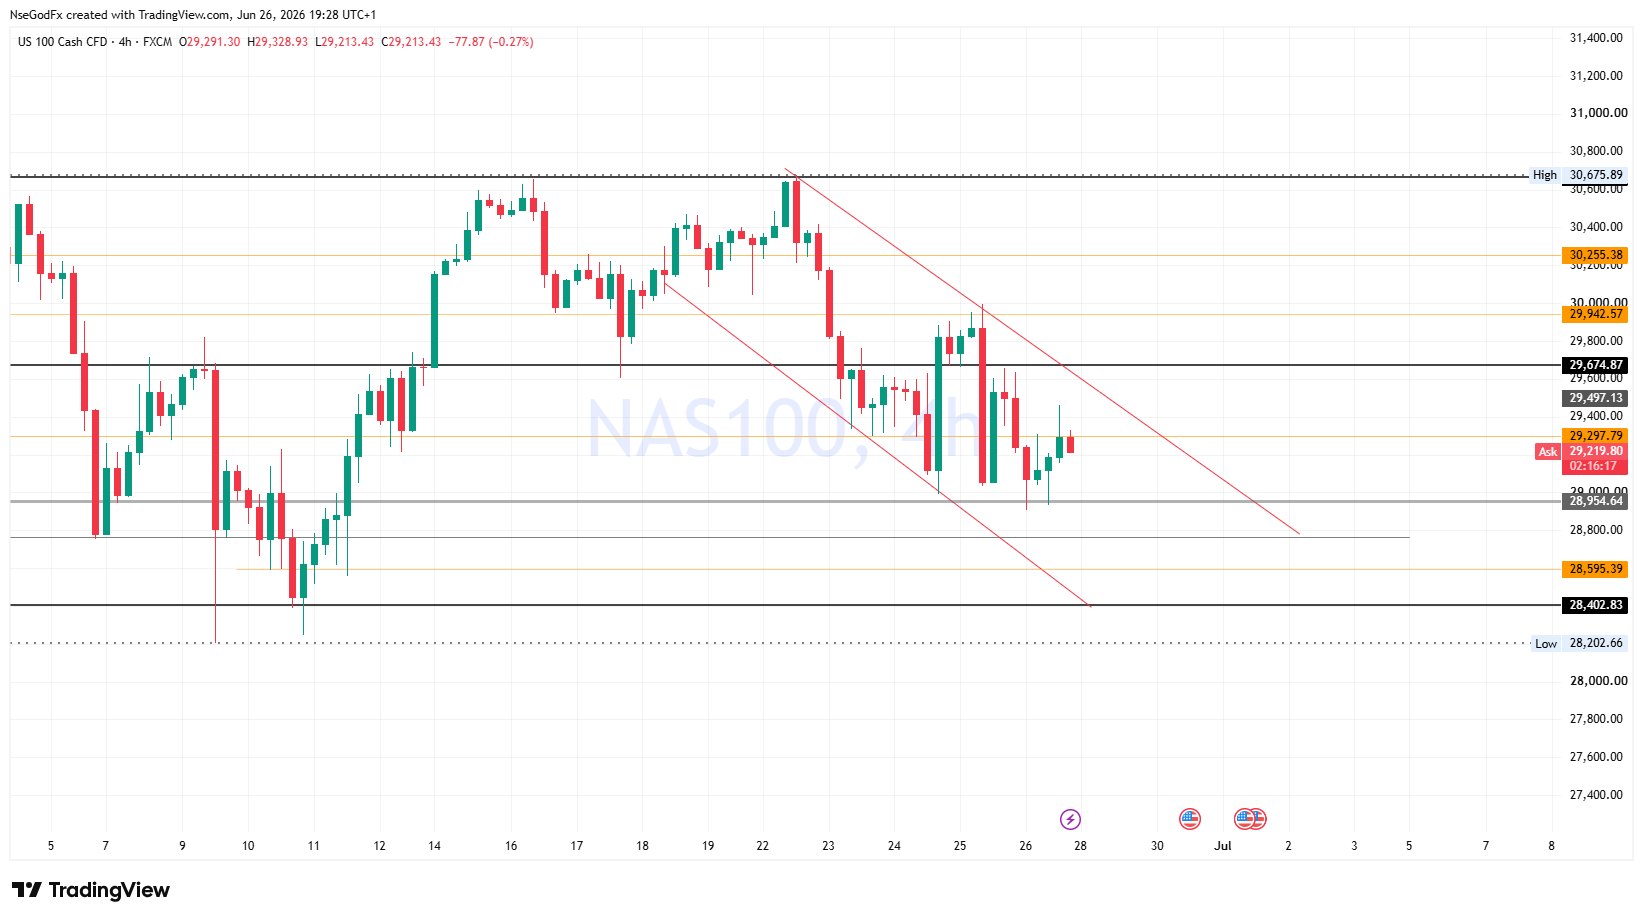
Overall on 4hr, this is the Pattern Imprint price has been trying to complete.

N
@nsg_usd - 1 month ago

I was still expecting price to push down to complete the pattern at 28,751 region, but later spotted reason why it's being stuck at the Trend support.

N
@nsg_usd - 1 month ago

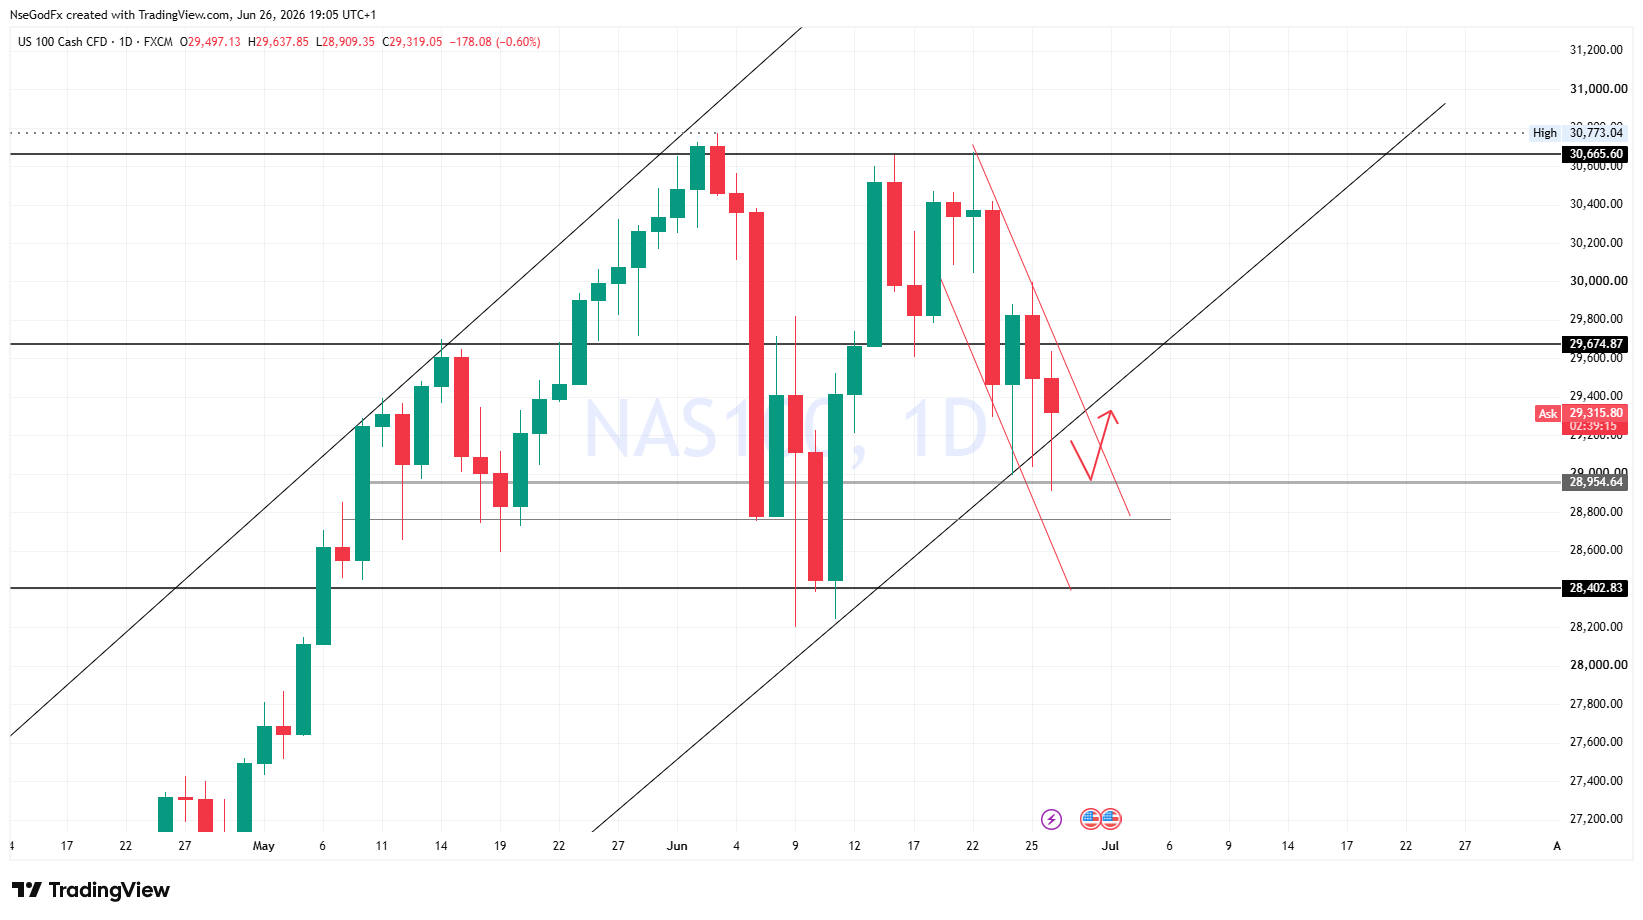
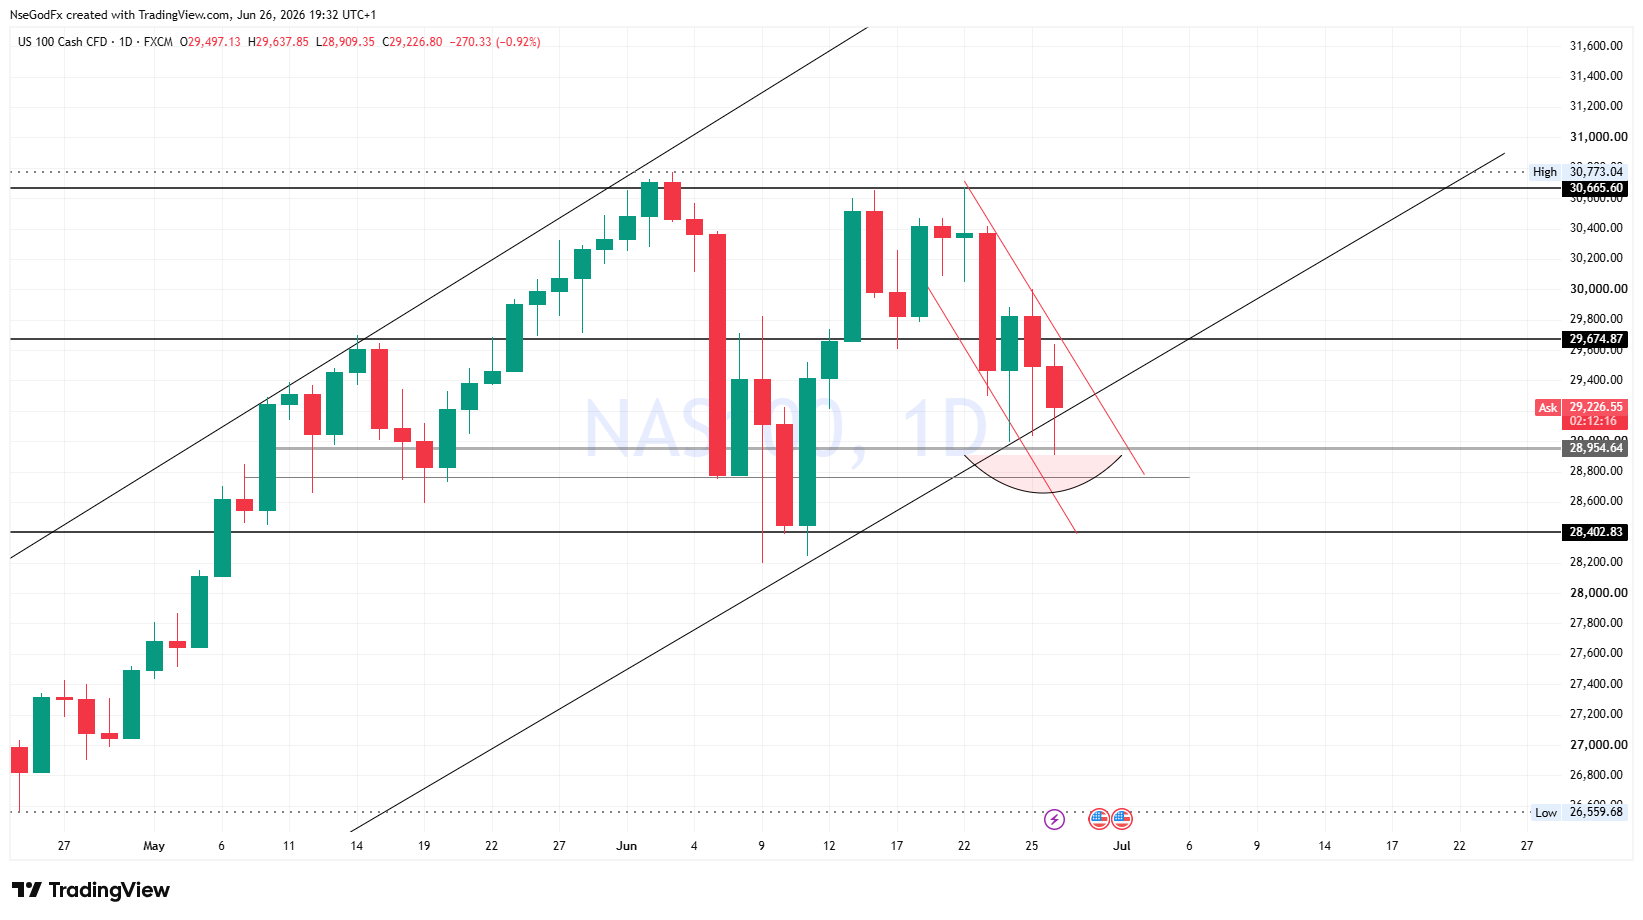
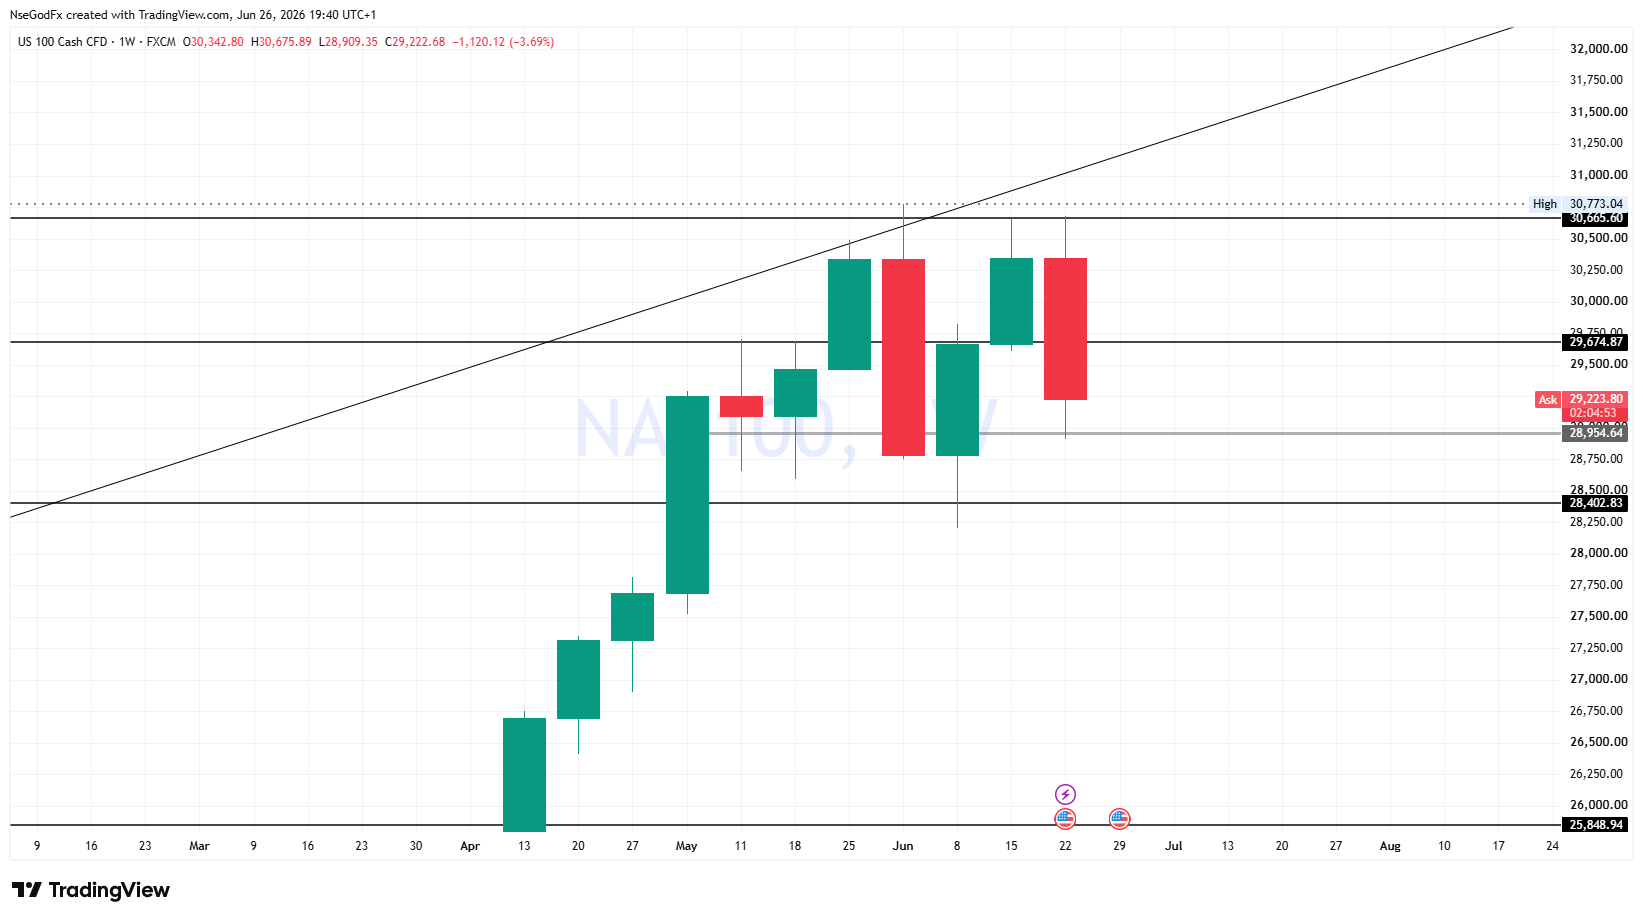
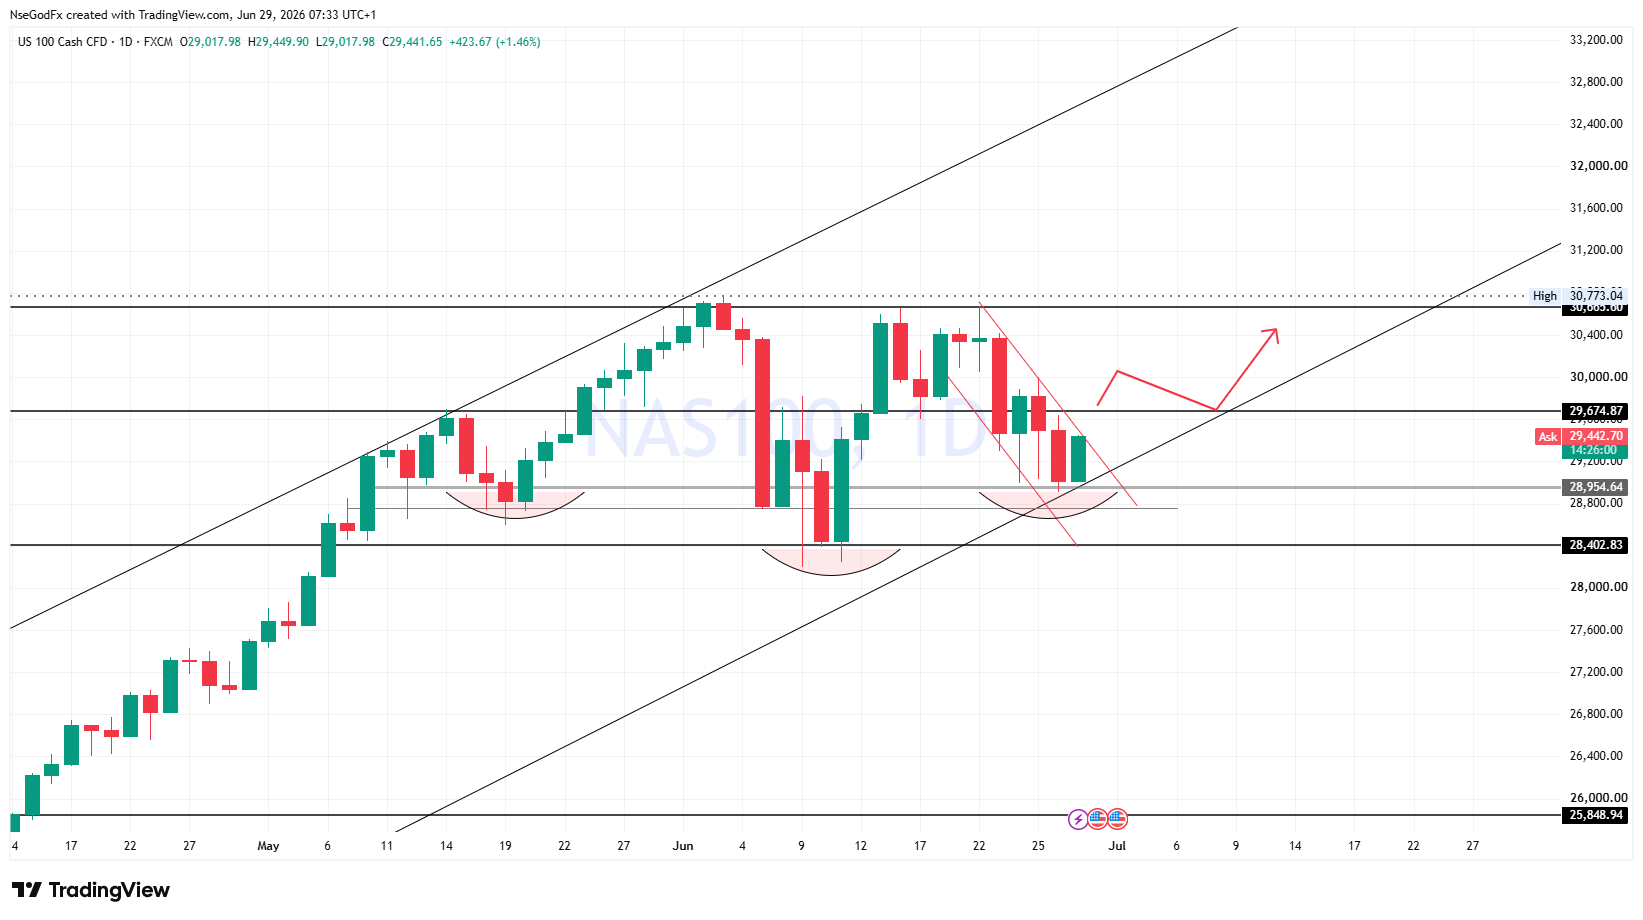
A Daily internal Support Zone @ 28954-29000 region that confluence with the Trend support has been holding price hostage, from pushing down further.

N
@nsg_usd - 1 month ago

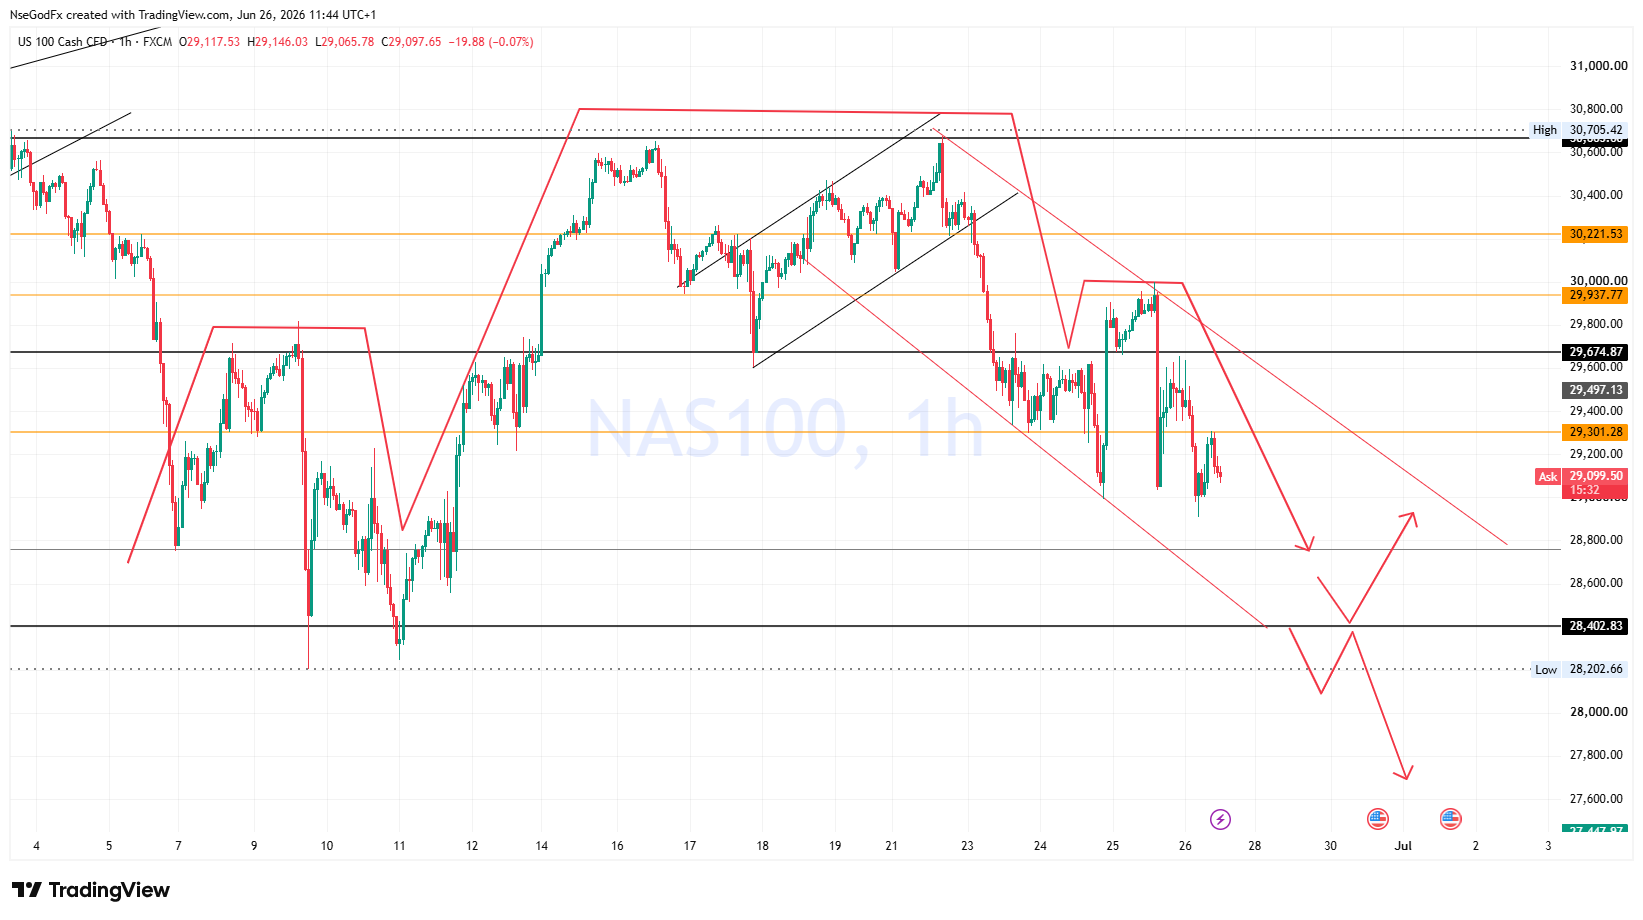
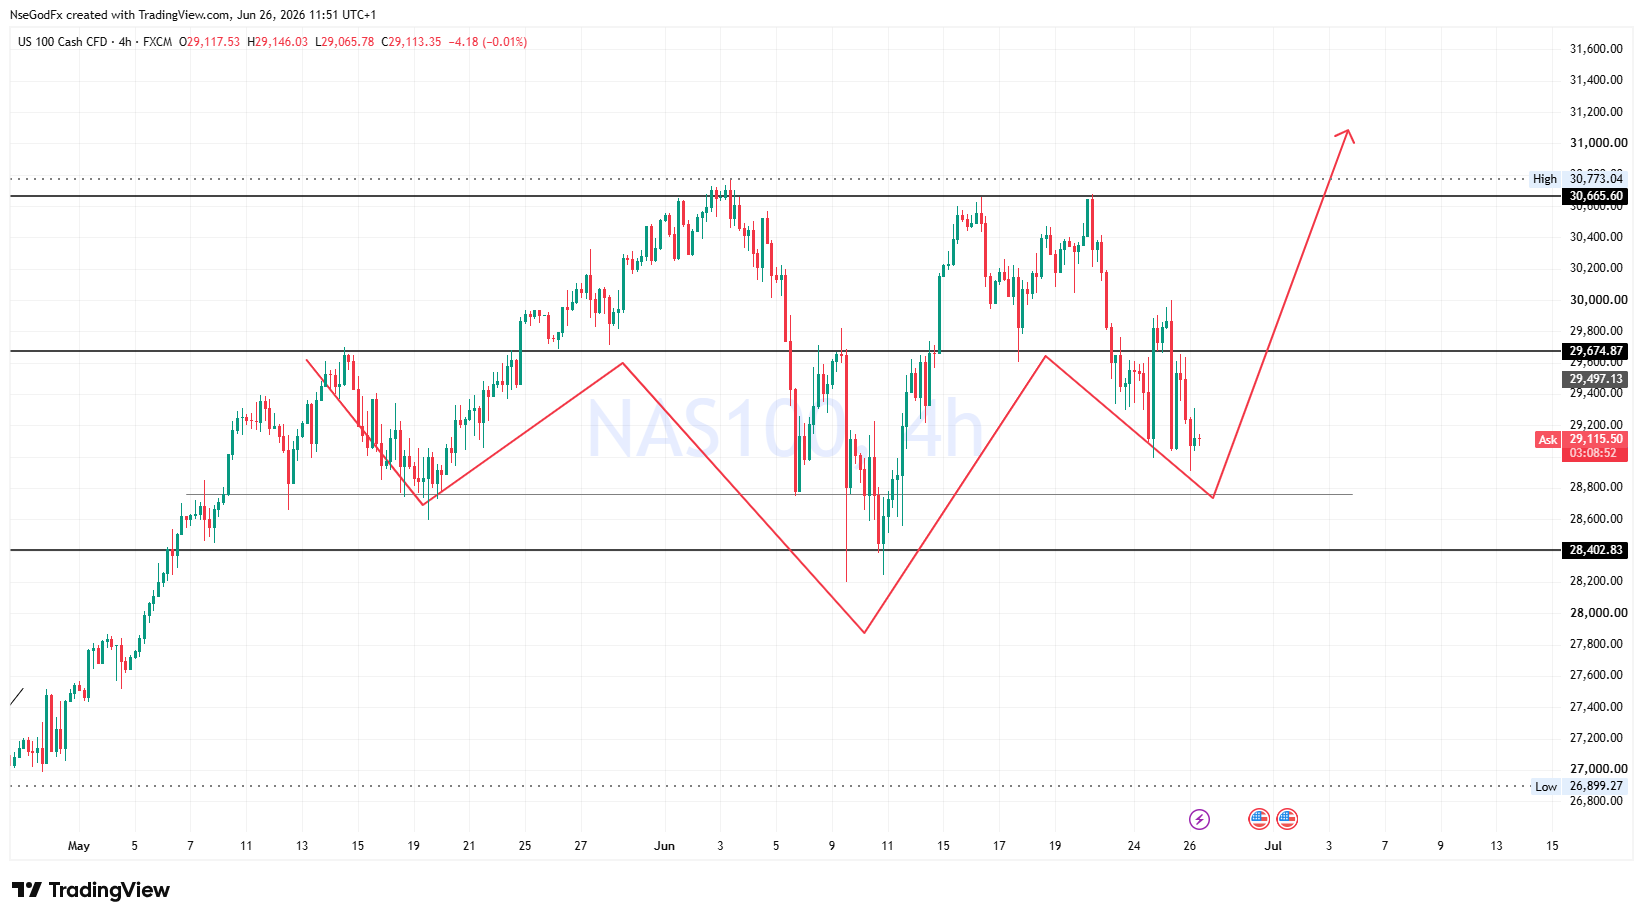
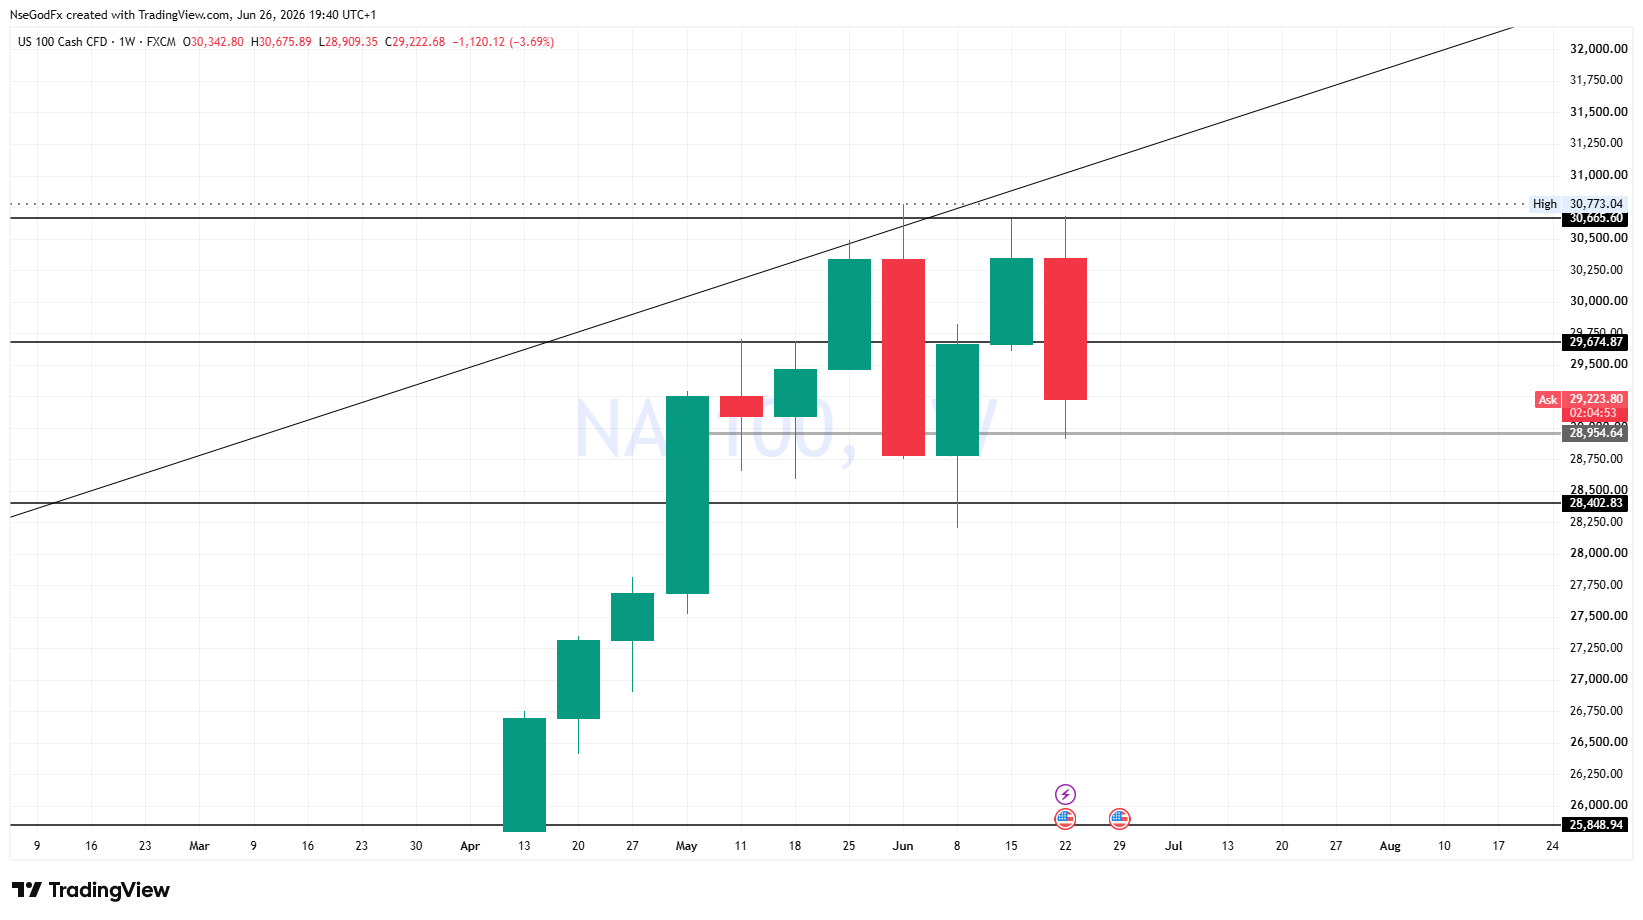
Price is also trying to complete this Inverted Head and Shoulder pattern. This can possibly invalidate the Weekly Double Top, Next week.

N
@nsg_usd - 1 month ago

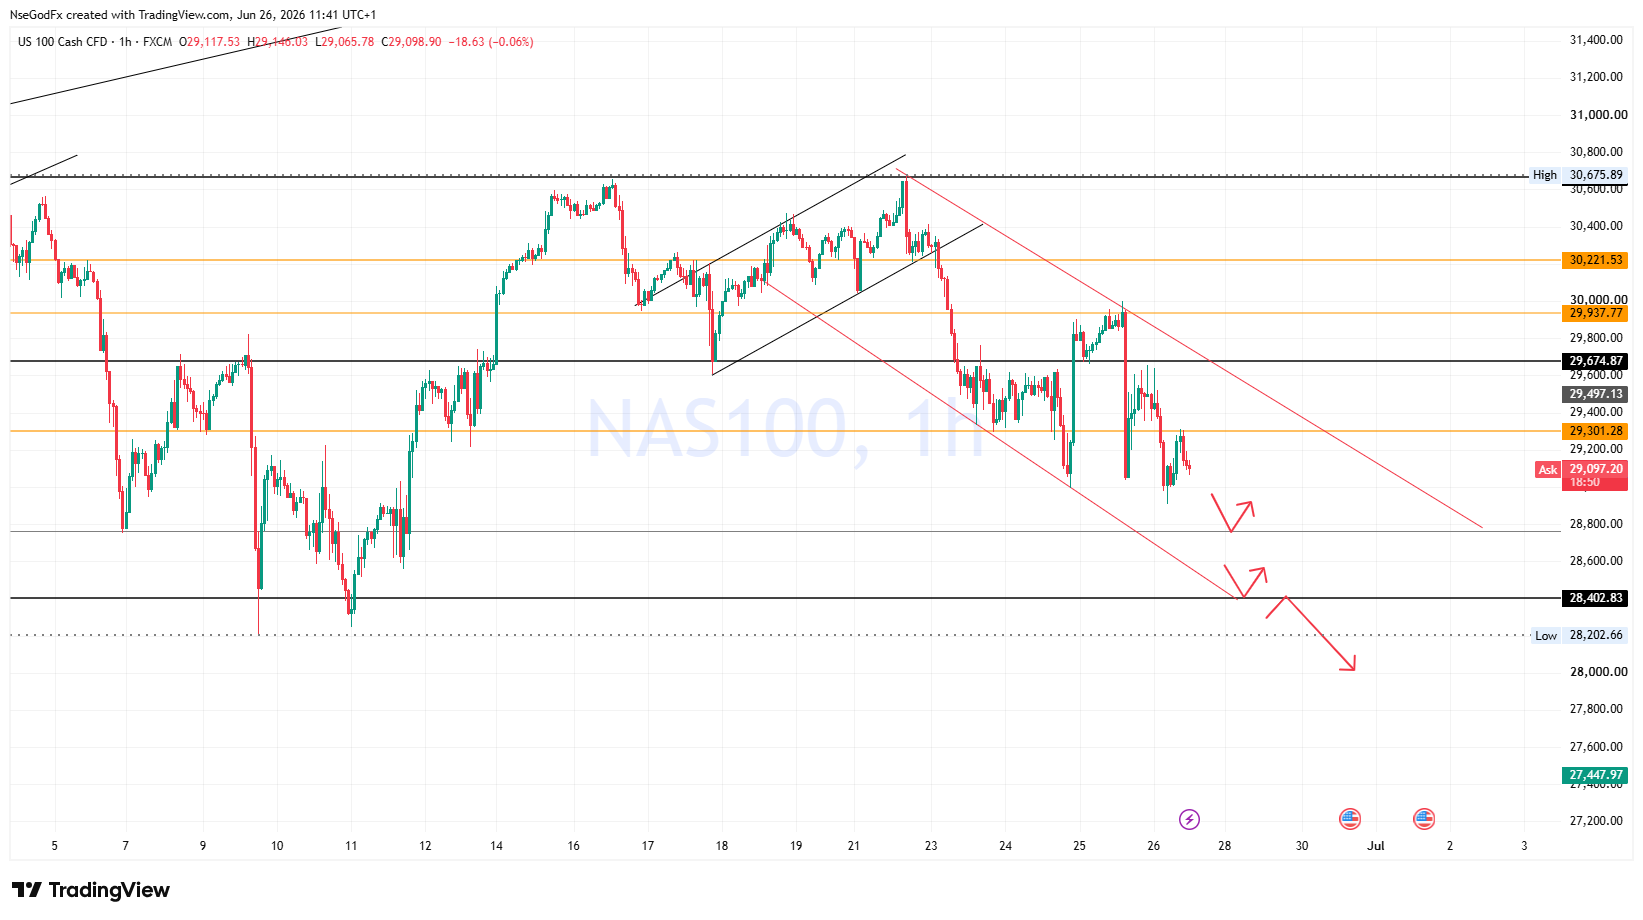
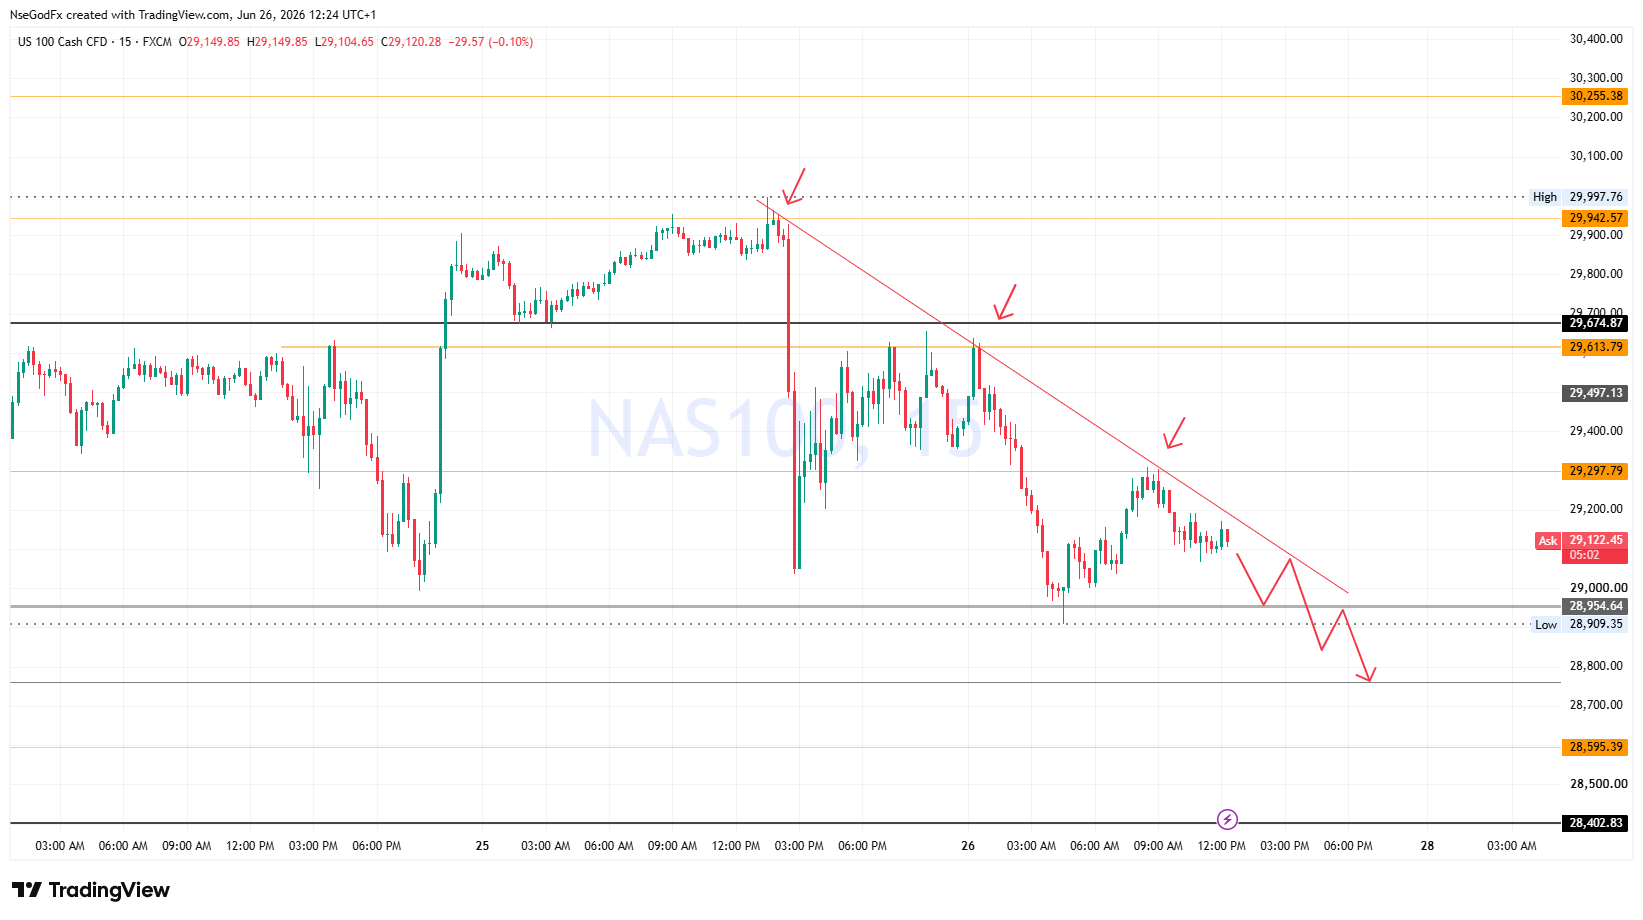
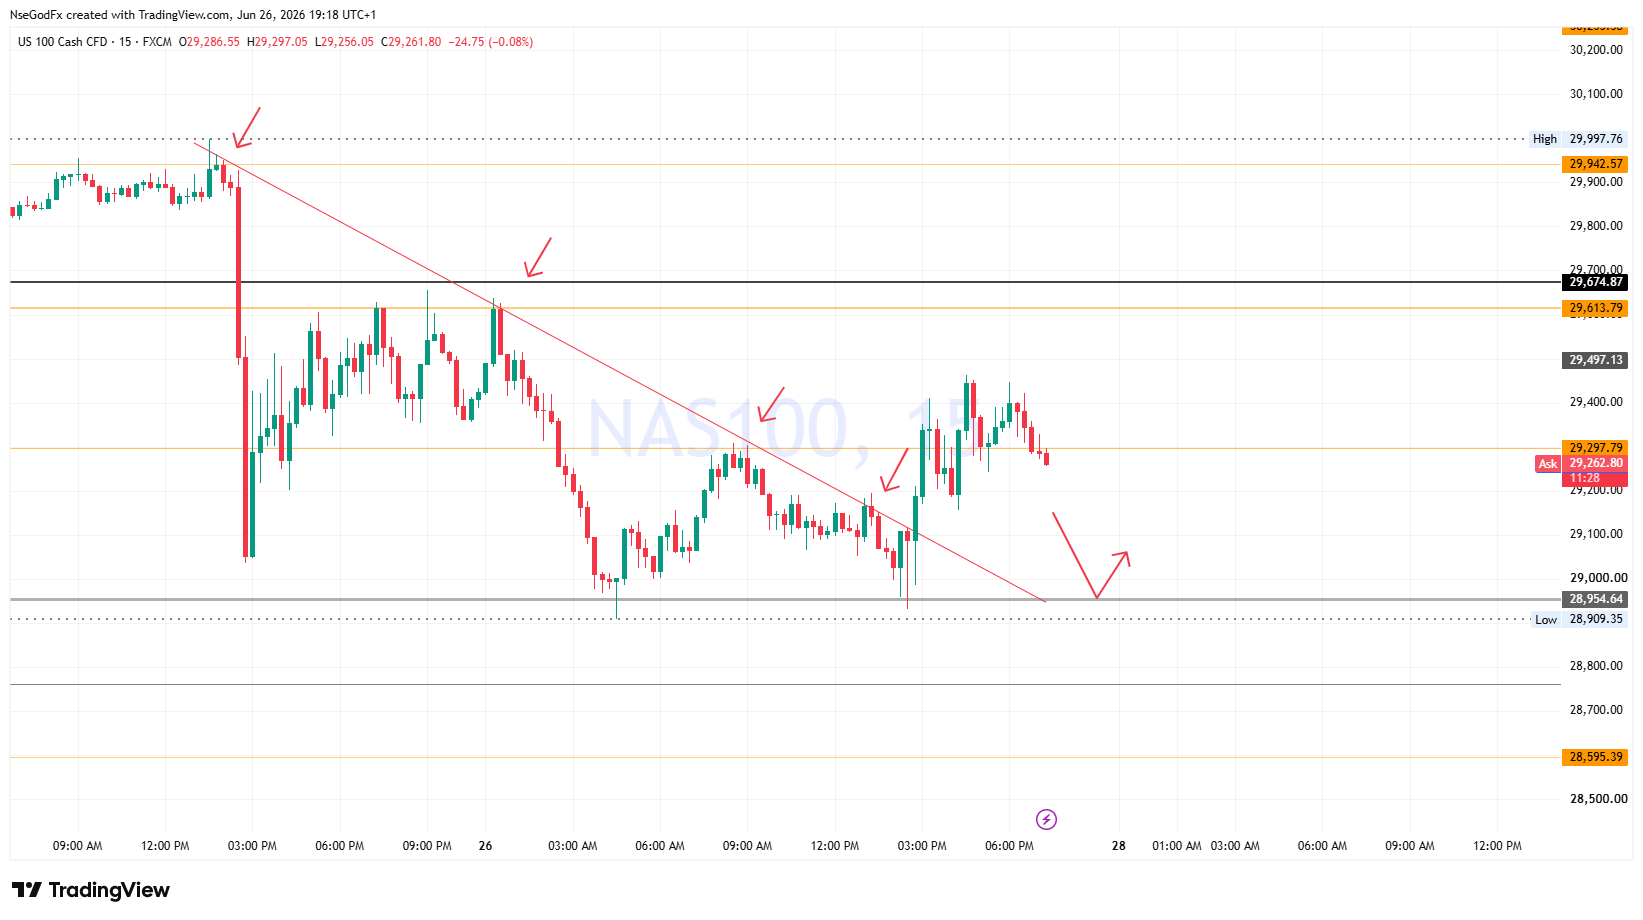
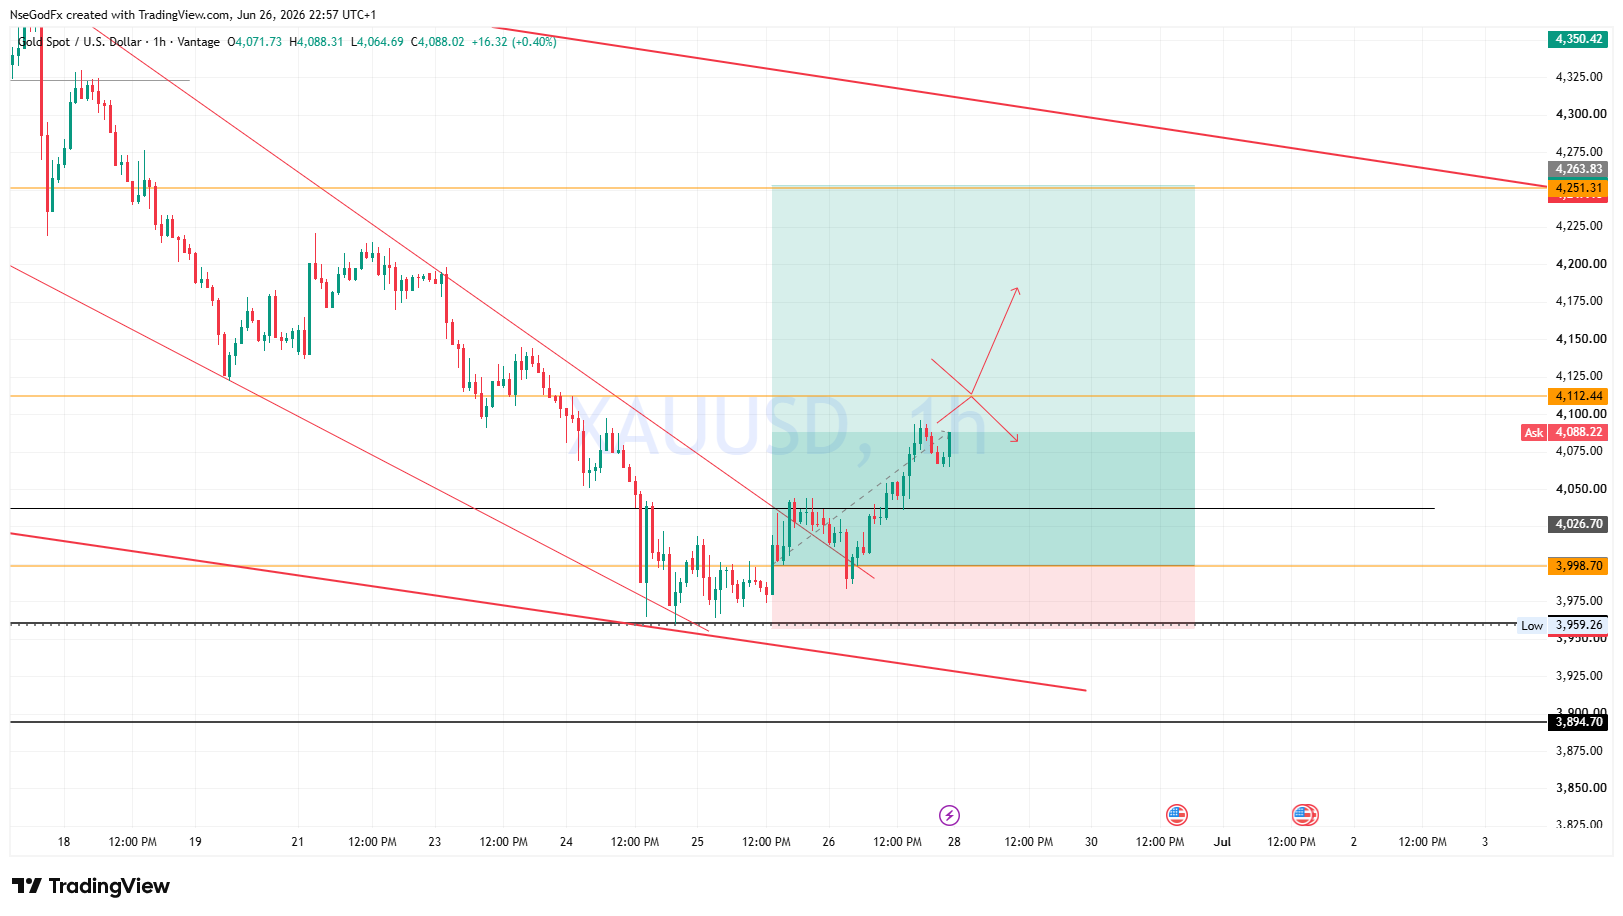
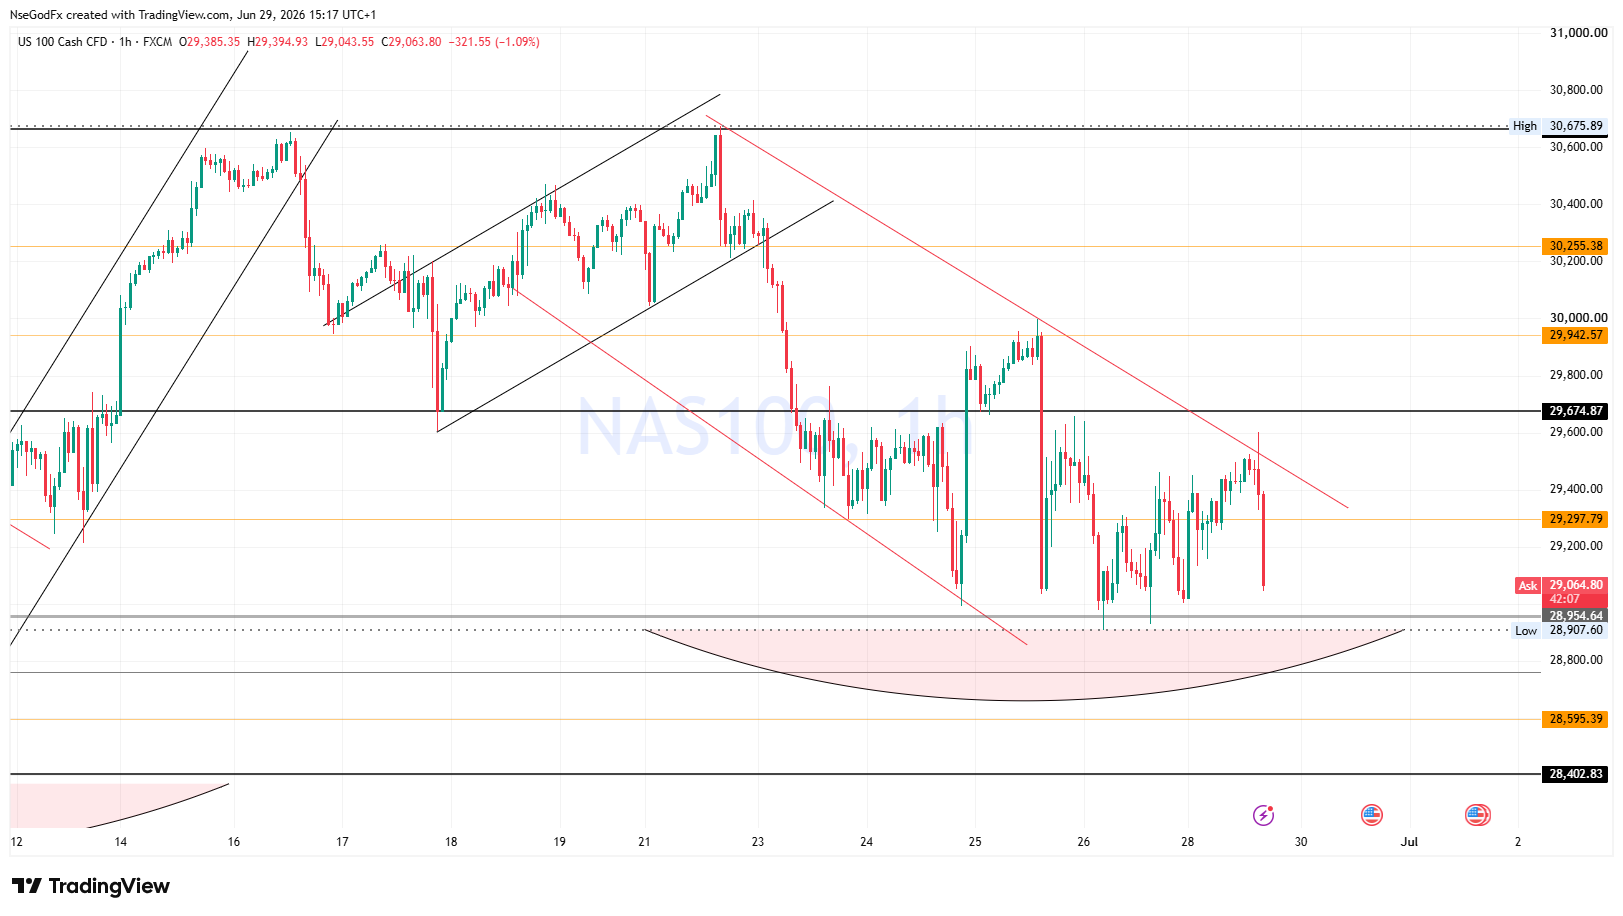
Earlier today, I Spotted this internal bearish trendline on lower timeframe. Had to wait for it to be invalidated since I wanted to Scalp buys again.

N
@nsg_usd - 1 month ago

Price has finally invalidated it. I'll be expecting the Trendline retest next week.

N
@nsg_usd - 1 month ago

Although price has broken the internal bearish trendline, price is still Confined within the 1hr/4hr Bearish channel. That means the sells is still not over.

N
@nsg_usd - 1 month ago

Triple Bottoms created at the 28950-29000 price region, and still price has not been able to push a further upside.

N
@nsg_usd - 1 month ago

The 3 days price rejections at the 28950- 29000 region is not enough. A second daily bullish Candlestick has to form at the Region to further confirm that buyers are fully in control of the region.

N
@nsg_usd - 1 month ago
Quoted - nsg_usd

The 3 days price rejections at the 28950- 29000 region is not enough. A second daily bullish Candlestick has to form at the Region to further confirm that buyers are fully in control of the region.

The 3 days price rejections at the 28950- 29000 region is not enough. A second daily bullish Candlestick has to form at the Region to further confirm that buyers are fully in control of the region.

N
@nsg_usd - 1 month ago

On the Weekly, Aside double top formation. Forming two Bearish engulfs in 4 weeks, is also strong signal we might see a continued bearish activities Next week.

N
@nsg_usd - 1 month ago

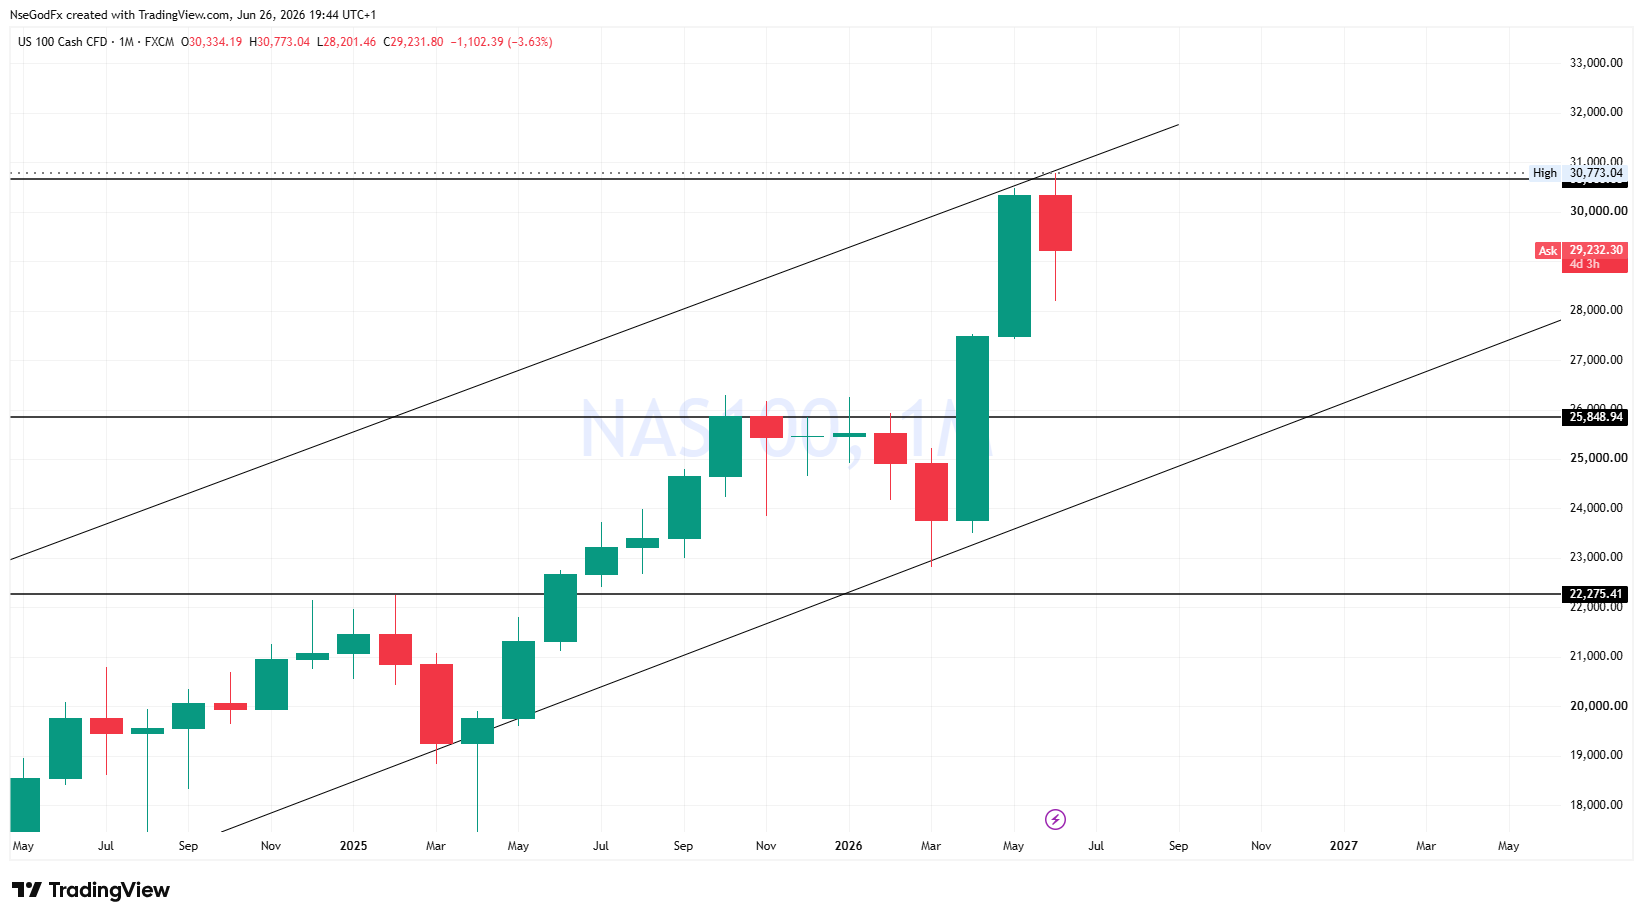
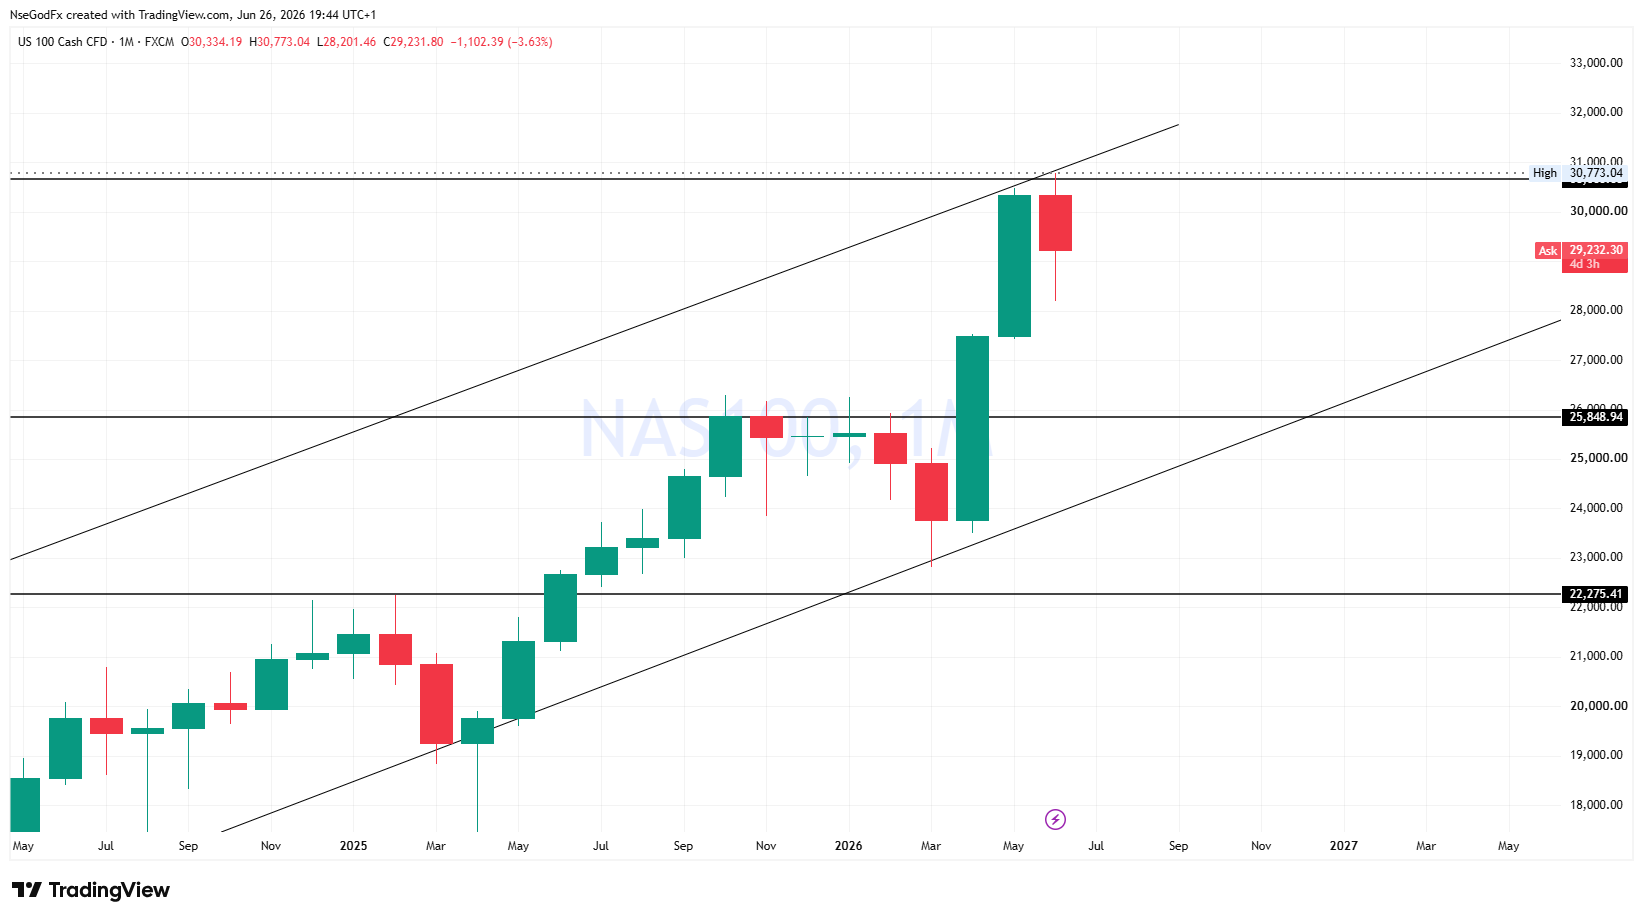
Technically, with this June Monthly candle closing bearish. Asides that it means the whole month has been dominated by sellers, it also signals that we will see a further downside for a retest of the 25800-26000 Major Key Region.

N
@nsg_usd - 1 month ago

The first two months of the Second quarter of the year had strong Impulse buys on NASDAQ, from 23,756 April Opening Price, to 30,334 closing price of May. But for the last month of the quarter, Price intends to close Bearish with Nasdaq's New ATH at 30,773.

A
@asuquokelvin - 1 month ago
Quoted - nsg_usd

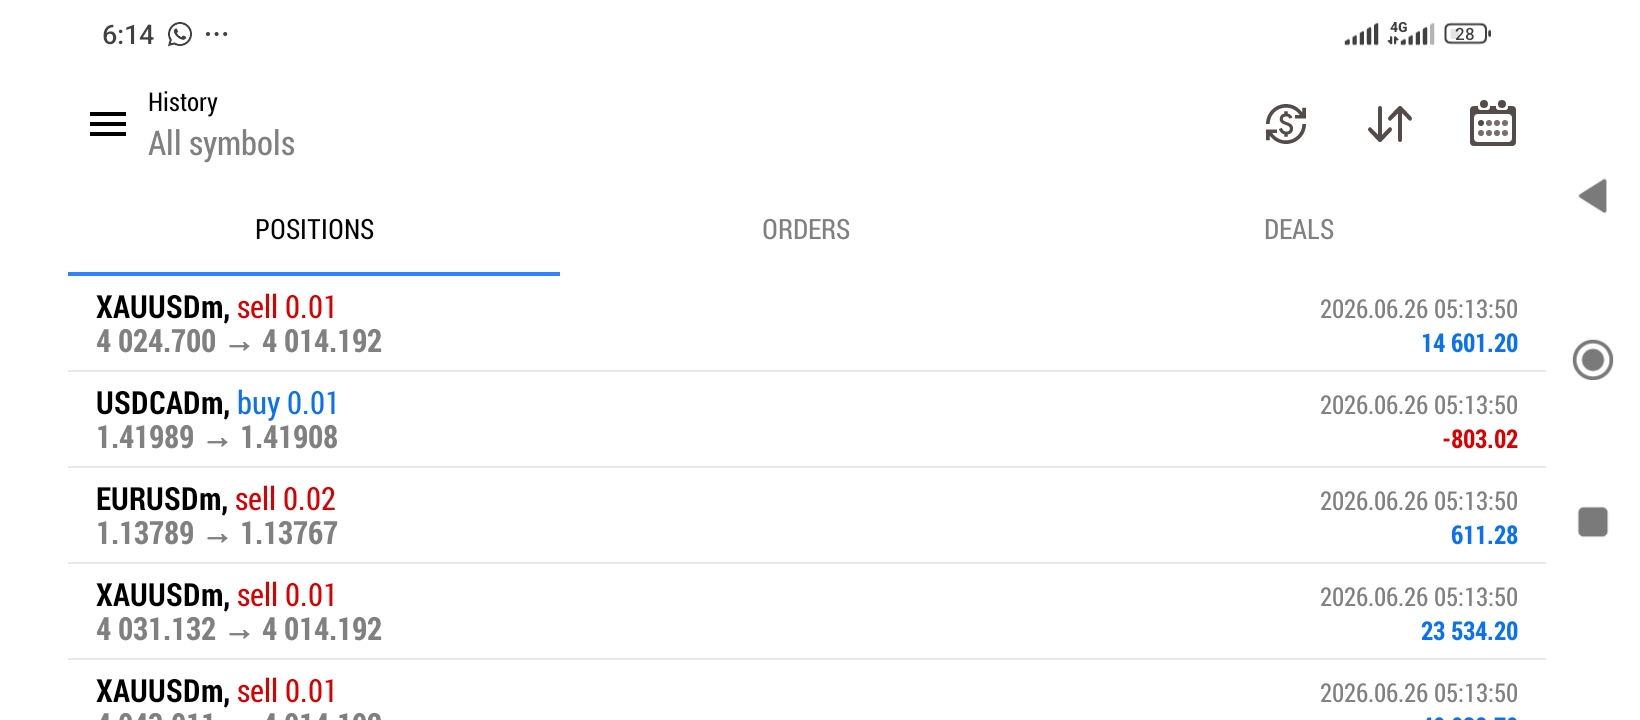
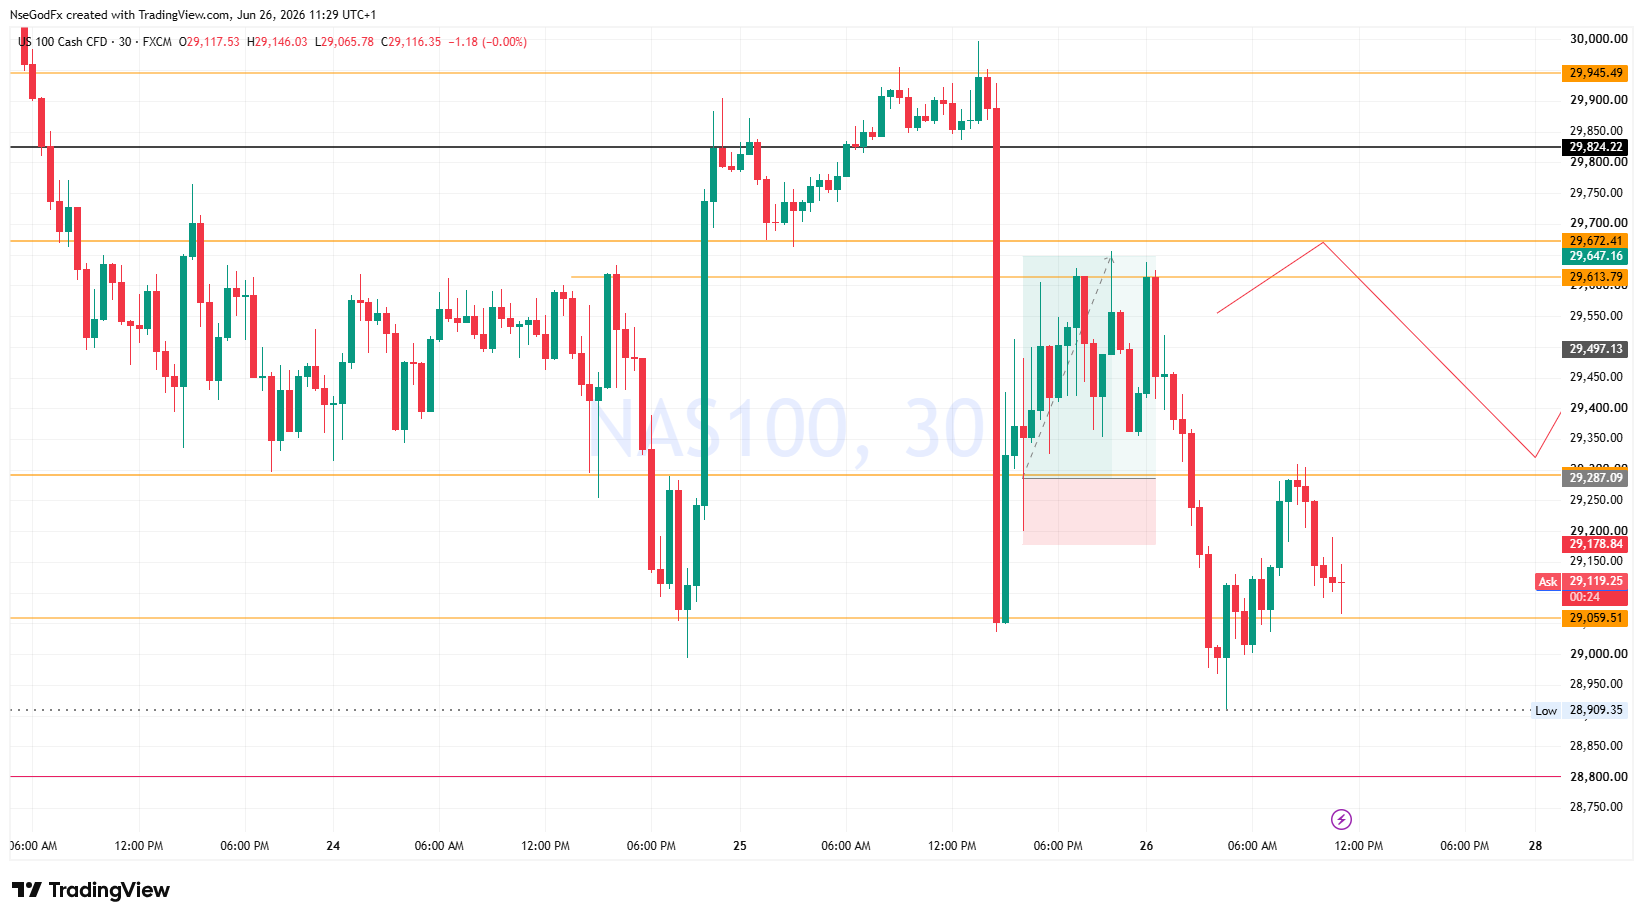
Nice Catch. Your sells was a pullback to my Entry.. Although I took silver instead of Gold.

Exactly. The break above the last lower high in a lower timeframe of that pullback gave me the confirmation of trend change so I had to close .

N
@nsg_usd - 1 month ago

Today on Nasdaq- a formation of a Daily Low by the close of today's daily candle on the 28950 Support Region, will confirm price intentions to stay bullish on the Daily time-frame.

N
@nsg_usd - 1 month ago

Price is still unable to take out the 4hr-1hr trendline resistance, and thus still confirms that price is still bearish internally, despite starting with bullish move

N
@nsg_usd - 1 month ago
Quoted - nsg_usd

Price is still unable to take out the 4hr-1hr trendline resistance, and thus still confirms that price is still bearish internally, despite starting with bullish move

Price is still unable to take out the 4hr-1hr trendline resistance, and thus still confirms that price is still bearish internally, despite starting with bullish move

Disclaimer:

At MyTradingLand.com, we connect you with forex brokers and provide a community for traders. While we offer valuable information and resources, please note that we are not financial advisors and cannot provide personalized financial advice. Always conduct your own research and invest responsibly.

Community Guidelines: The MyTradingLand.com community is designed as a resource for forex traders, promoting respectful and constructive discussions. We reserve the right to remove any content that is misleading, abusive, or violates our terms of service.

Broker Information: While we may receive commissions or advertising income from some of the brokers listed, this does not imply an endorsement of any broker, nor does it affect our review process. Our evaluations are based solely on objective criteria and user feedback.

Always verify the regulatory status of any broker with your local financial authority, along with their terms and privacy policies, before engaging with them. It is crucial to conduct thorough research to ensure that you are making informed decisions.

Risk Warning: At MyTradingLand.com, we strive to provide accurate information; however, the forex market is highly volatile and can change rapidly. It is essential to verify any information before making investment decisions.

Please be aware that trading in forex involves substantial risk, and it is possible to lose more than your trading equity/investment capital. 70-90% of retail CFD traders incur losses in their trading activities as per information from various brokers.

You are solely responsible for your use of MyTradingLand.com and any trading decisions you make. We encourage all users to educate themselves thoroughly about forex trading and to consider seeking advice from qualified financial professionals.

Advertising Disclosure: We may earn commissions from recommended brokers, but our reviews are independent (not influenced by potential earnings). Sponsored content is clearly marked and doesn't reflect our views.

©2026 ©2025 All rights reserved Mytradingland.com