Good Morning Guys
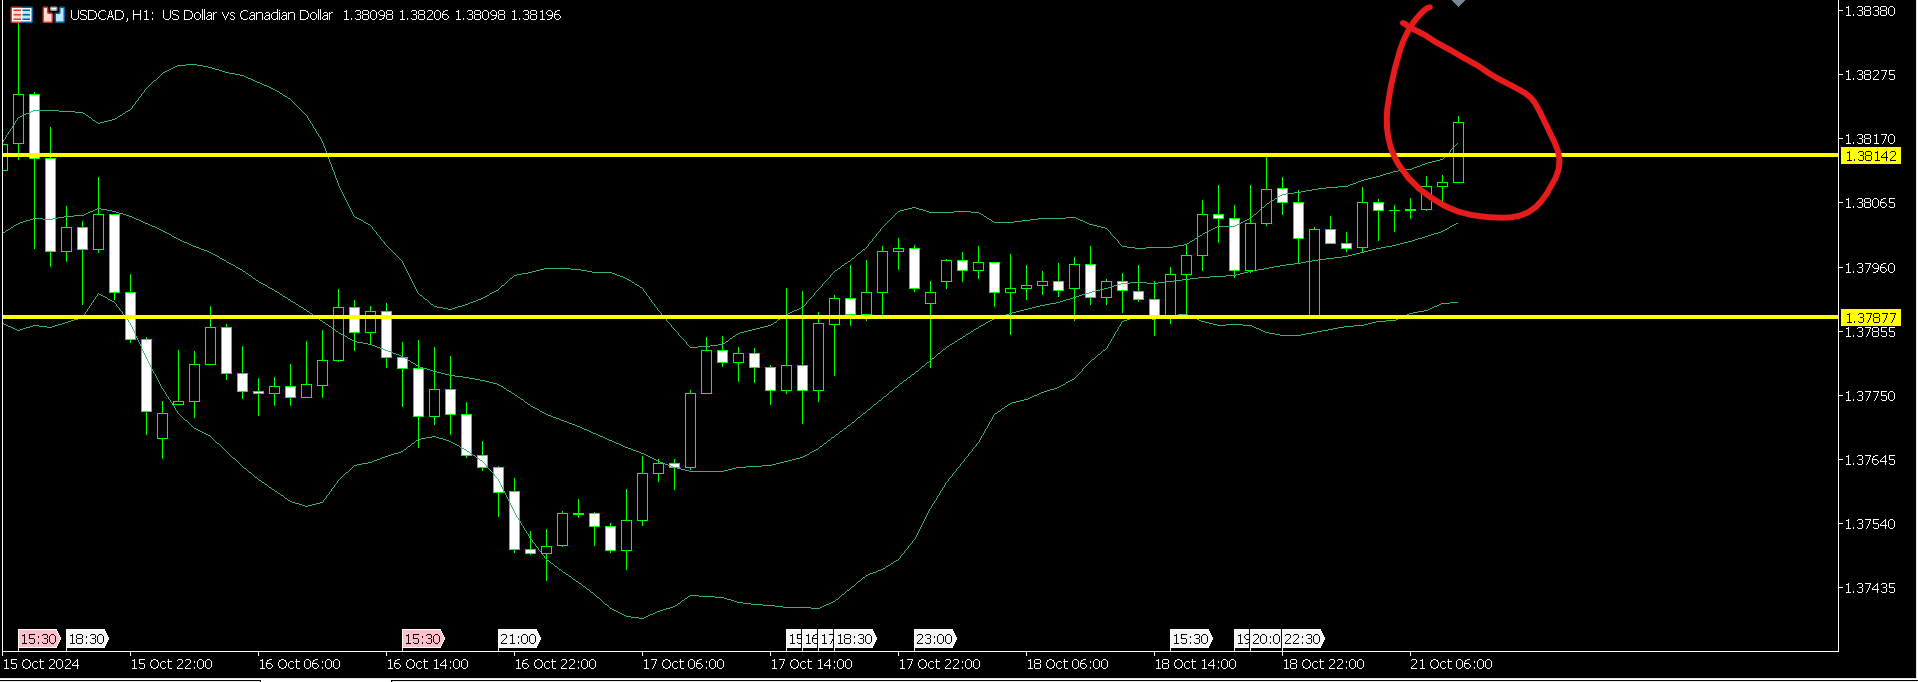
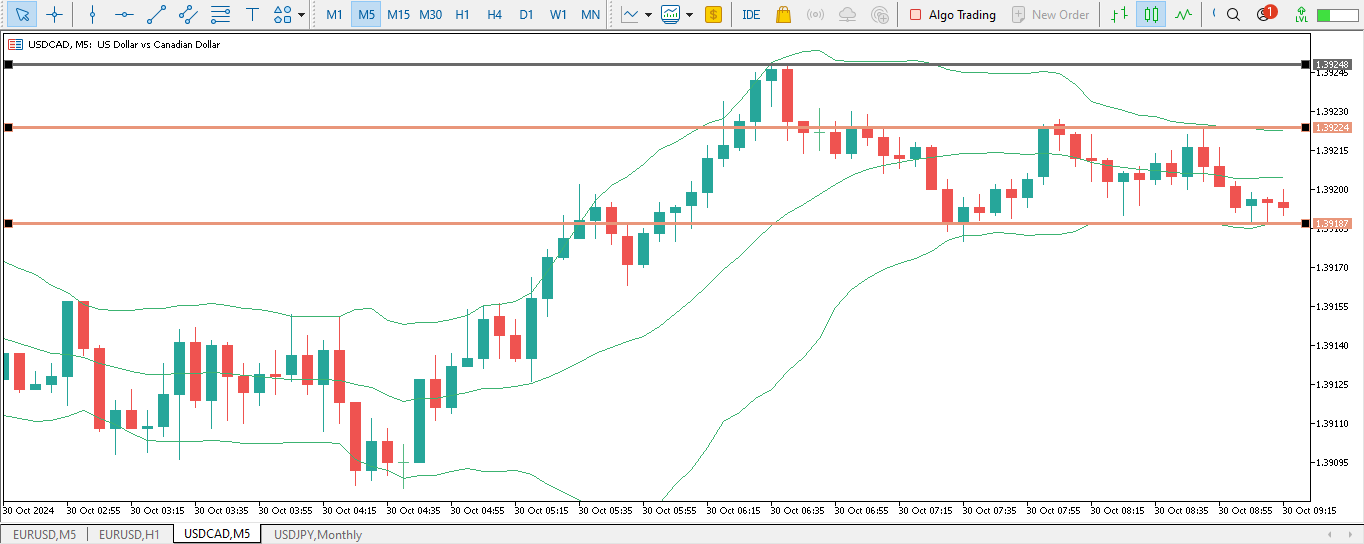
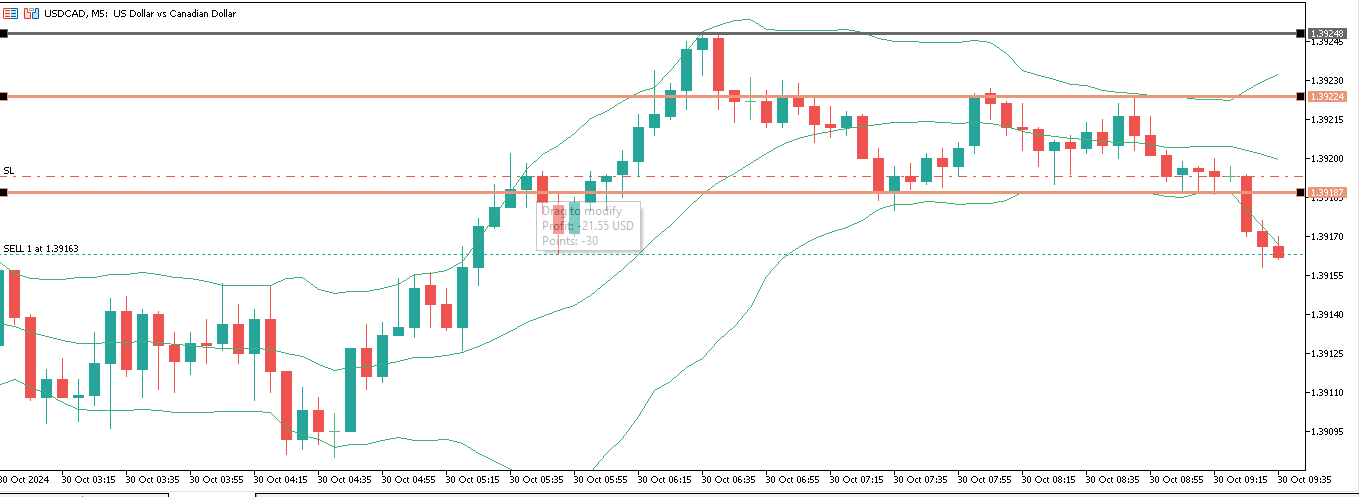
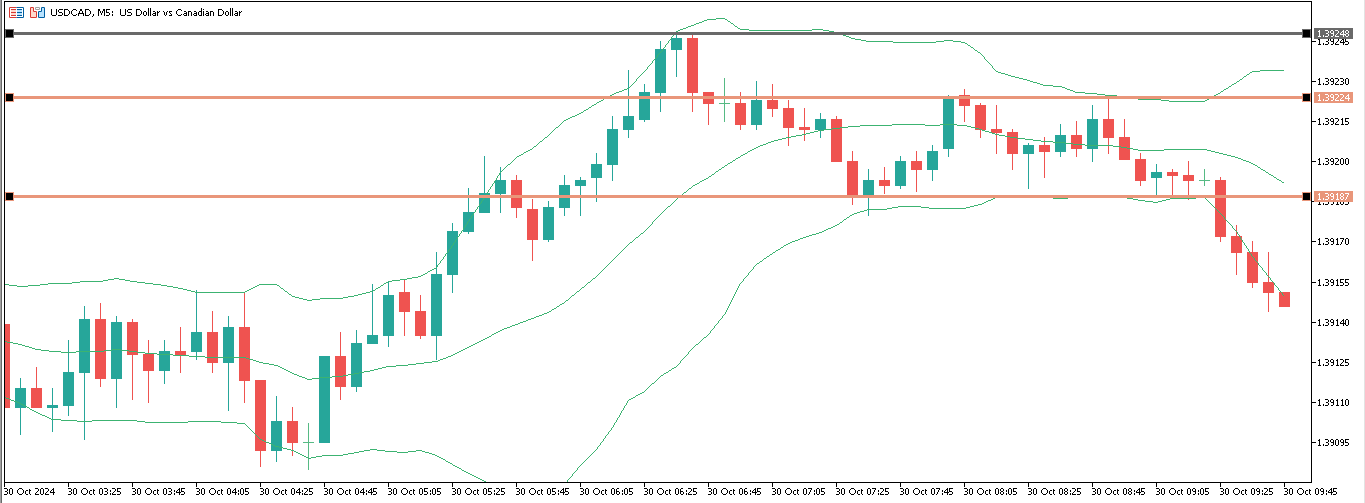
This is a 1 Hour chart of the USD/CAD using the broker FxPro
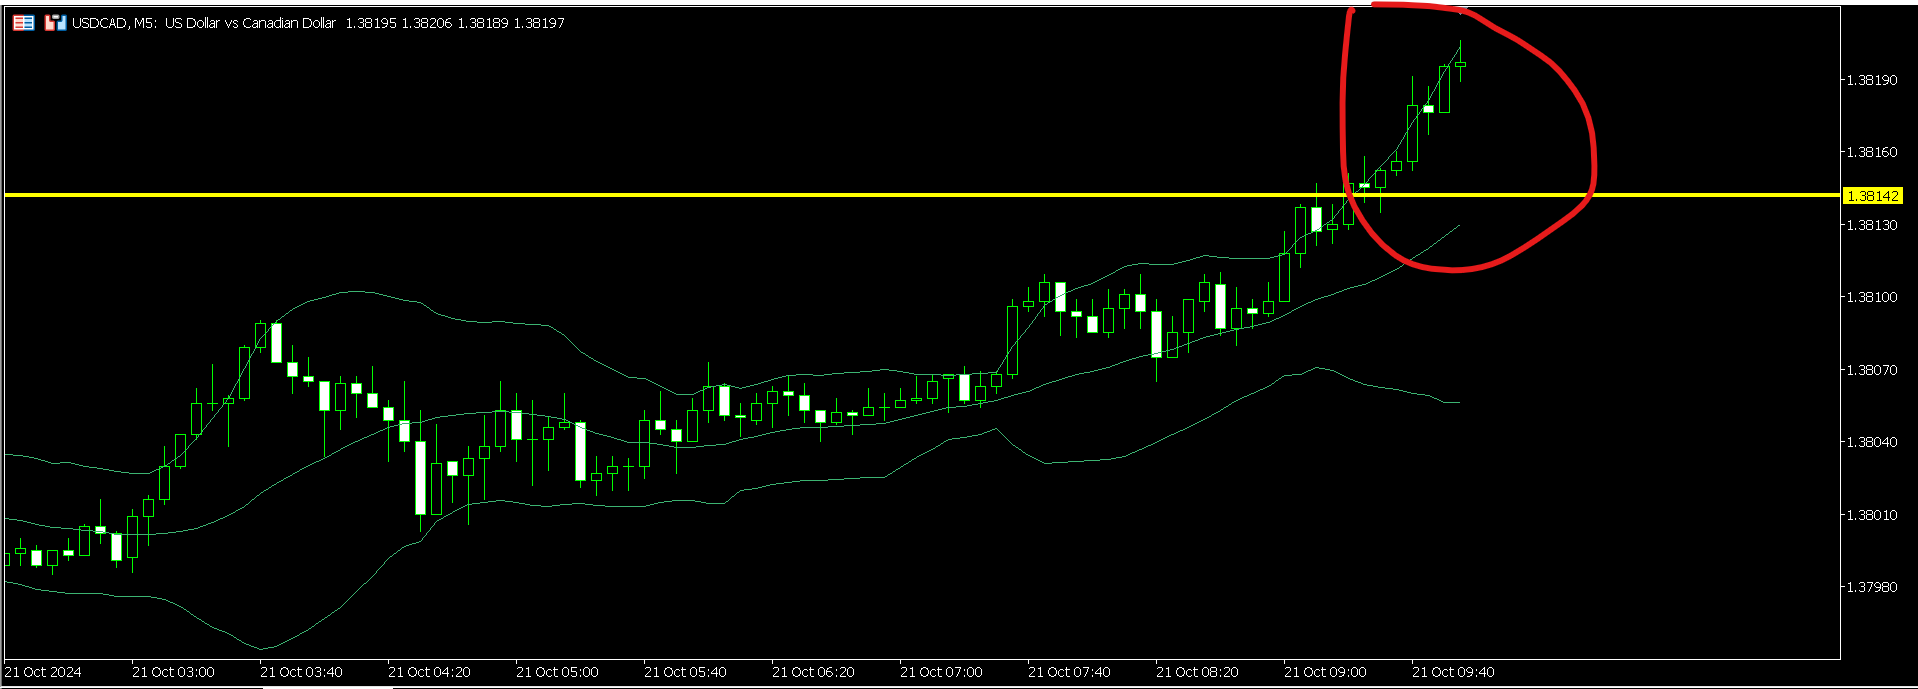
The yellow lines i drew are to mark the lowest & highest prices reached during the Asian session today.
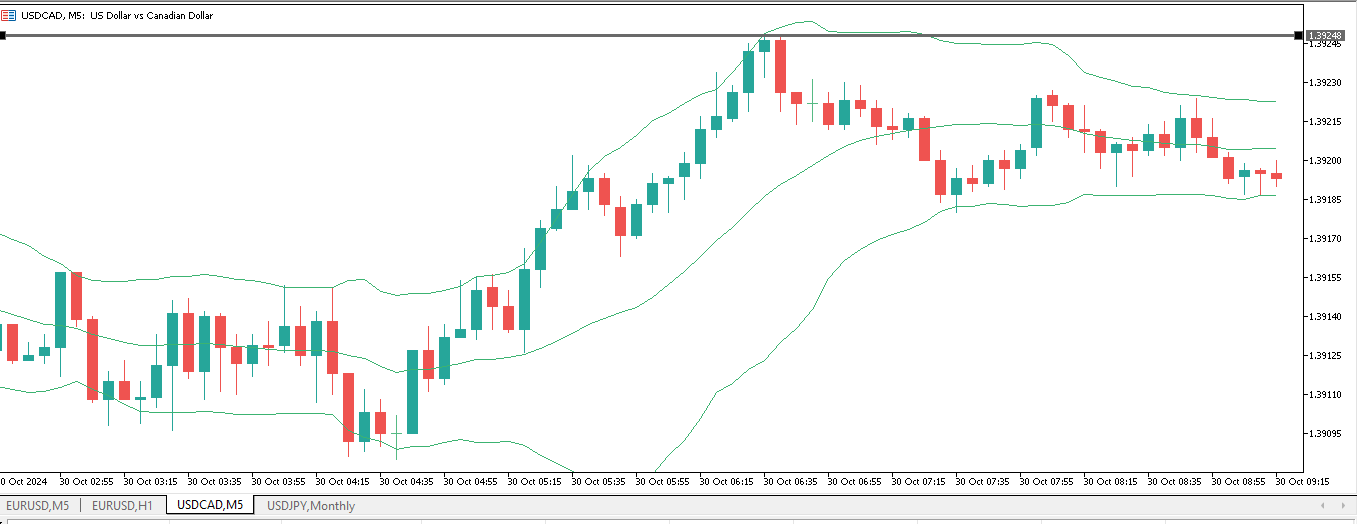
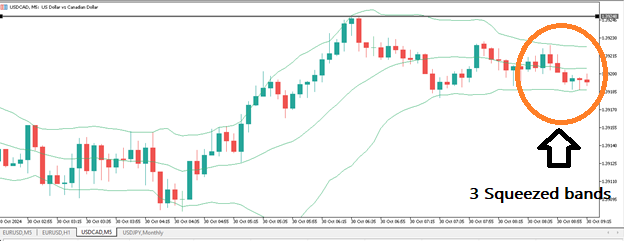
The 3 green bands overlaid on the charts are the Bollinger Band technical indicator and whenever they squeeze together it is always followed by a lot of action with price surging forward wither upward or downward.