
S
Sport Roast
@sportfx001
I am so interested in trading.
0 Followers
1 Following
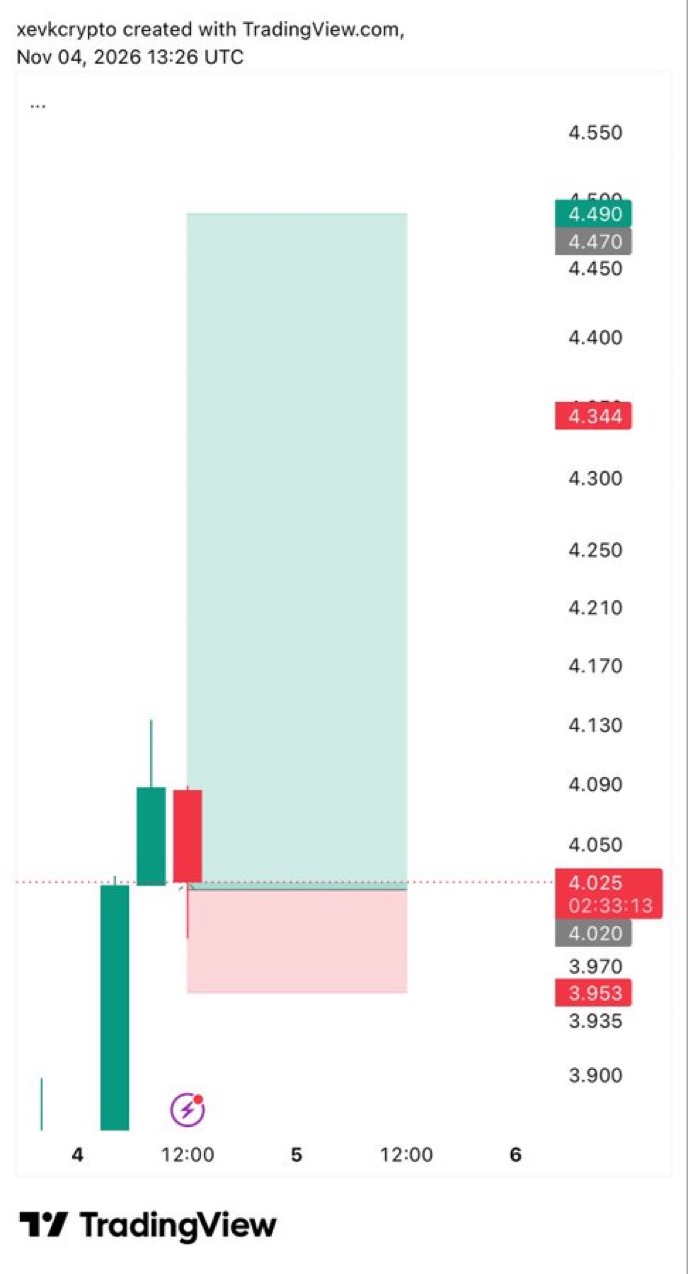
Entry: 4.025
SL: 3.953
TP: 4.490
RR: 1:6.45
Price showed strong demand at 3.90-4.00 with bullish engulfing. Waiting for continuation after pullback.
Holding support at 4.02. If we hold, 4.49 next. This one is a swing, not scalping like V100. If it breaks 4.02, you cut. If it holds, you ride to 4.49.
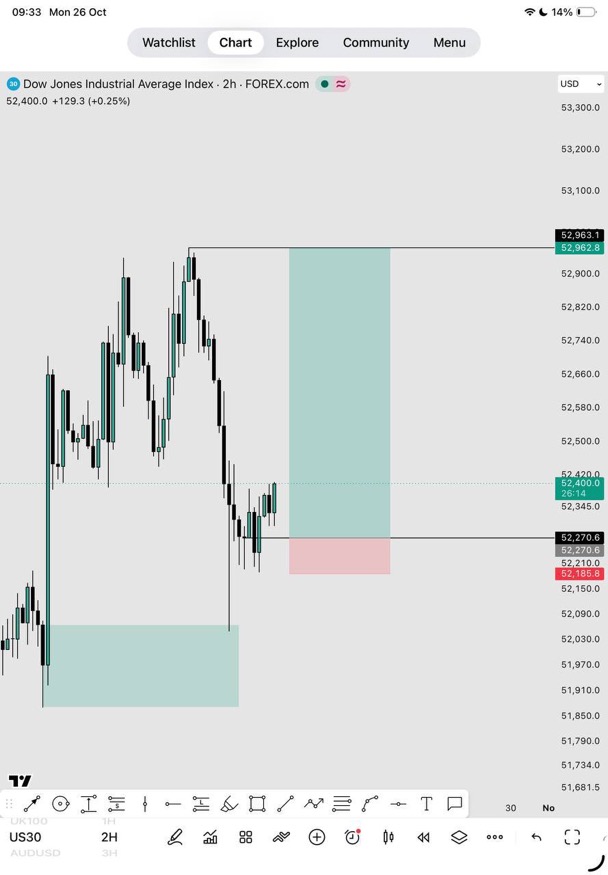
US30 2H - BUY
Entry: 52,270.6
SL: 52,185
TP: 52,963.1
Setup: Break + retest of 52,270 OB. Targeting previous high. 1:8 RR.
Price went down, swept liquidity, and came back up. It broke 52,270 which is a key level.
Now we are waiting for price to come back to 52,270 to buy.
Buy at 52,270
Stop loss 52,185 (small loss if wrong)
Take profit 52,963 (previous top)
+1
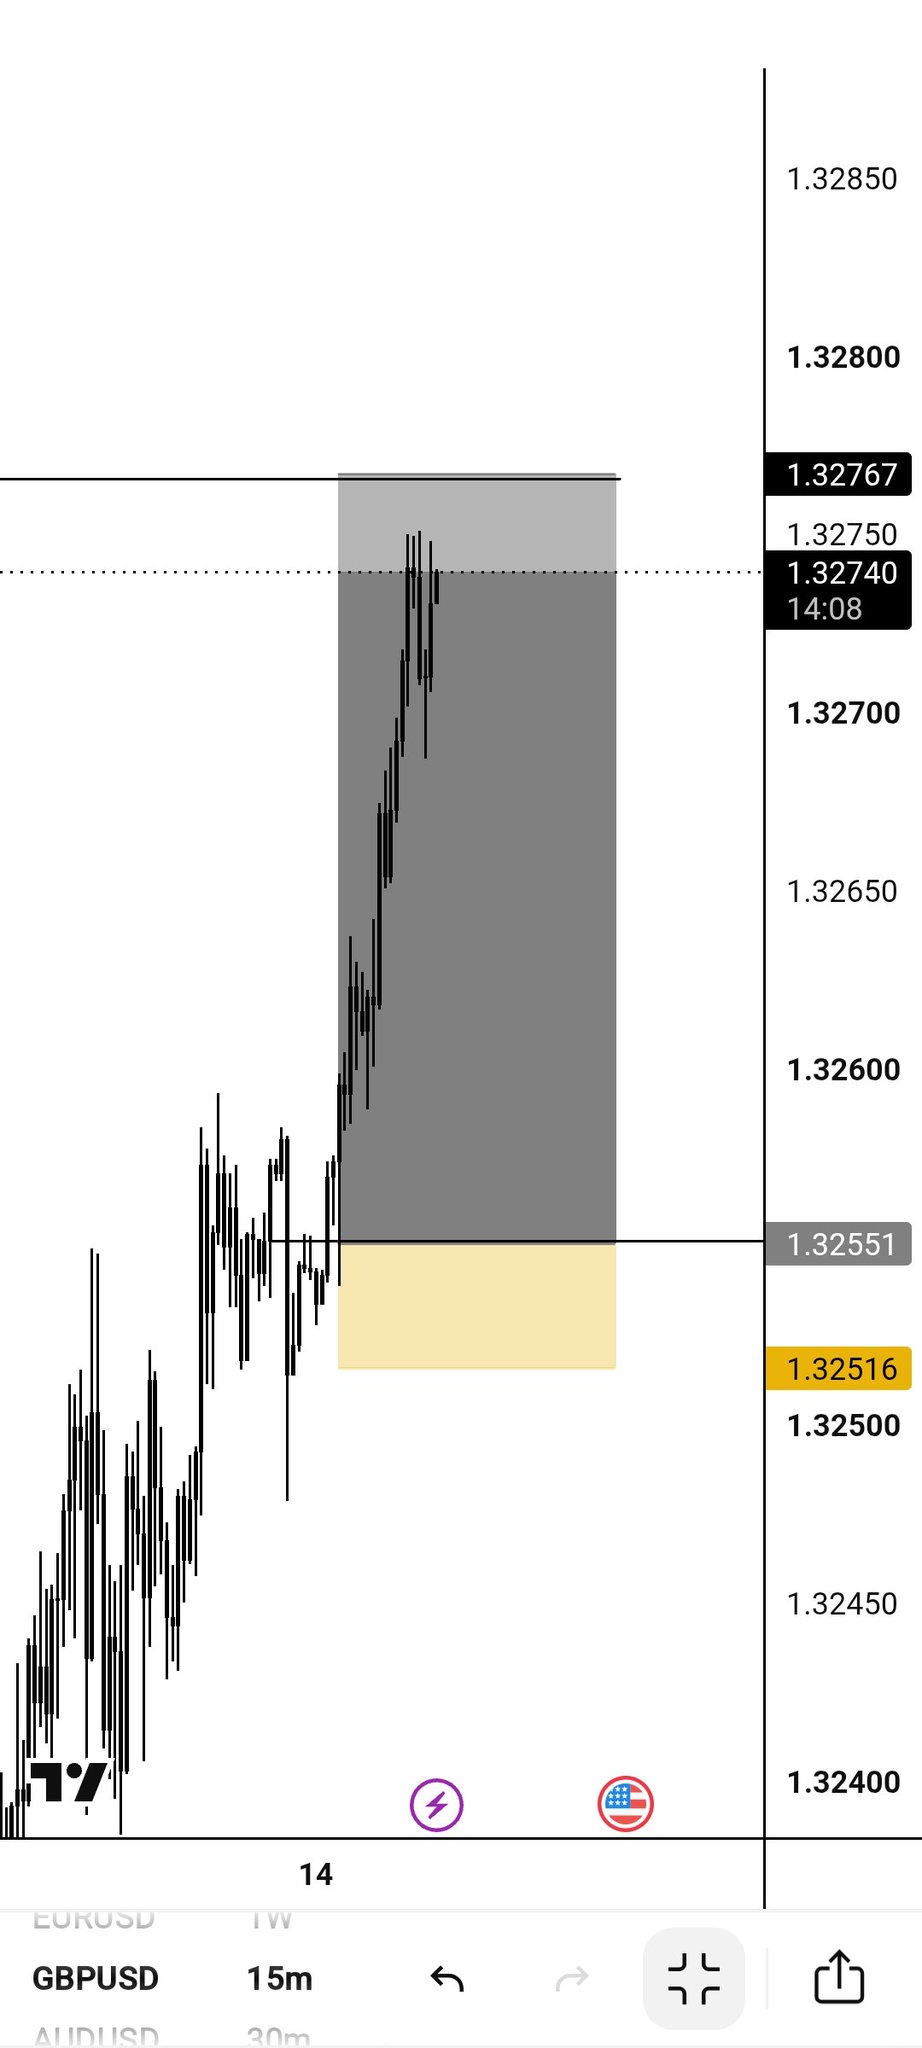
GBPUSD 15m long is running perfectly, entered at 1.32551 and now in full profit around 1.32740 heading for the 1.32767 target.
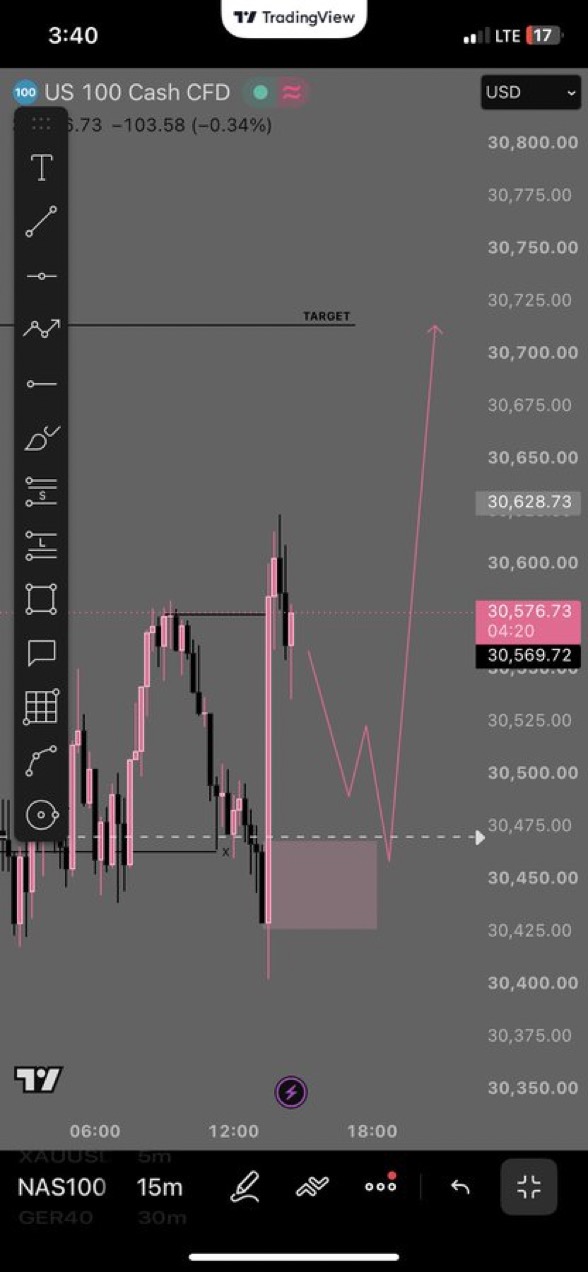
NAS100 tapped into the 30,460 demand zone with a liquidity sweep and is now setting up for a bullish reversal targeting 30,715 highs.
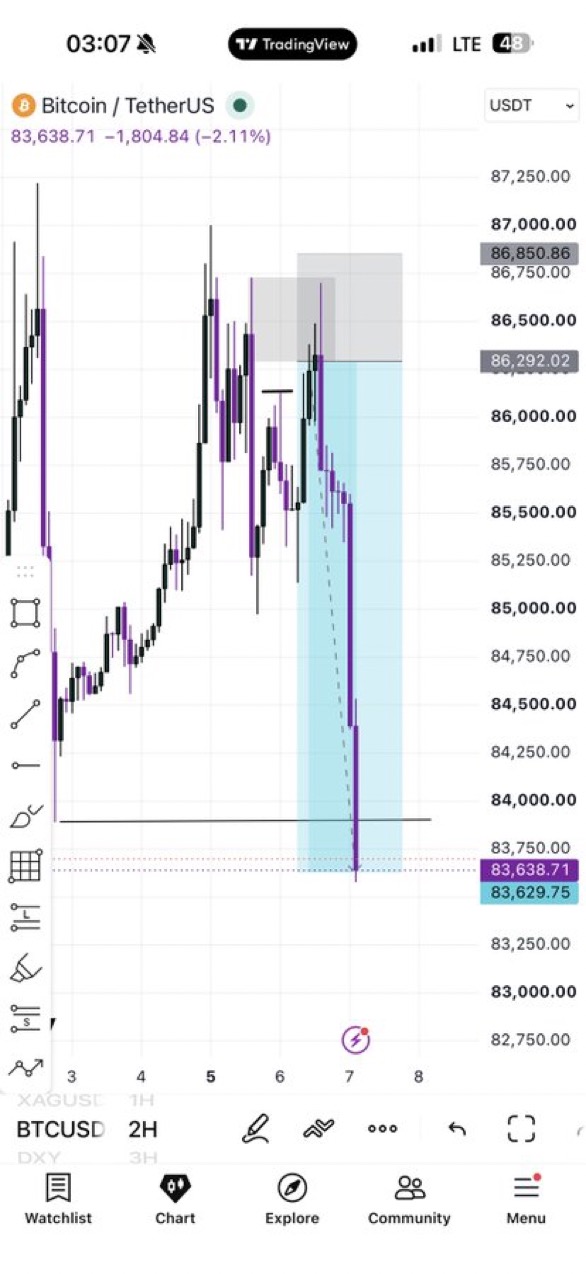
Price will not just respect a level because you marked it with one line as a POI, why should price sell or buy from that particular level, have a solid reason to back your entry levels.
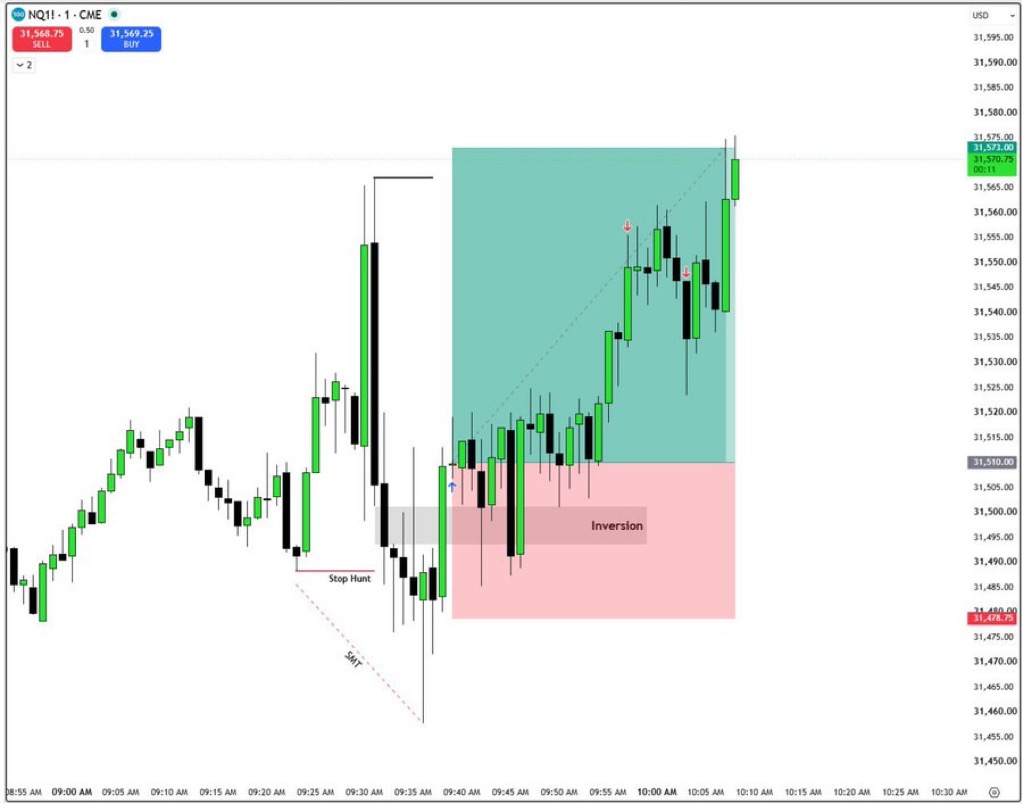
One winning trade can change your day, but one winning model can change your life. One setup for life.
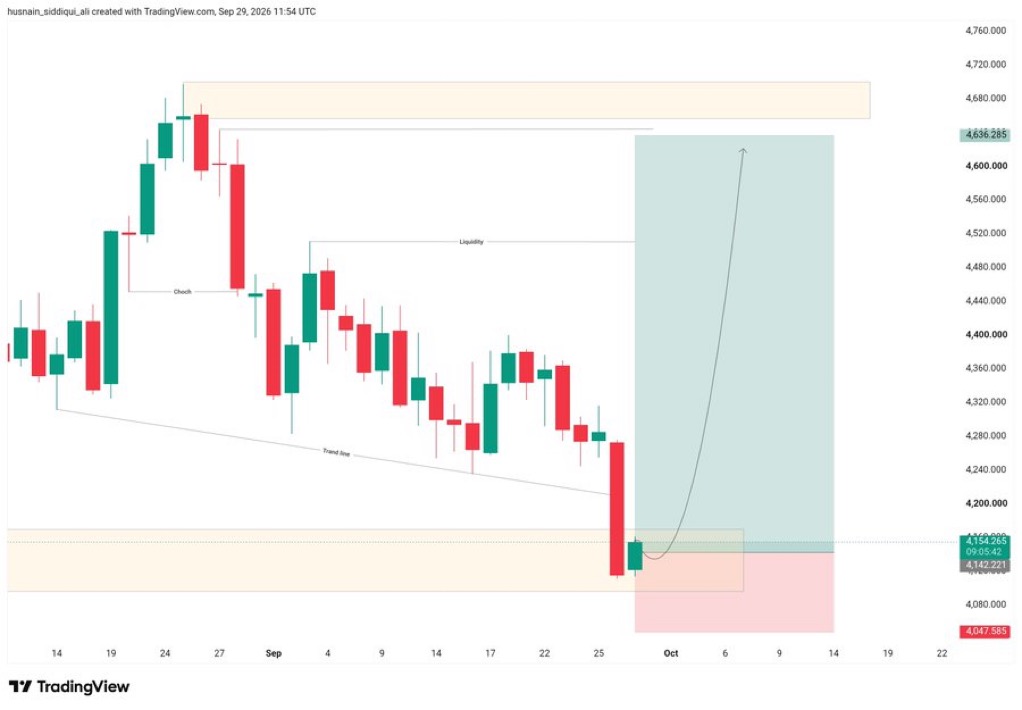
If the price maintains Monday low, then we can expect a good bullish from the next week. If it breaks then get ready for 4000.21
Weekly candle close above previous high but it was not strong close through( as it hit into HTF KL and forming wick) so anticipating lower price, Red line is KL once we break it, bear will take control.
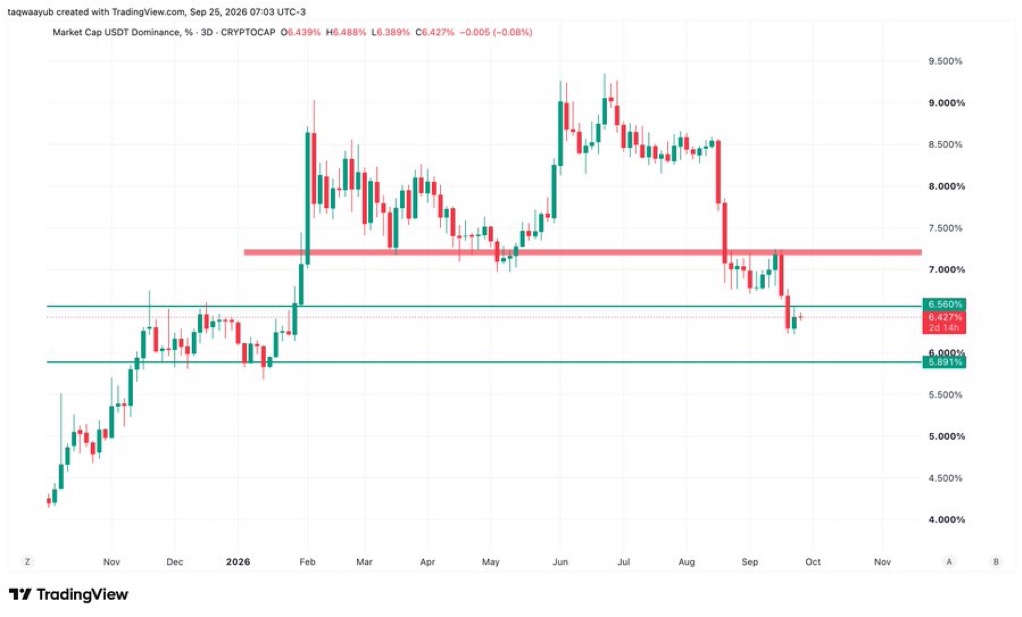
When weekly chart confuses you, switch to 3dtf or daily one. It’s a very clean chart, will never go against the direction unless it’s breaks the resistance first.
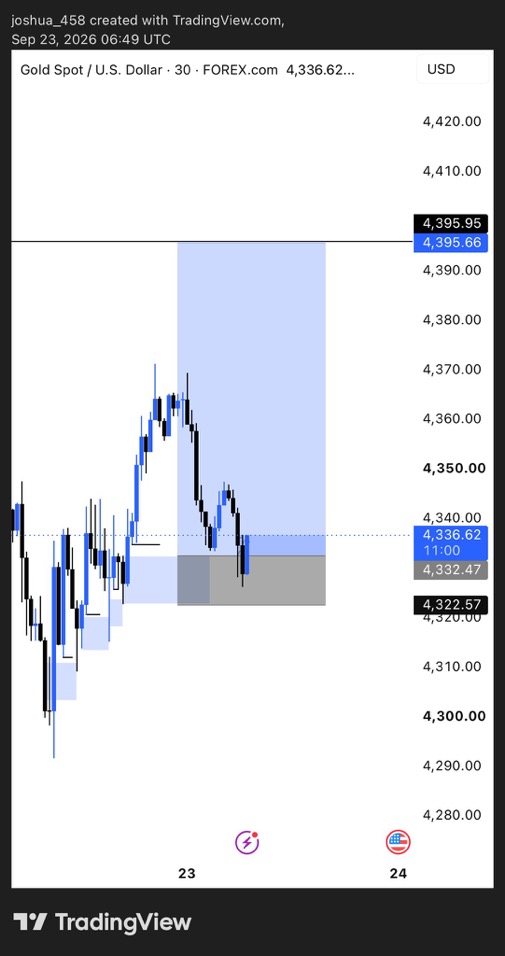
Price pumped to 4370 and got rejected with a bearish engulfing. I took the short from 4365.
Now we're at 4336, already in good profit and pressing into my TP zone 4332 or 4322.
That grey box is the last demand before 4300 breaks. If it holds, we could see a bounce. If it breaks, 4300 next. Risk managed, letting it play.
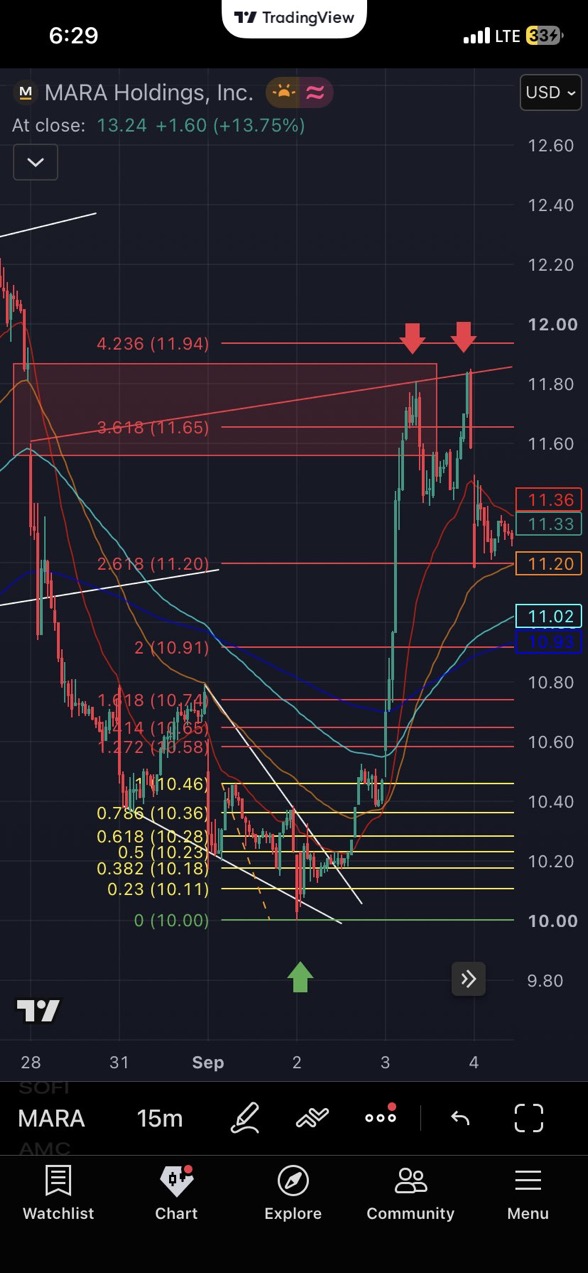
MARA pumped from $10.00 to $11.86 but now we got double rejection at $11.94 (4.236 Fib extension). See those two red arrows? That's sellers stepping in hard.
Saw Gold runners, congrats to them. I'm focusing on AUDUSD and EURAUD today, no clean setup yet. What bias are you holding on Gold?
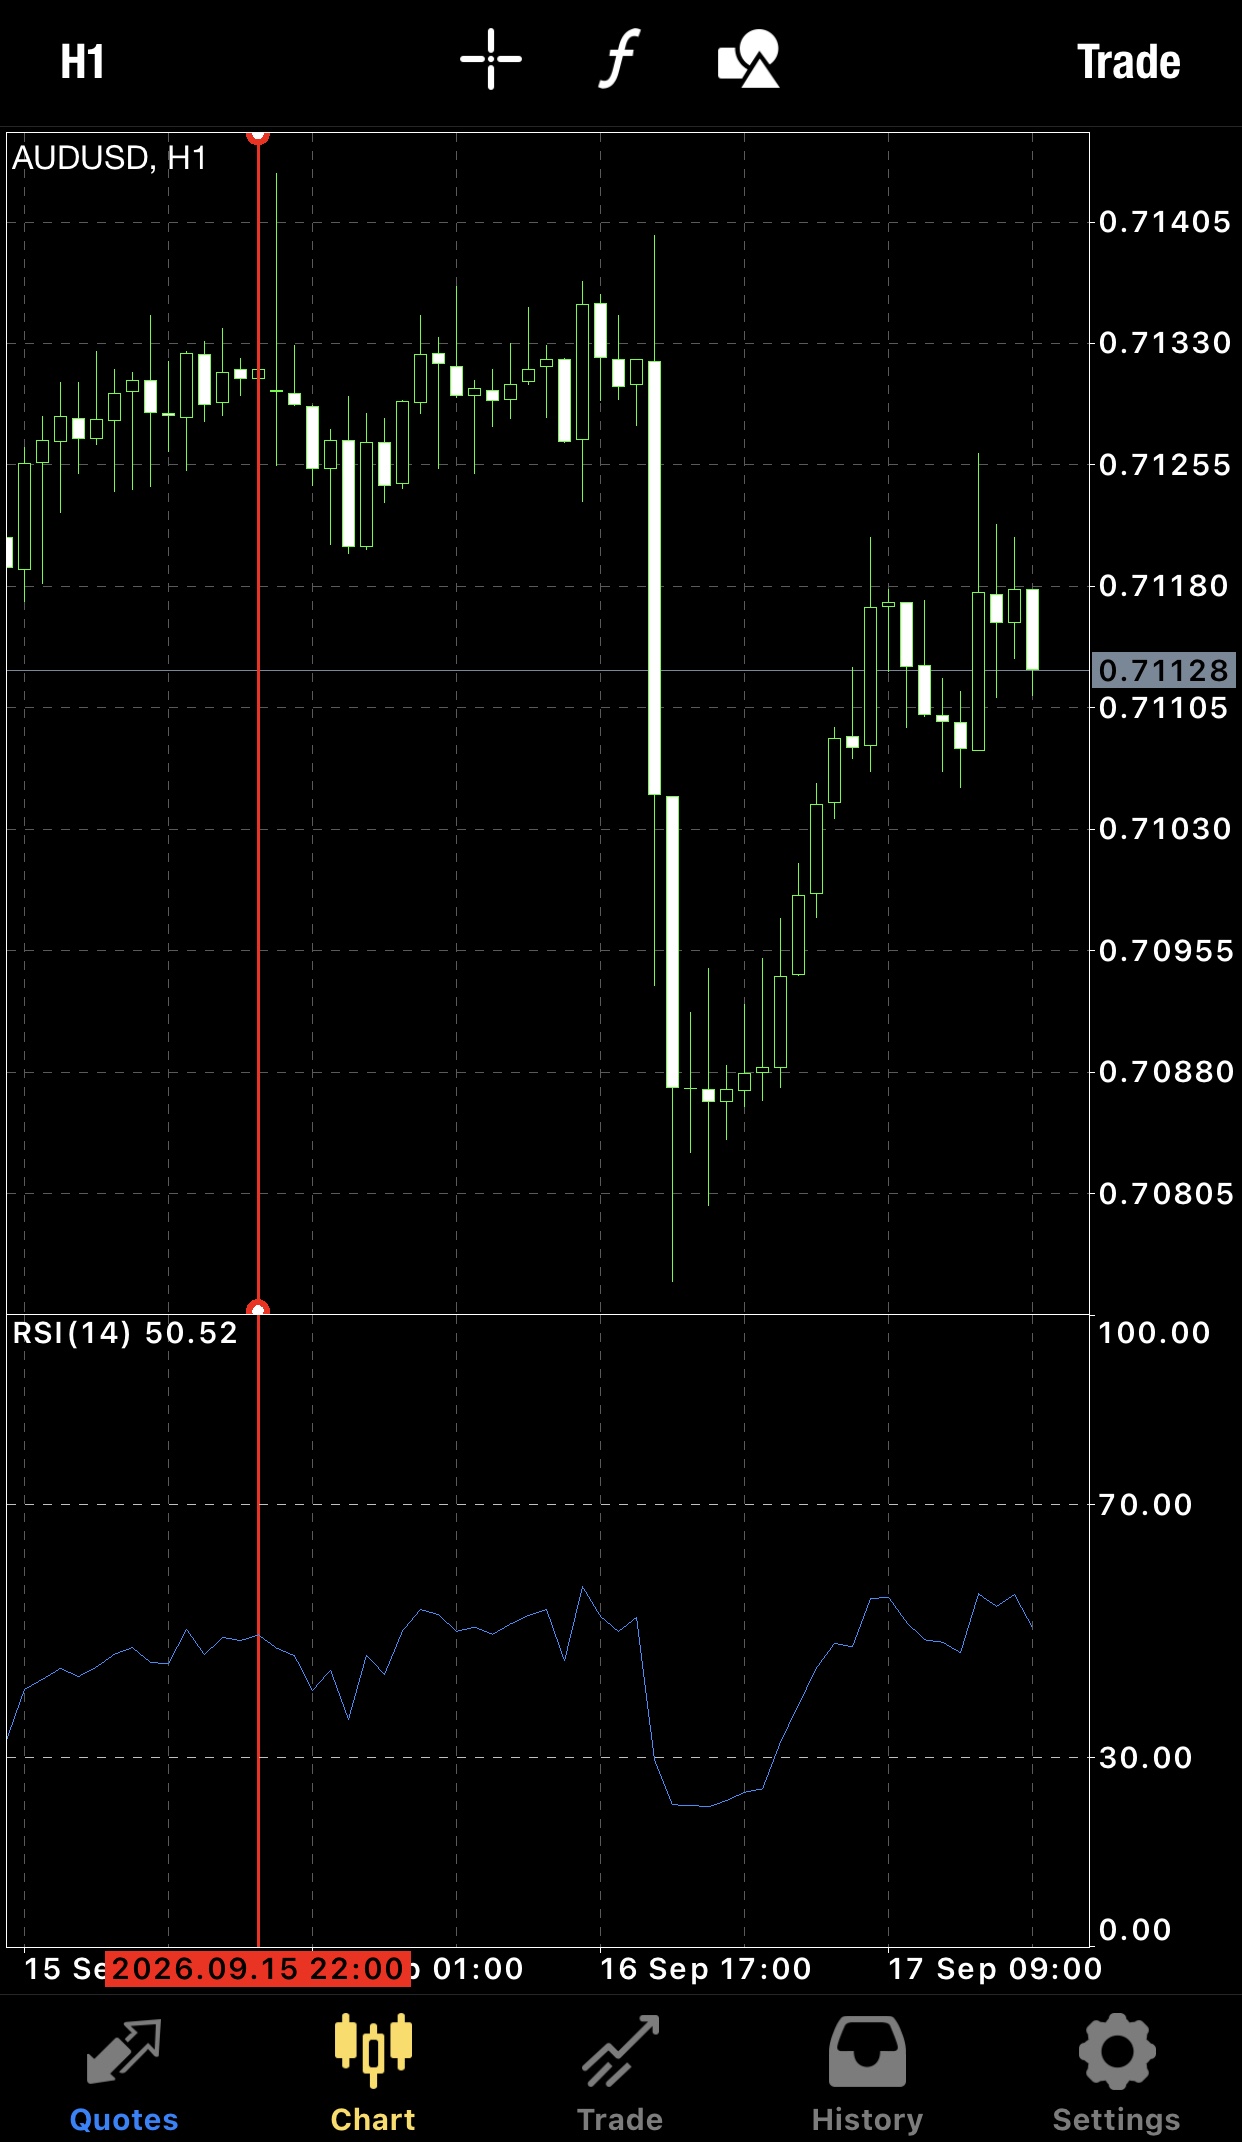
Good morning everyone, please on my AUDUSD H1 chart I have this red vertical line at 2026.09.15 22:00. Is this just a time/crosshair marker or does it indicate an order? I thought it was a signal.
4. Answer: A. Prices are generally moving upward ✅
Quick breakdown:
Bullish market = Traders are optimistic. Buyers are in control and prices are trending up.
Think "bull charges upward with its horns" 🐂📈
Opposite:
Bearish market = Prices are generally moving downward. Traders are pessimistic. Think "bear swipes downward" 🐻📉
Showing 20 of 49 replies.
Log in to see all replies