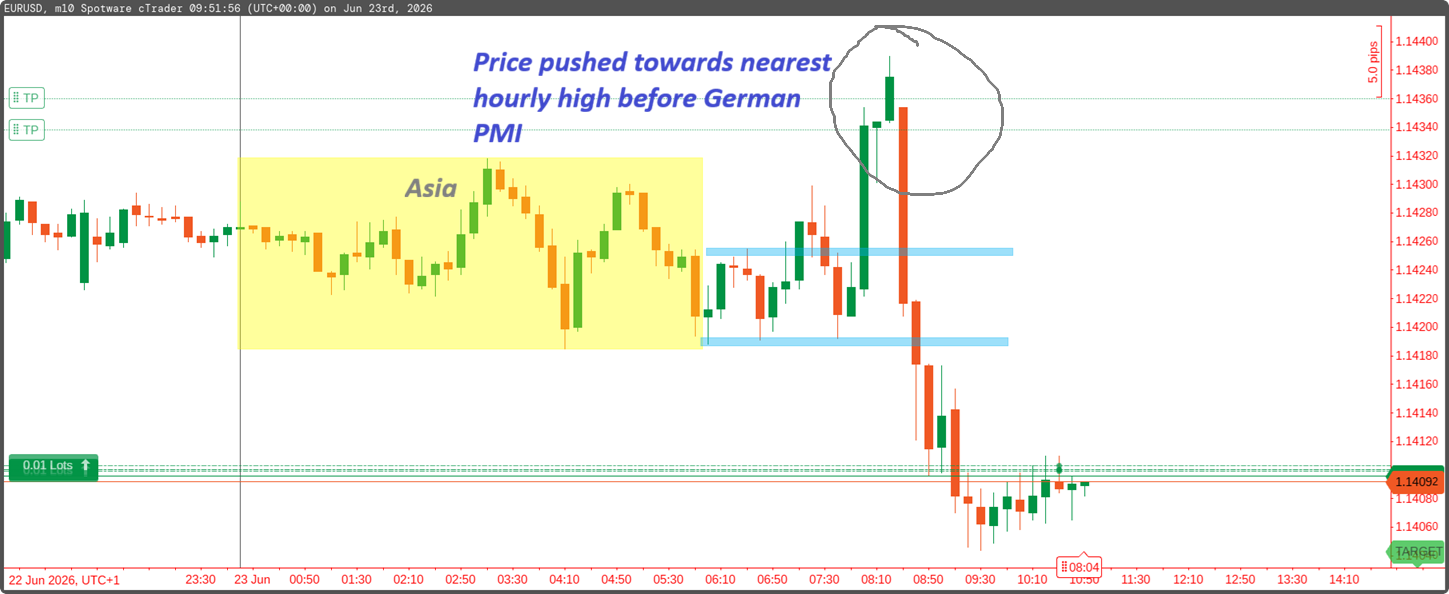
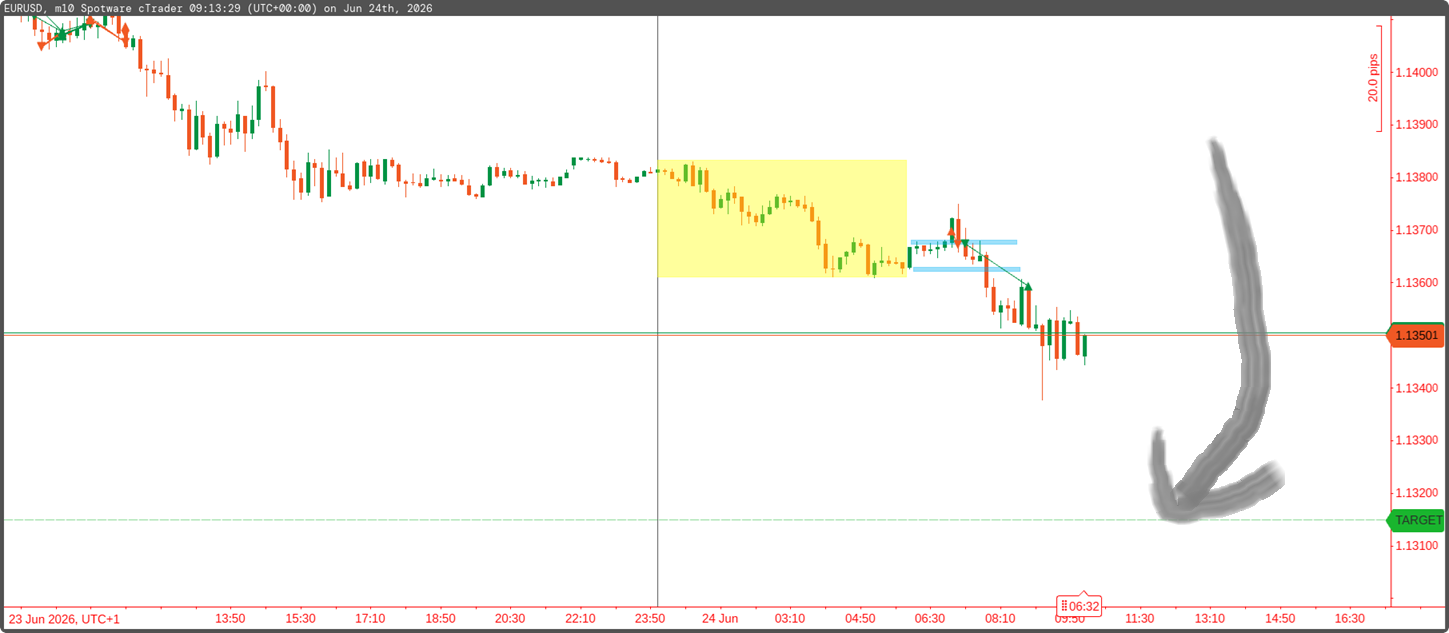
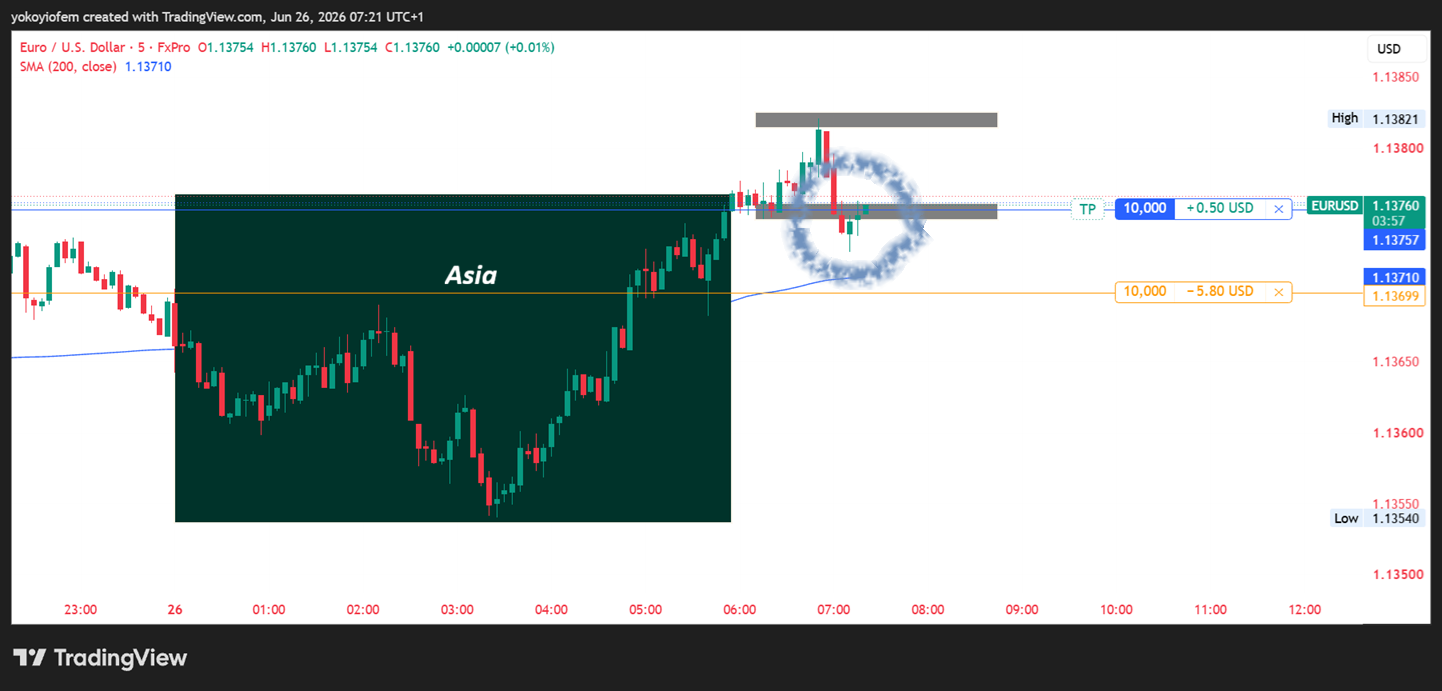
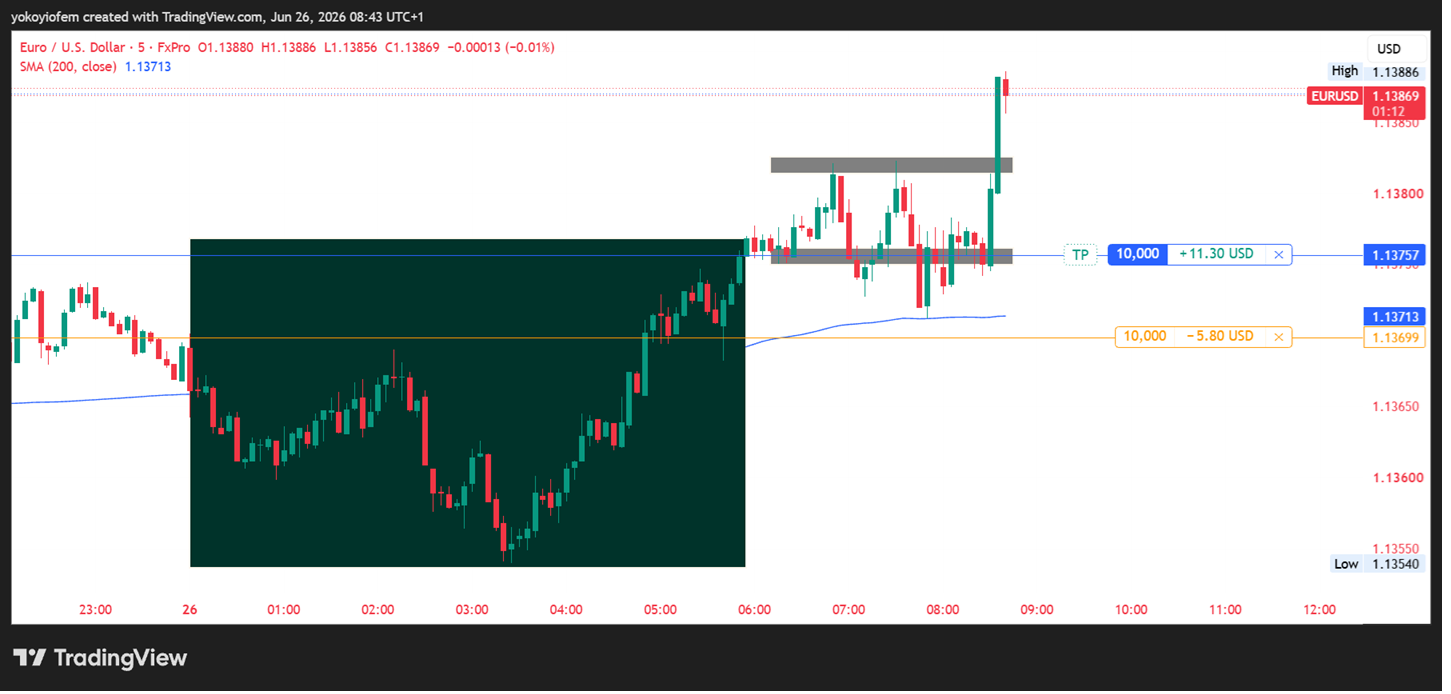
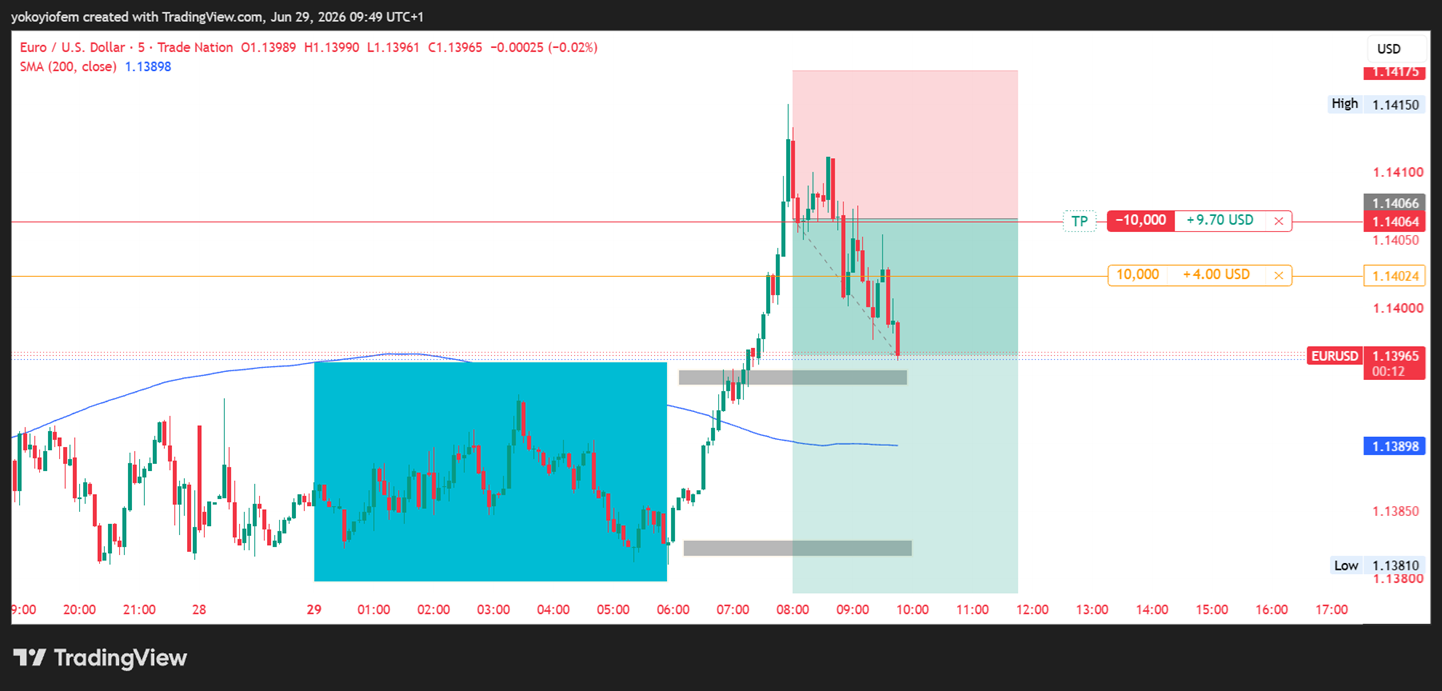
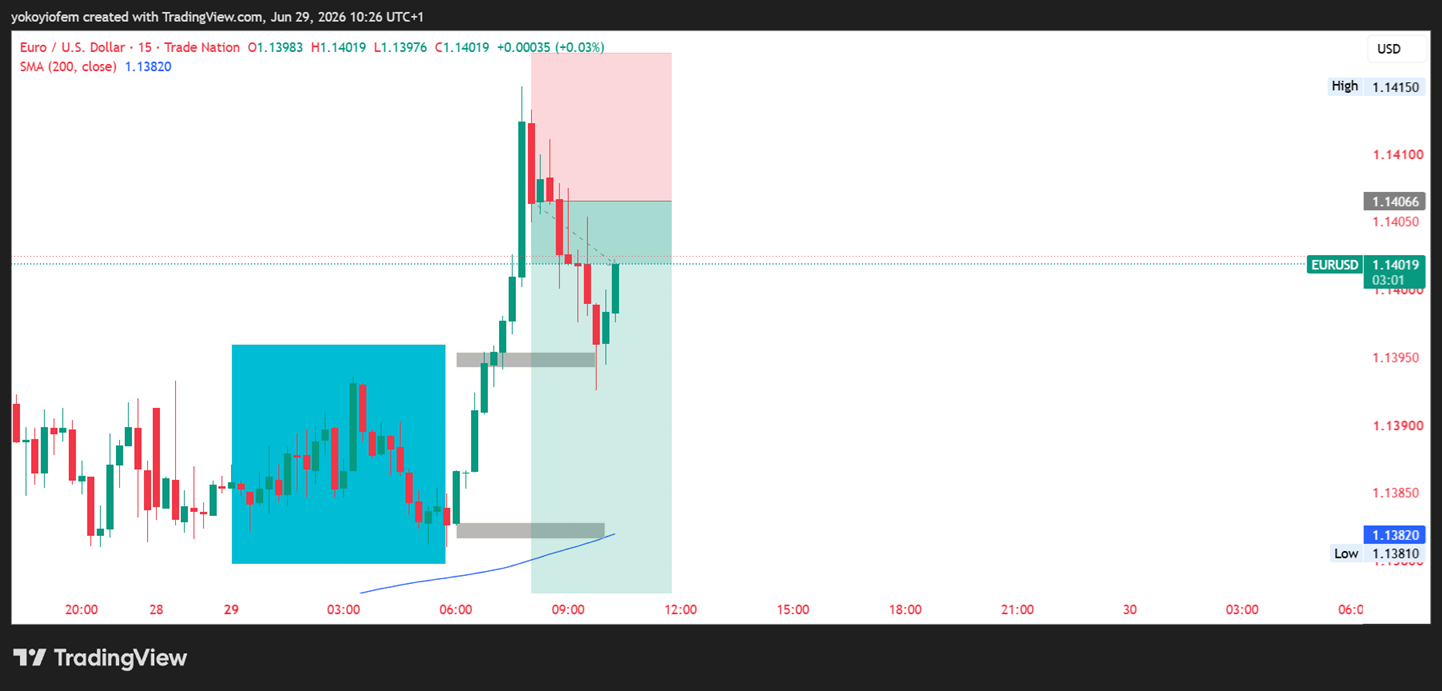
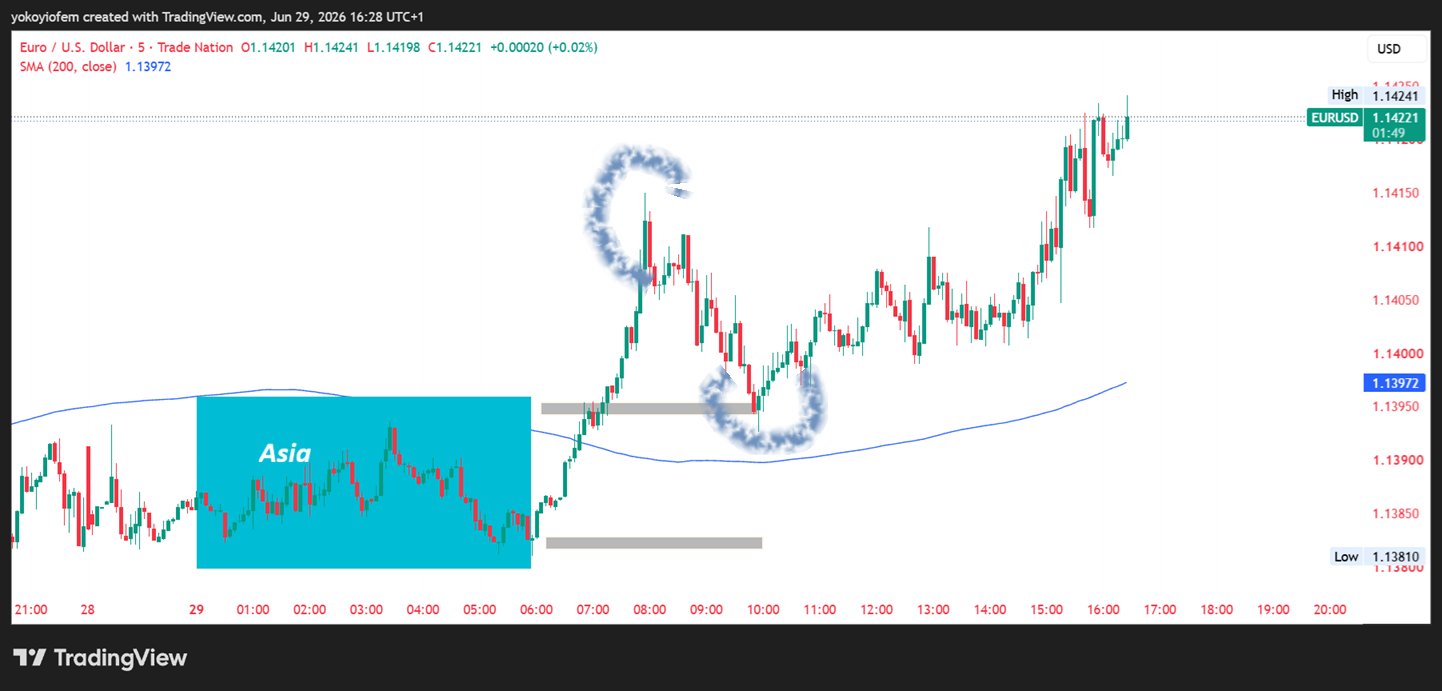
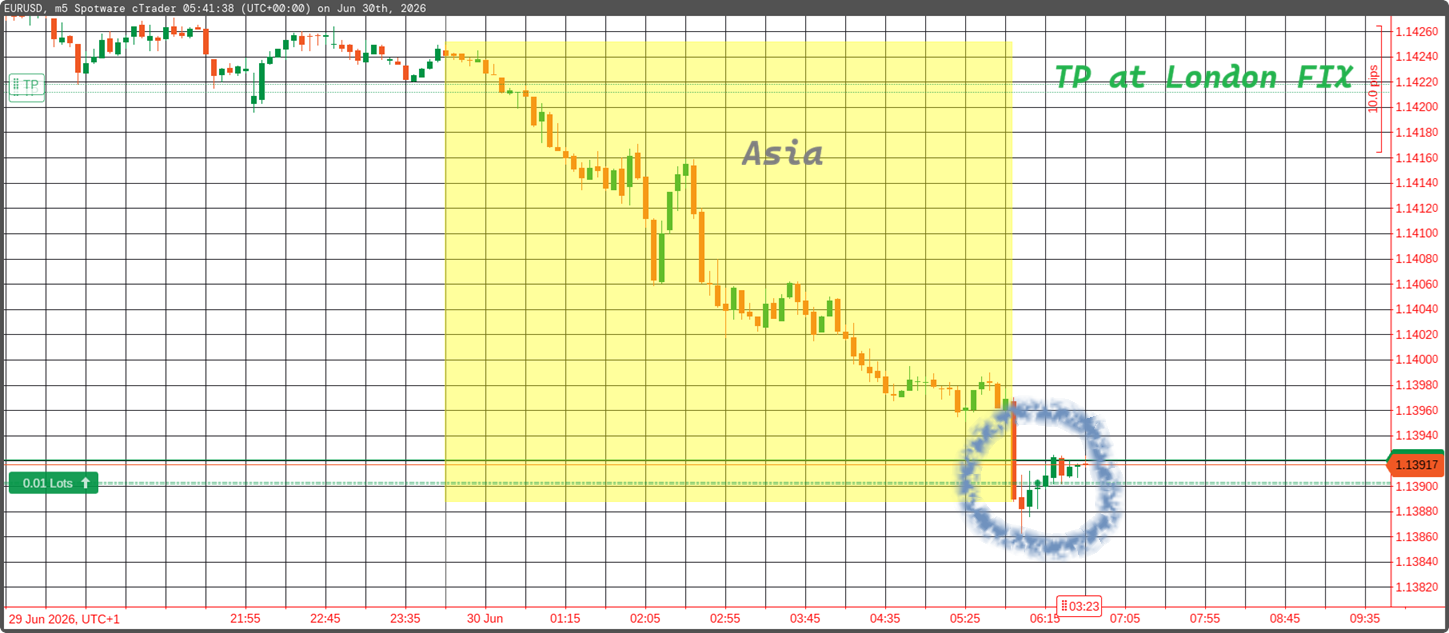
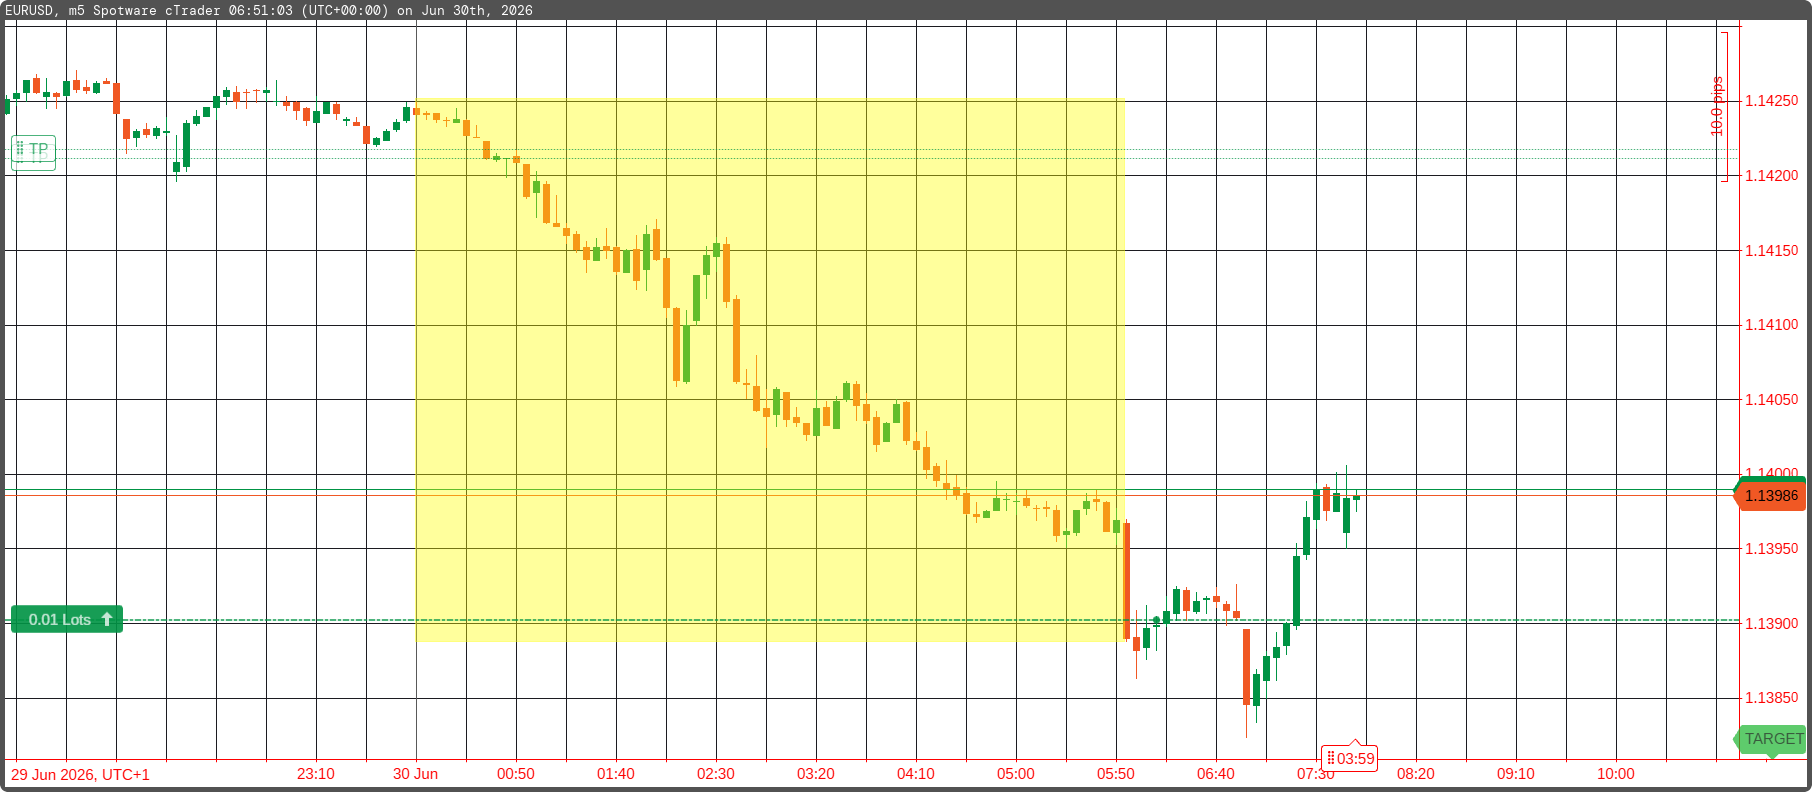
Today was German PMI data release day, the playbook was price would push towards the nearest hourly high or low and reverse. That's what we saw happen.
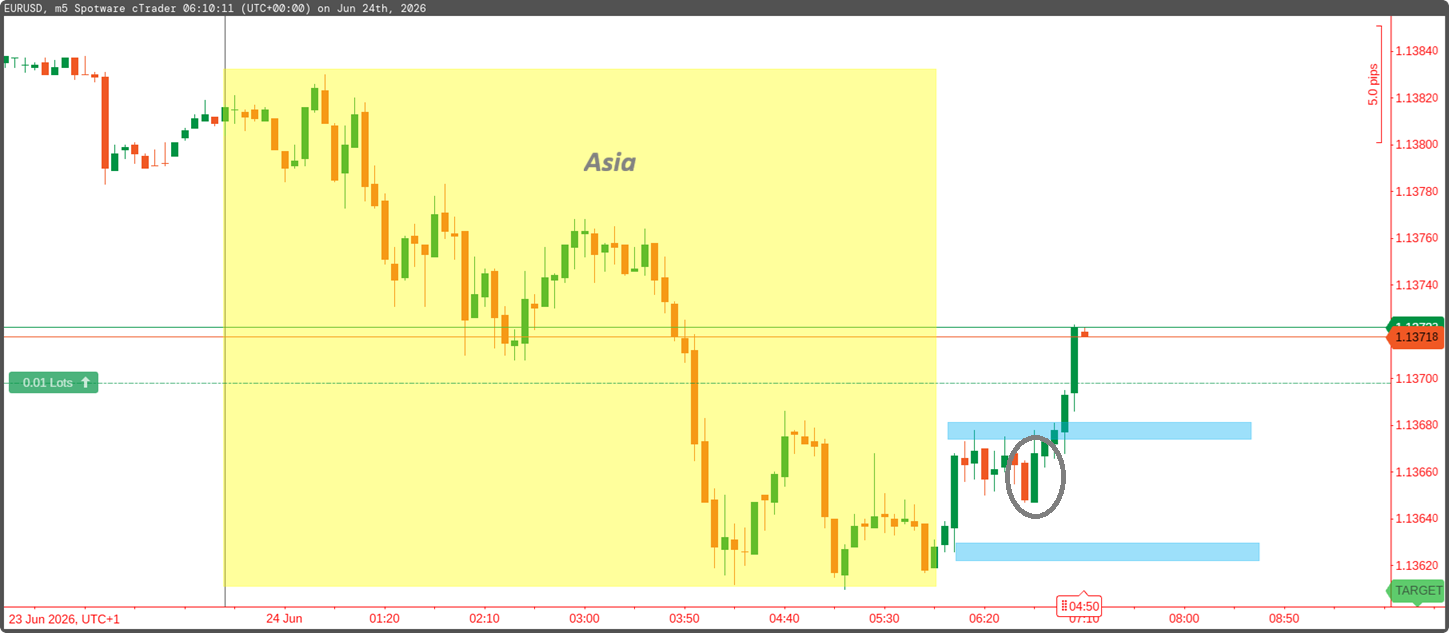
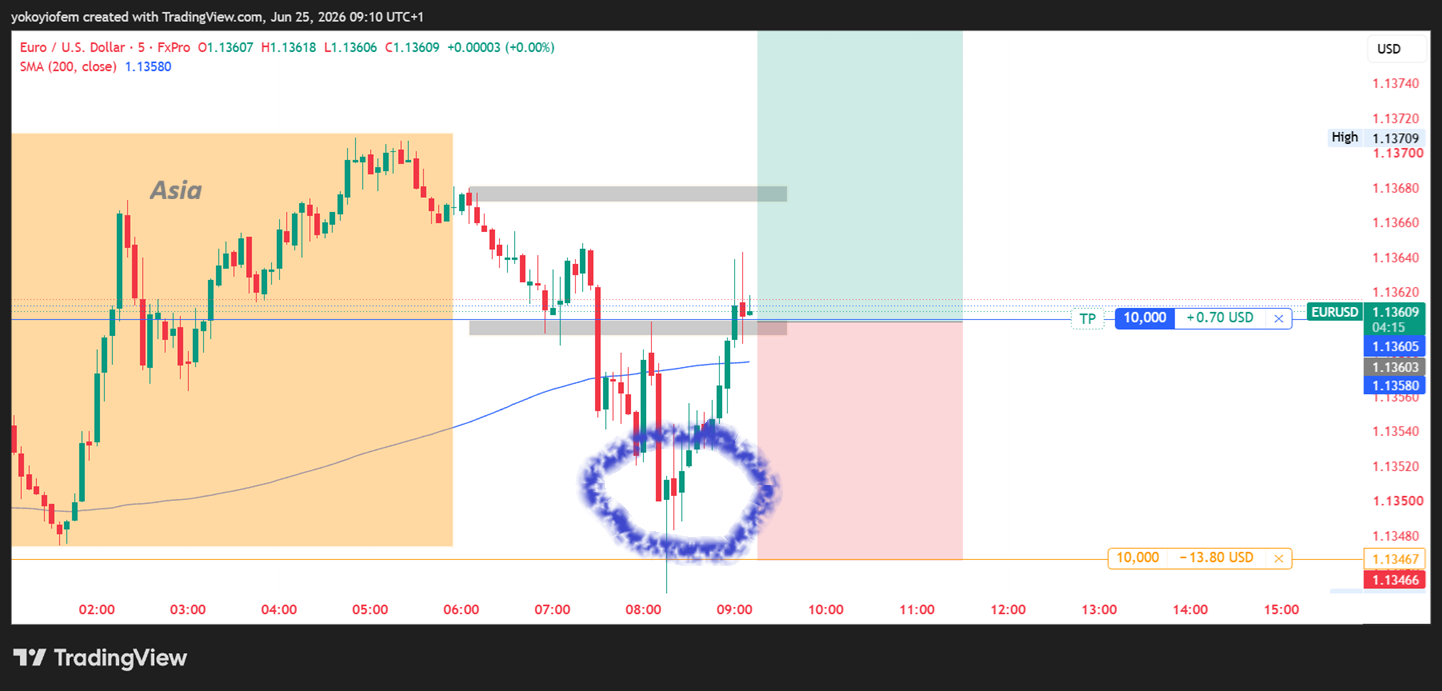
Currently, I have opened a long position with profit target above the Asian box
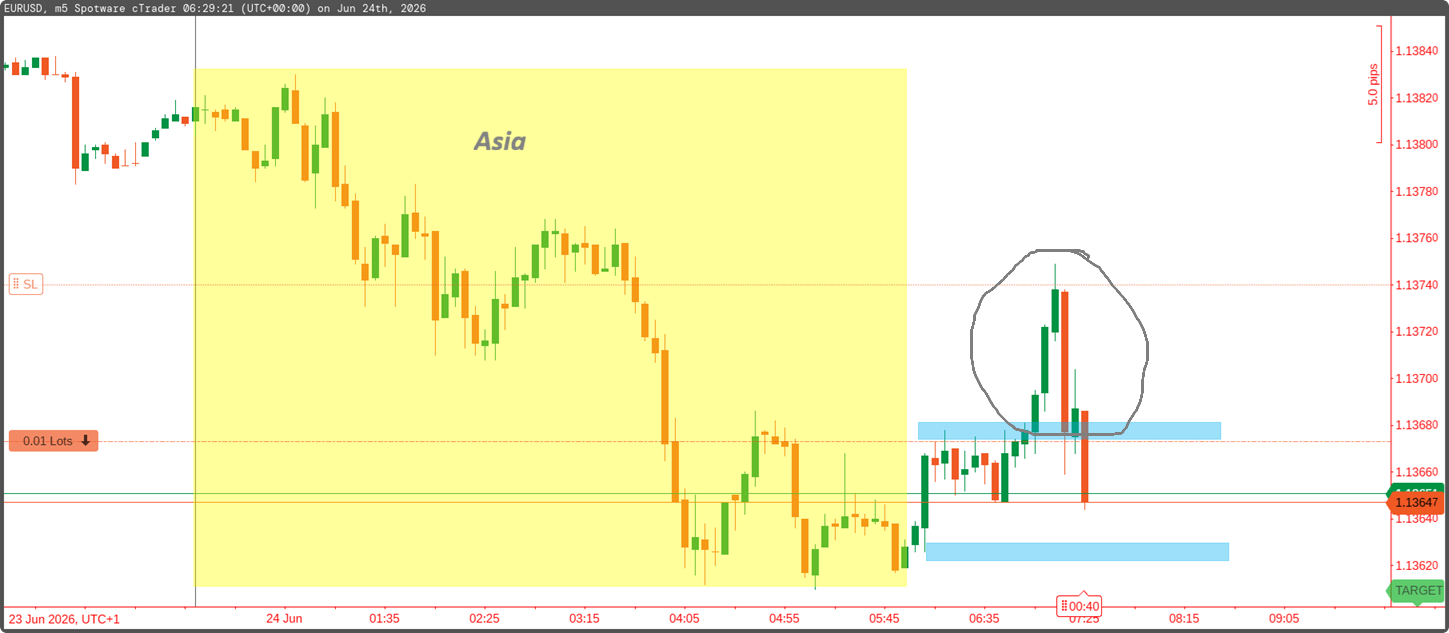
Got stopped out for a small loss, now I have switched bias to sell because a bearish engulfing pattern formed just above the pre-high. My SL is above the bearish engulfing pattern and TP target is at 1.1320
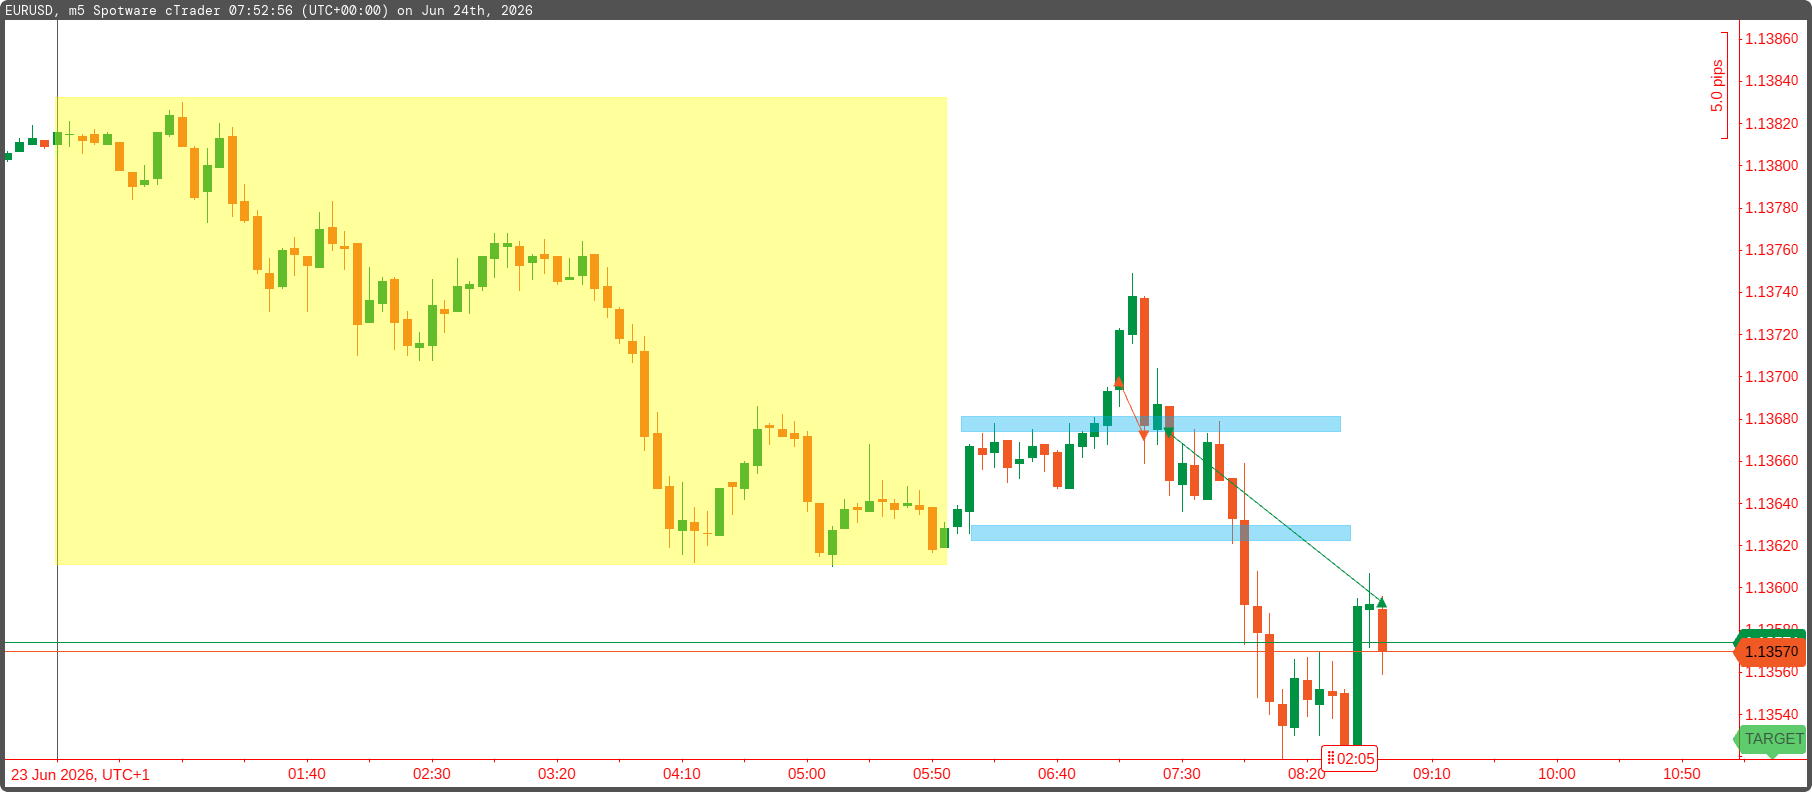
Honestly, it is a crap touch & go market. It does not even test the hourly highs completely. I had a buy at 65, went almost 10 pips, I did not take it & was stopped out for -2.
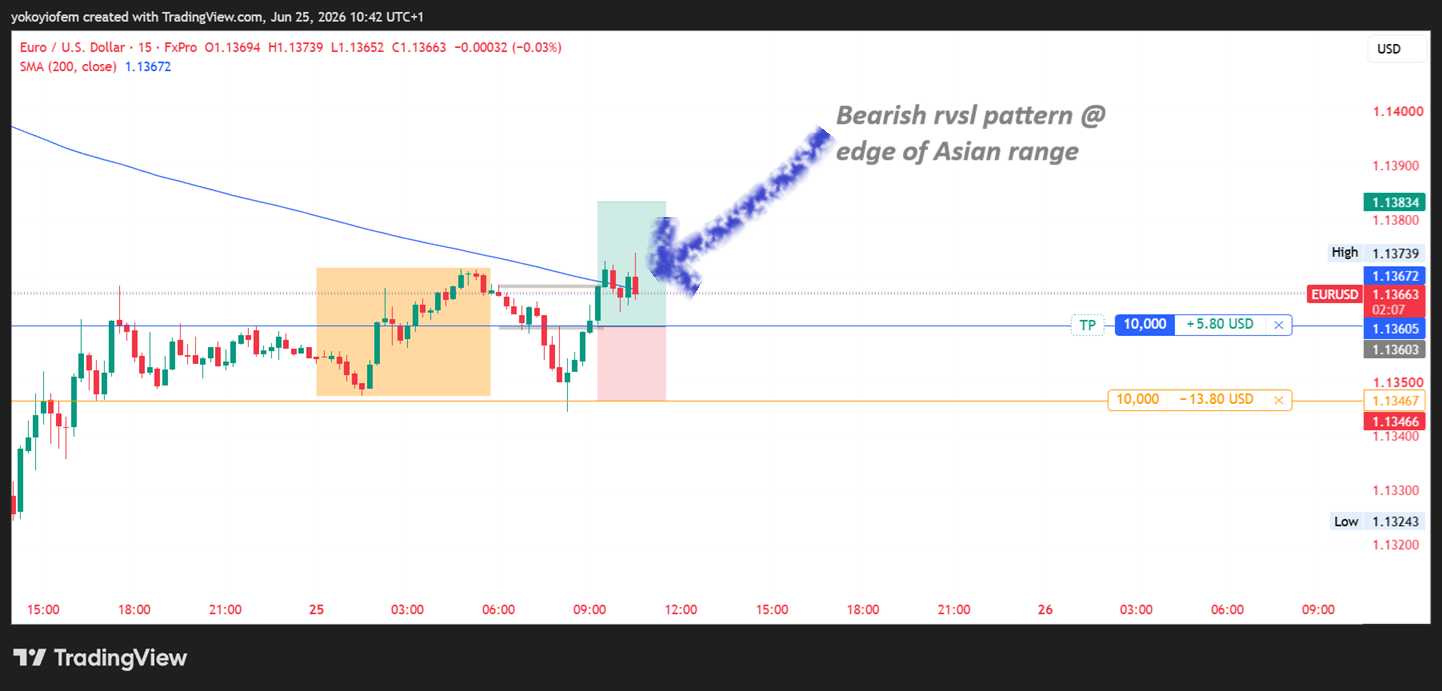
i exited with profit when I saw price reacted at the edge of the Asian box and formed a bearish rvsl pattern. These days, price has not been testing the hourly highs and this pattern may go on for some time
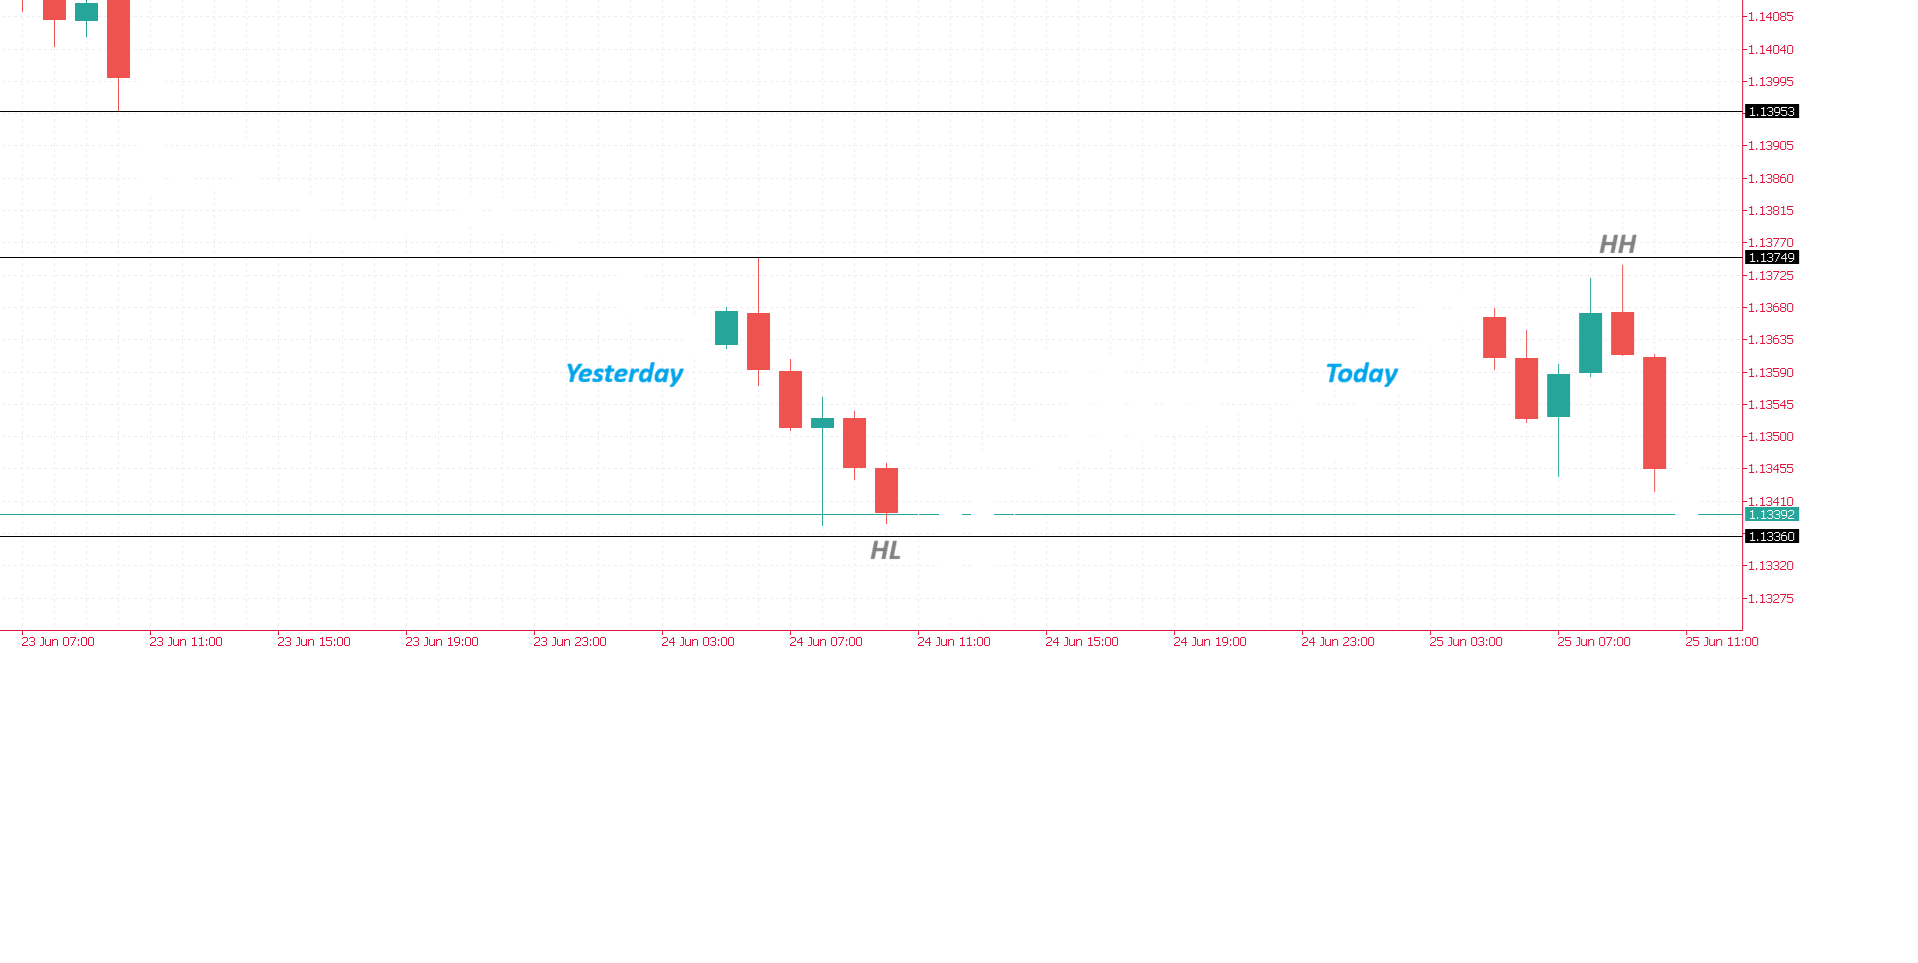
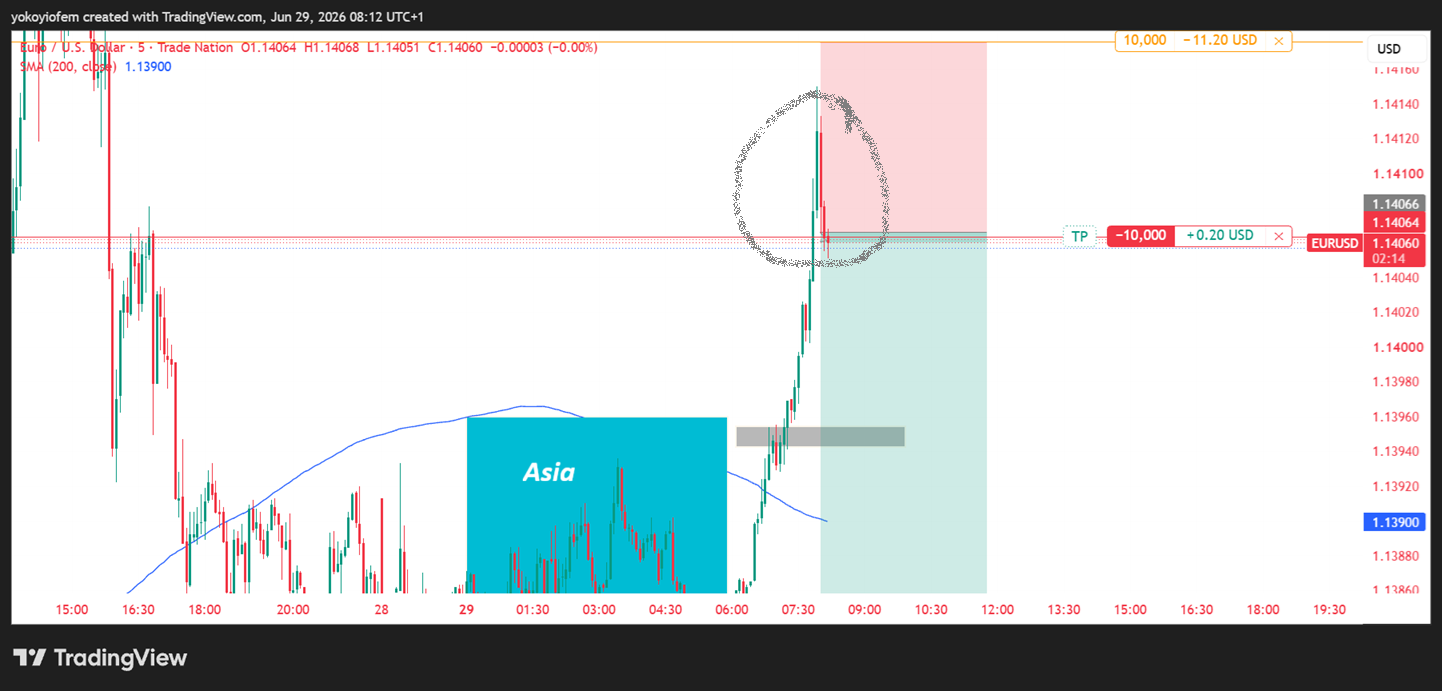
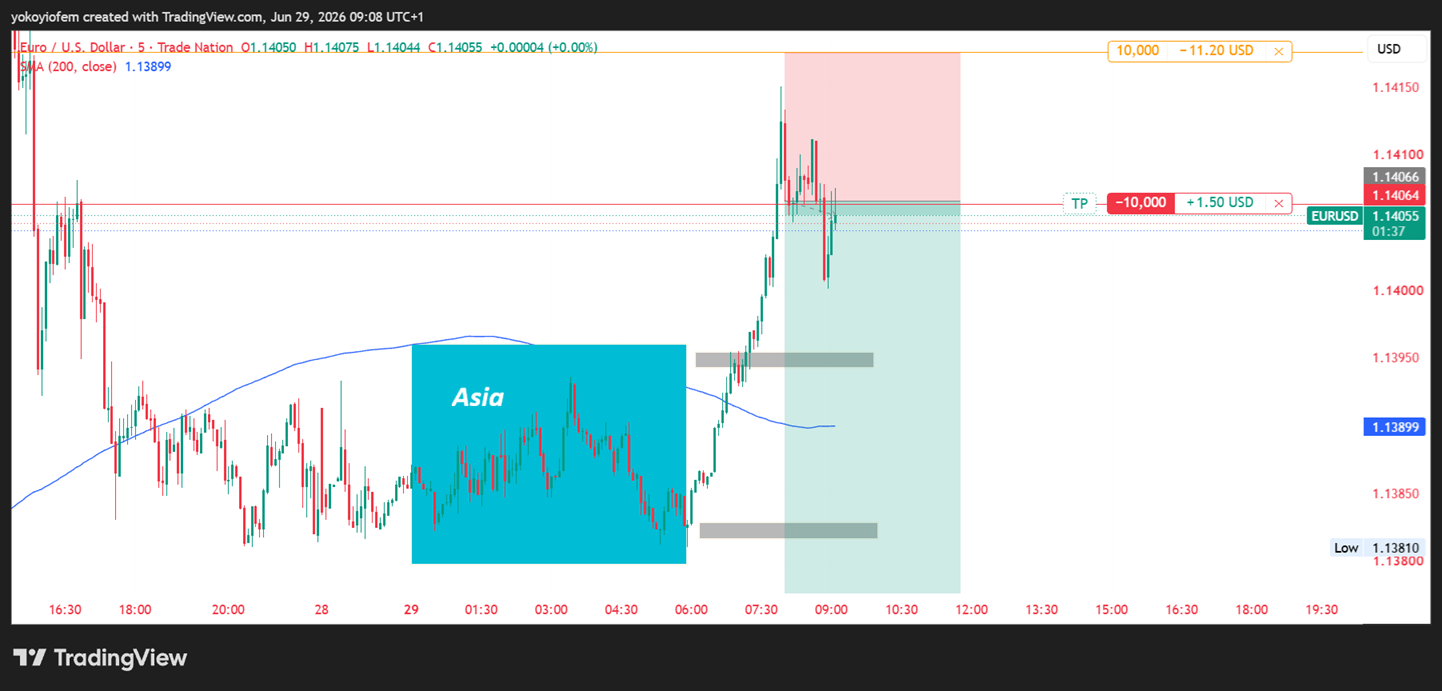
Yesterday the London session ended without price testing the nearest hourly low (HL) and today price went close to the nearest hourly high (HH) but didn't test it before reversing. This is a pattern I am beginning to see and it may last for the remainder of the month
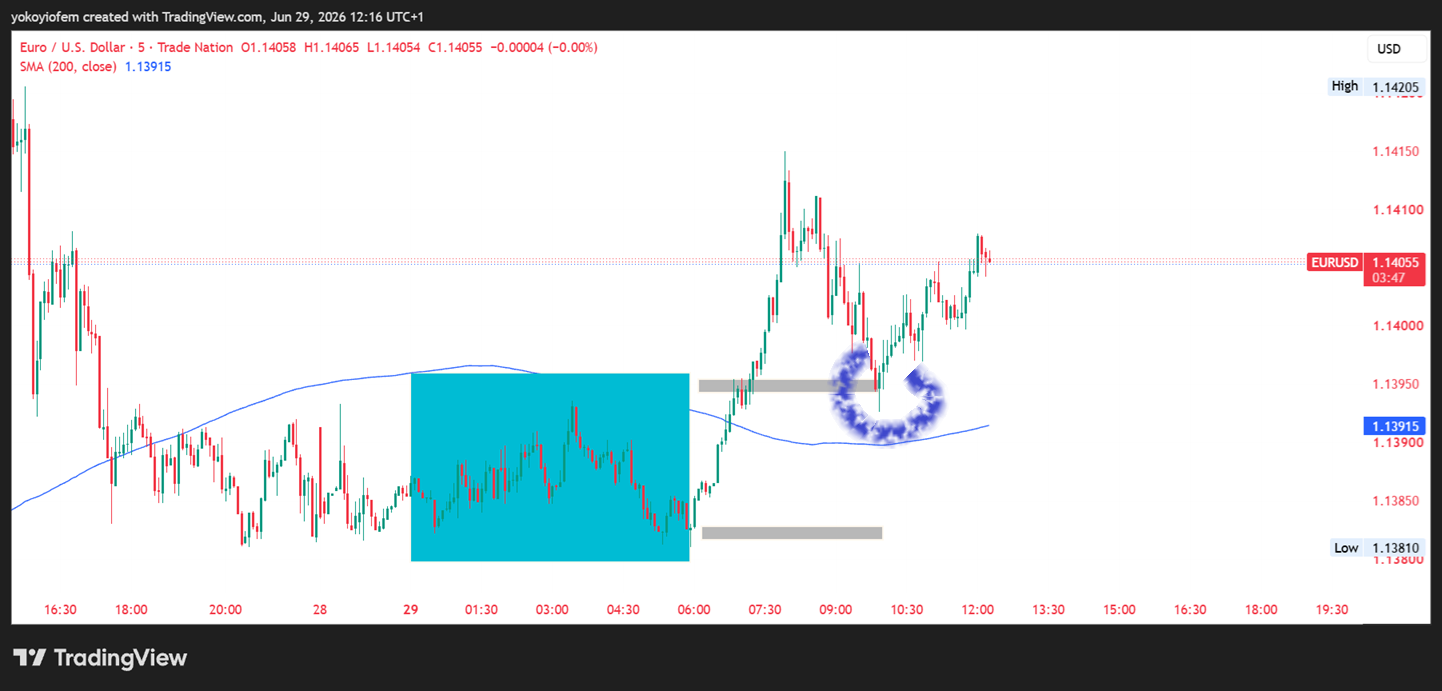
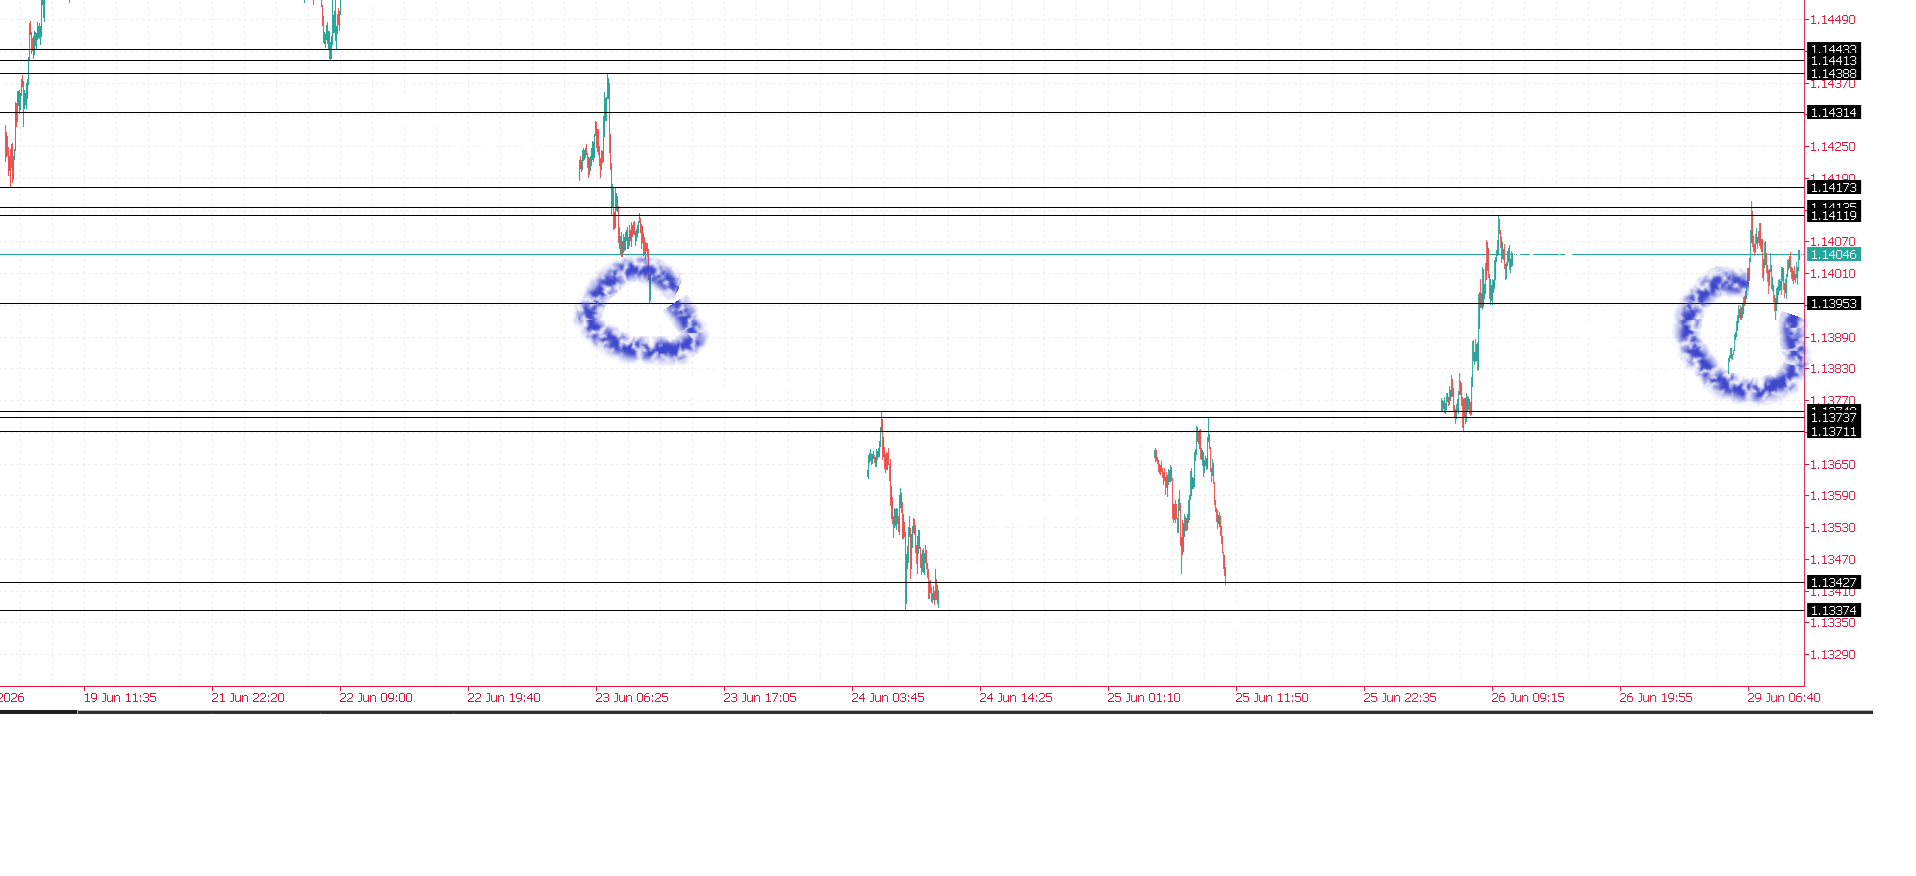
Its a good thing I took profit and closed out, price has reversed all the way up. The reason I closed out was because looking t the session map, price rejected at 1.1395 which is the London session low of last week Tuesday (23rd June) which is a key level for me. See the blue circles I marled out on the session map screenshot