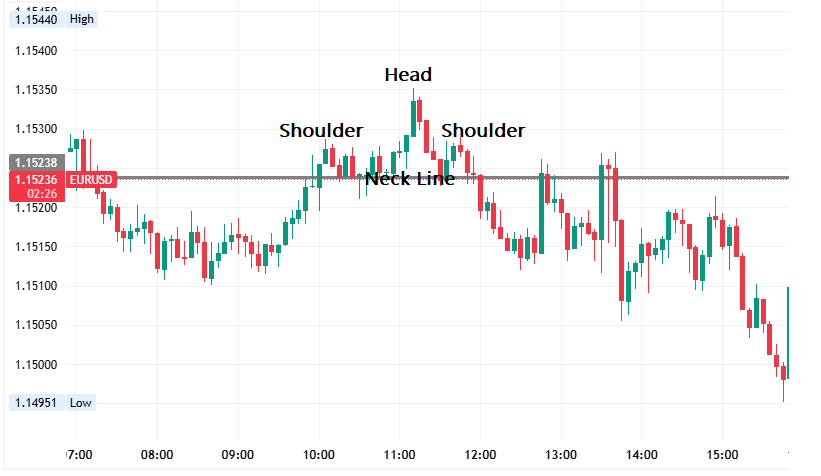
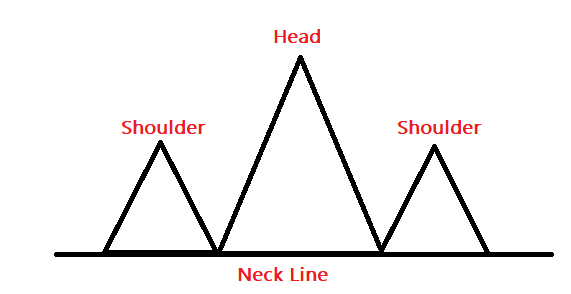
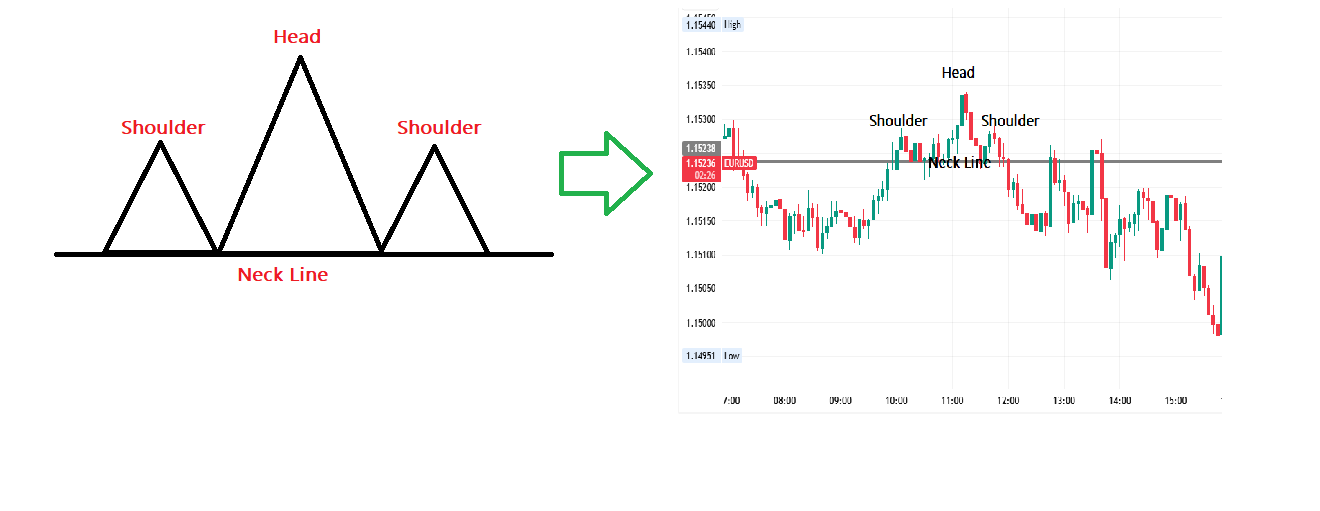
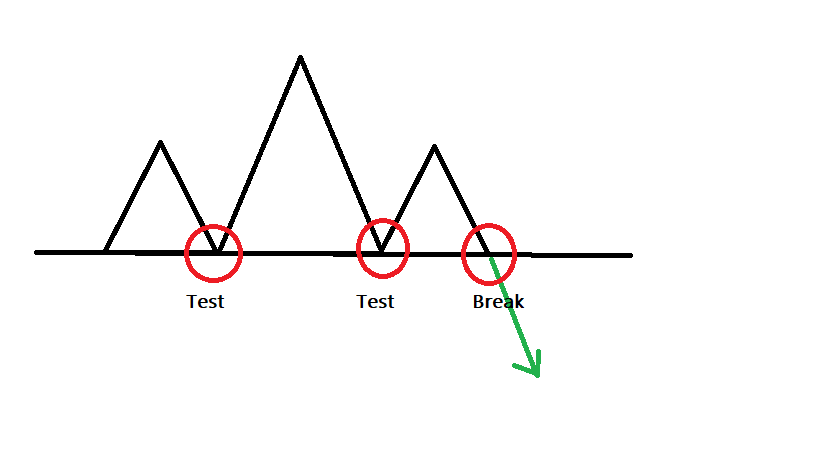
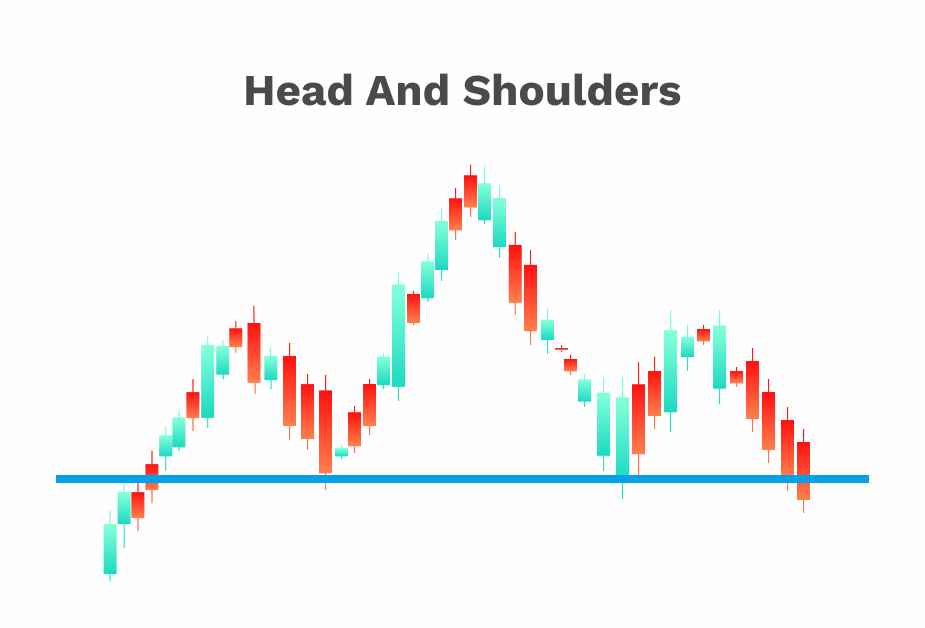
head and shoulder pattern
K
@kemi_allen_omevia
-
1 year ago
H
@headies25284
-
4 months ago
H
@headies25284
-
4 months ago