HOW TO TRADE INDICES

« Previous 1 2 3 4 5

Discussions on Best way to analyze and trade US Indices, European Indices, and Asian Indices.

N
@nsg_usd - 2 months ago

How to trade NIKKEI (JP225) as a Retail Trader.

JP225 is Japan's leading Stock index, which tracks the performance of 225 major companies listed on the Tokyo Stock Exchange. This is a popular index that forms clear market structures and strong trends and has high intraday volatility.

It's simple to trade and has not as volatile as Gold, or Nasdaq.

As a retail trader, you can trade it on a regulated CFD broker (most forex brokers offer it). search for the name or the symbol on your broker and add it to your watchlist.

Trading Approach : Jp225 is most active around the Tokyo market open, when liquidity is highest and spreads are usually tightest, But it also has good trading volume during NY sesion.
You can plan your trades around these sessions.


Key fundamental influences

-Bank of Japan (BOJ) interest rate decisions
-Japanese CPI and GDP
-US market performance especially Nasdaq-100
-Global risk sentiments
-Positive correlation with USDJPY

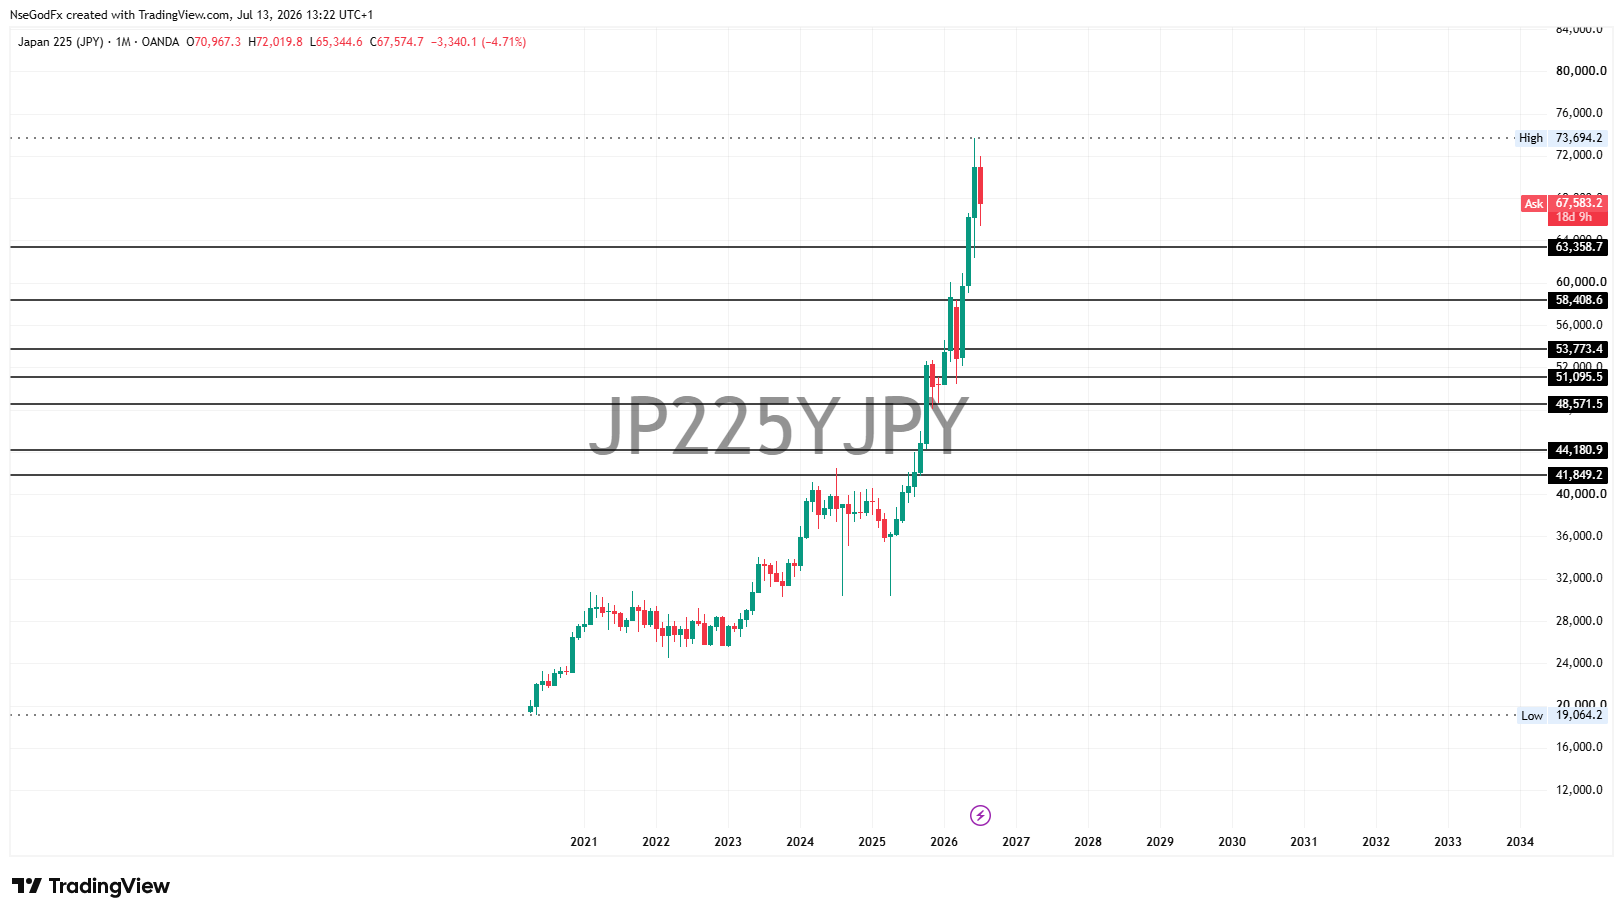
You can use the Charts on TradingView for your technical Analysis, Like the one below.

N
@nsg_usd - 2 months ago
Quoted - nsg_usd

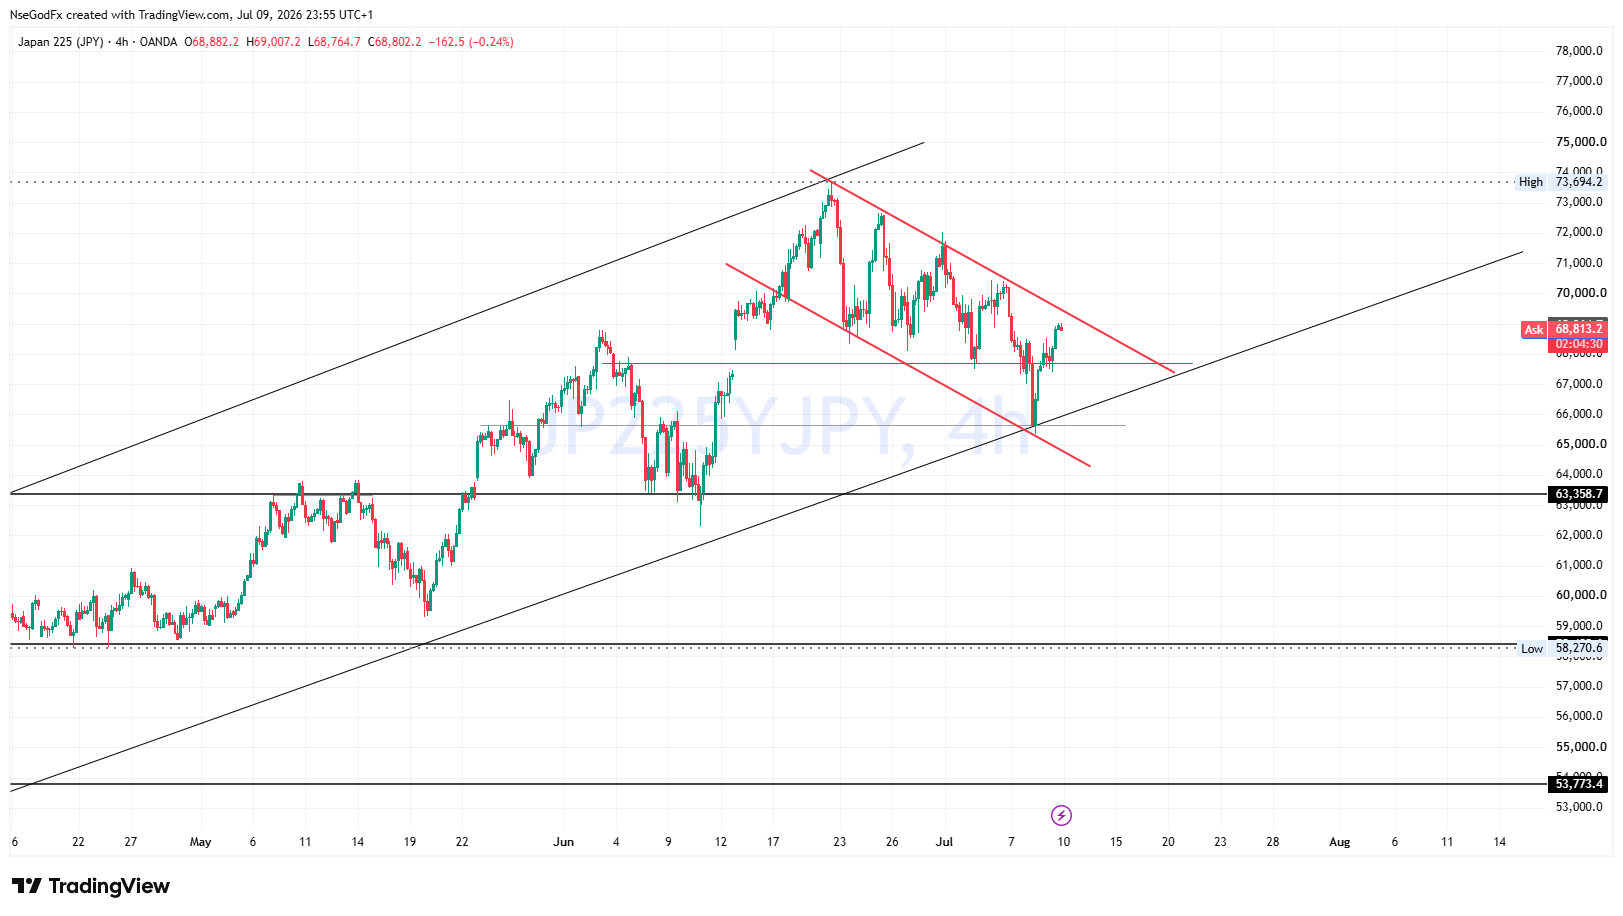
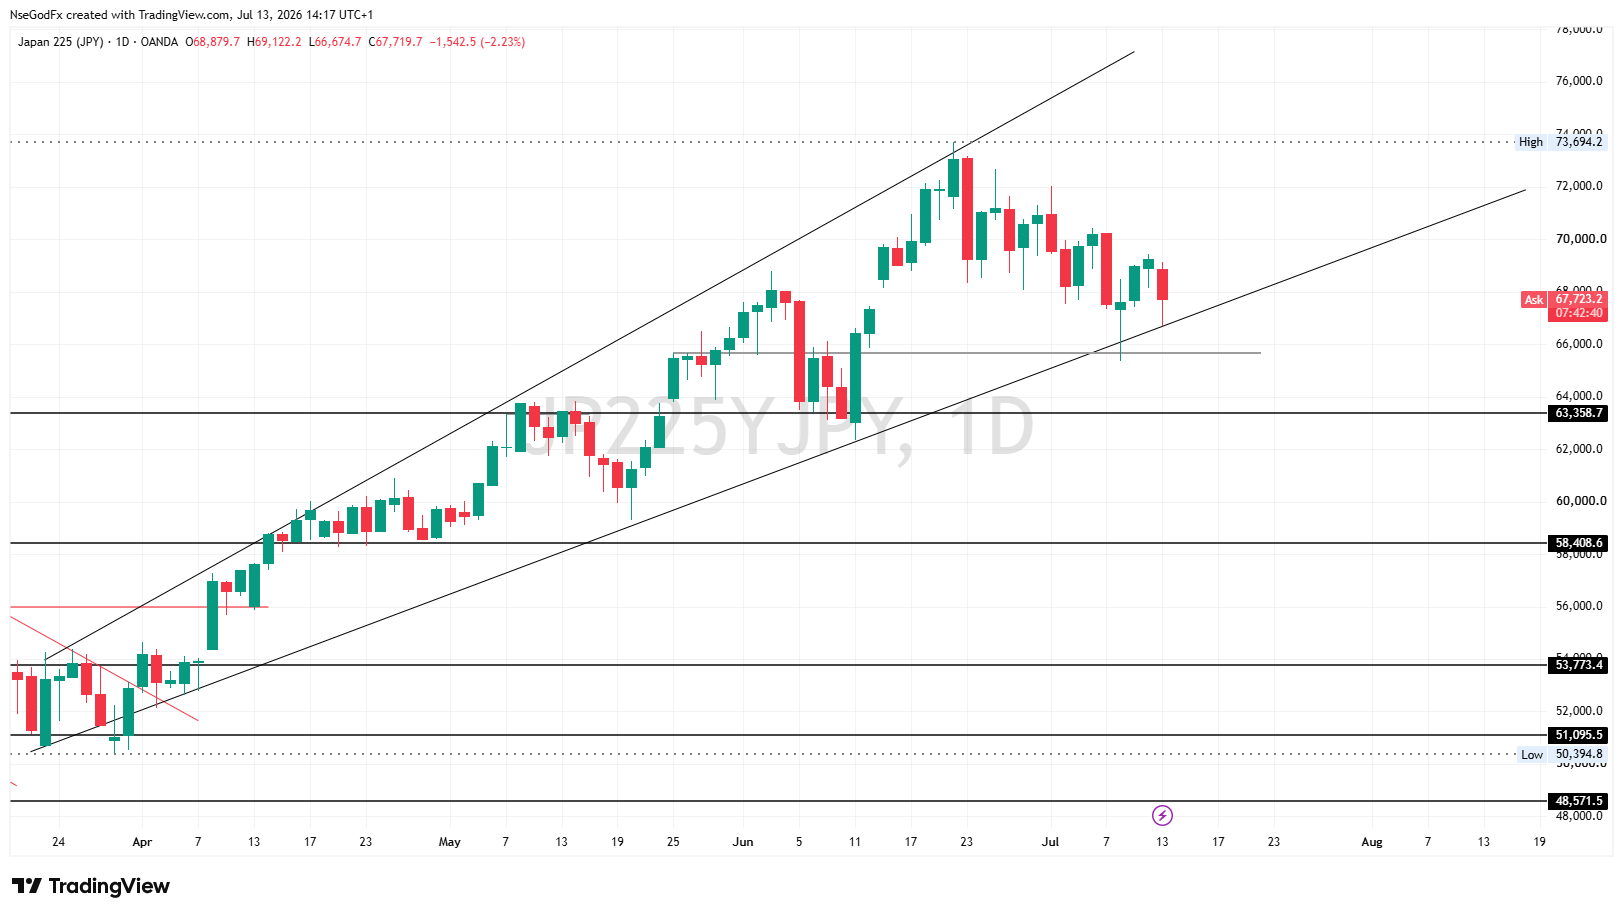
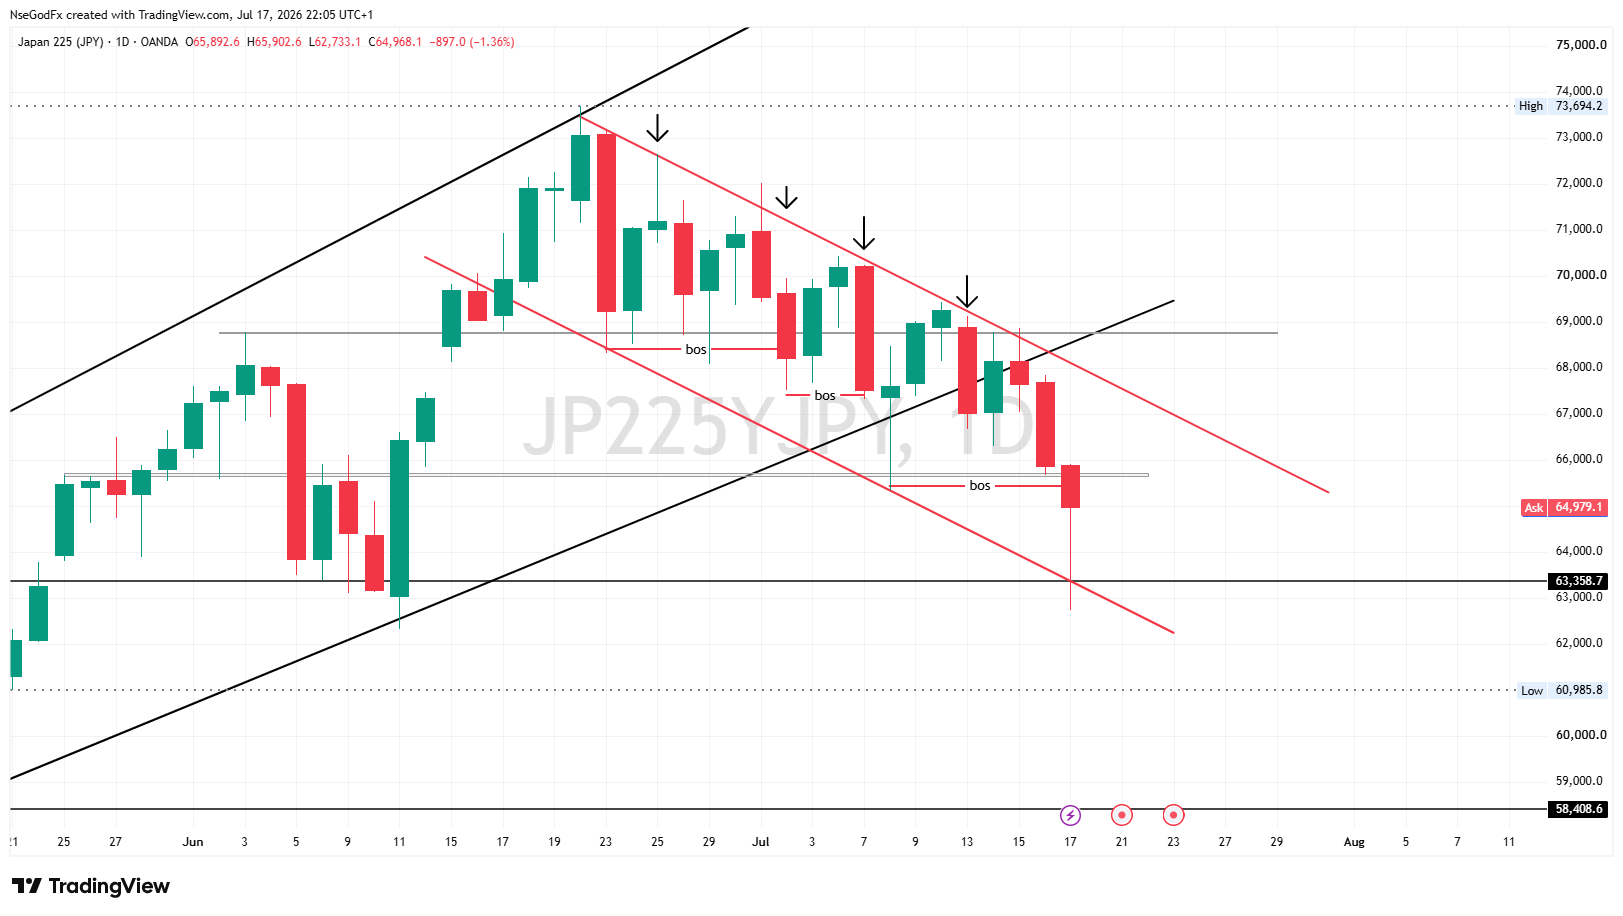
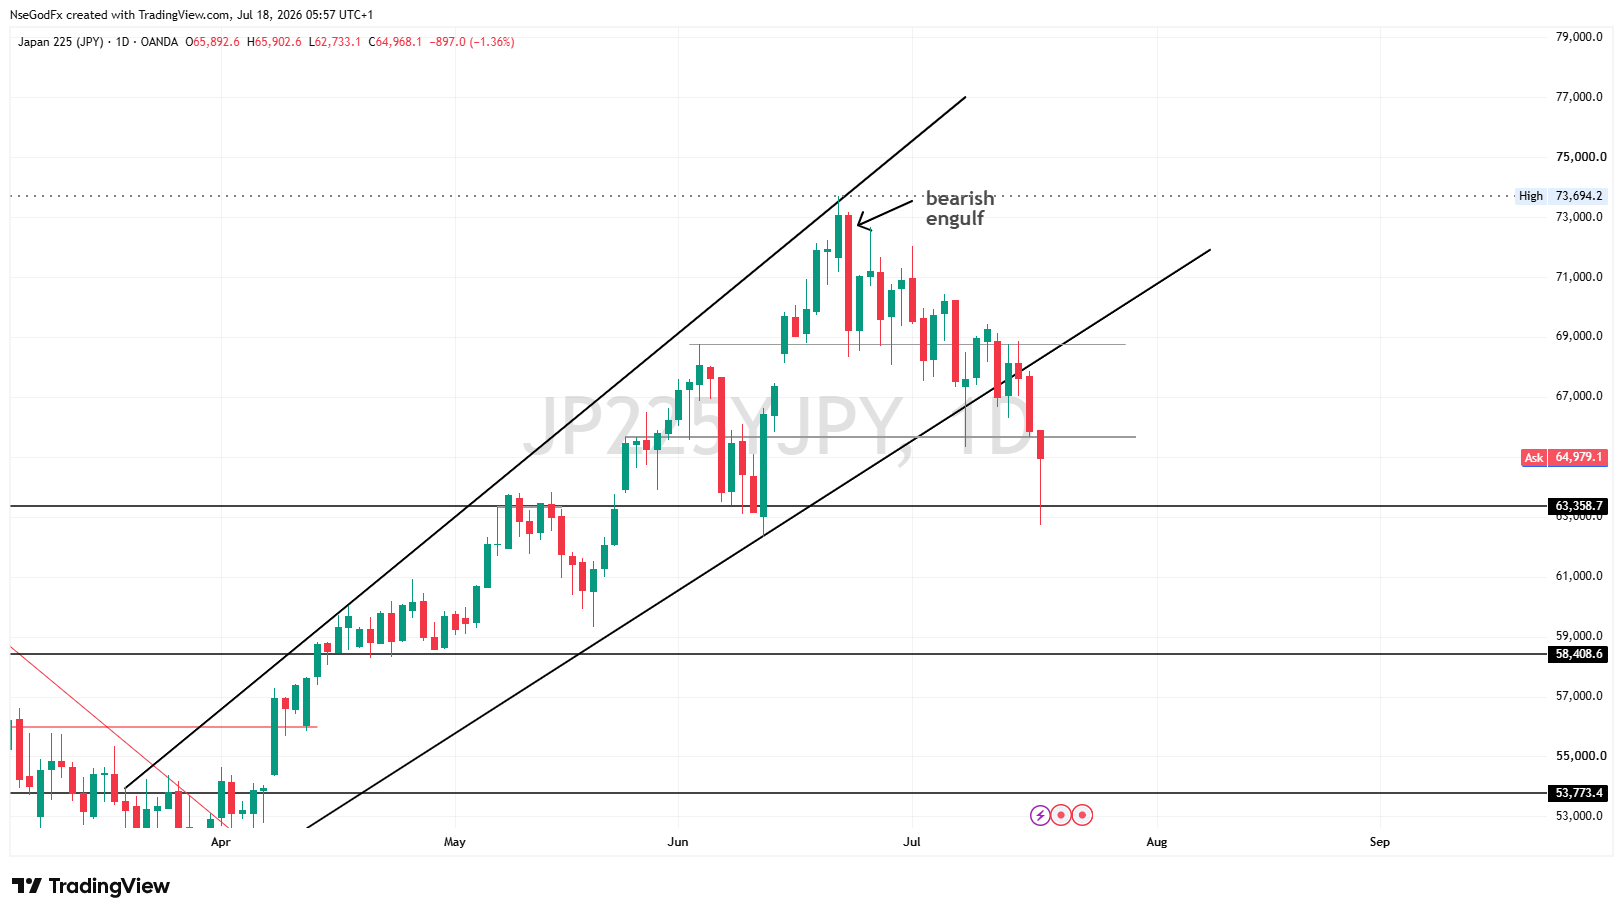
JP225 Daily Trend Analysis
Bias: Bullish
Technical Outlook: Ascending Channel

Price has been clearly respecting the Upper and Lower boundaries of the Ascending Channel multiple times, indicating an established uptrend.

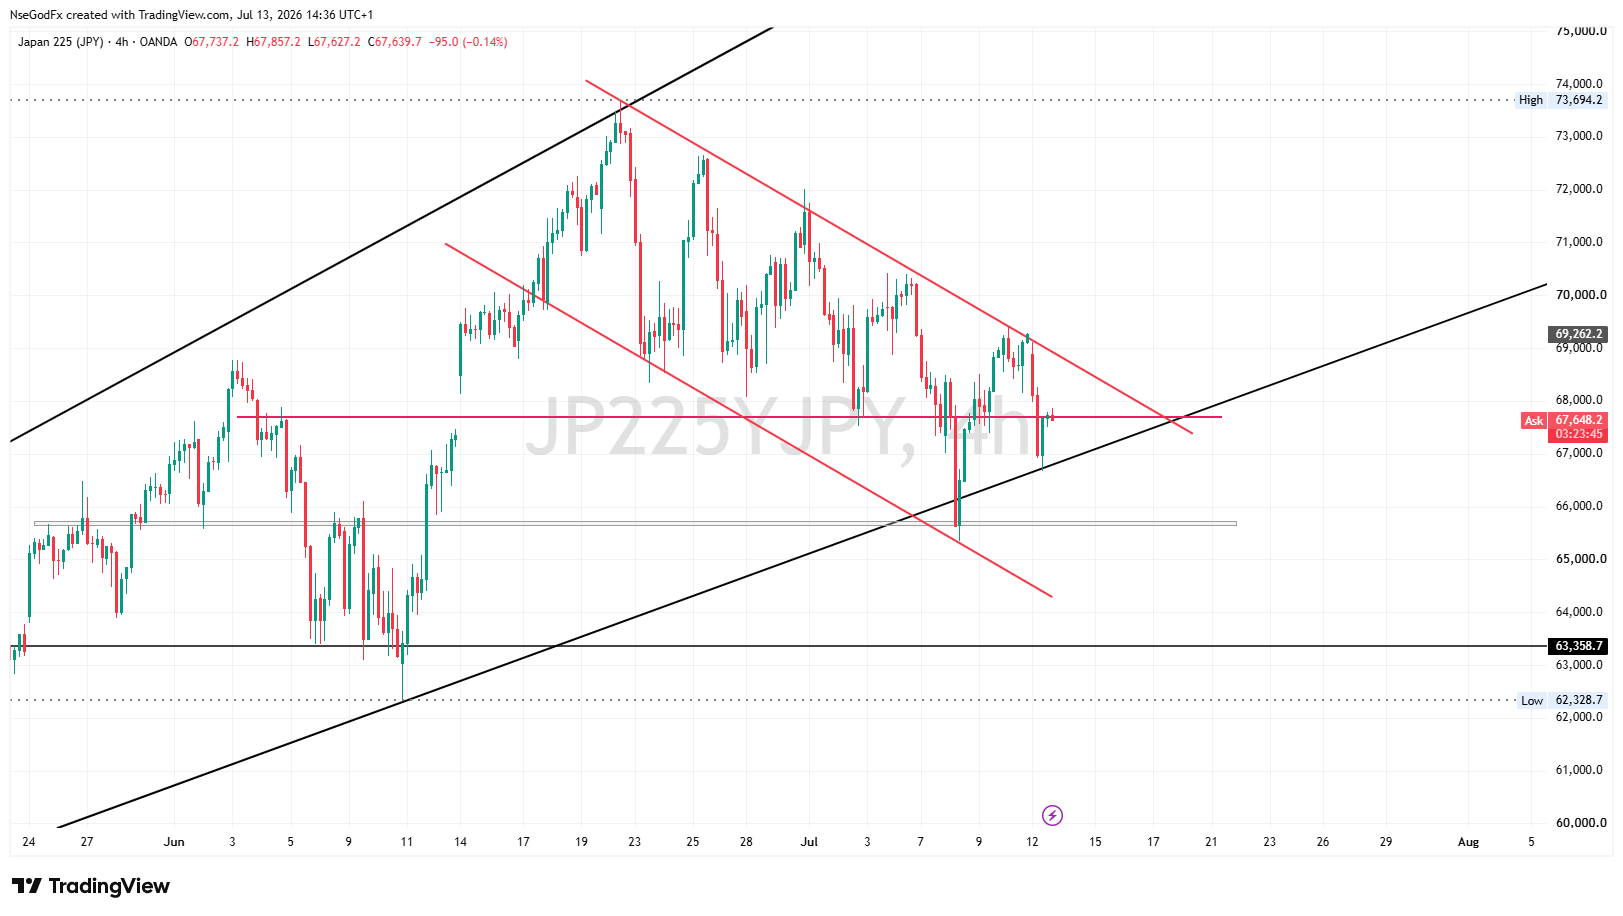
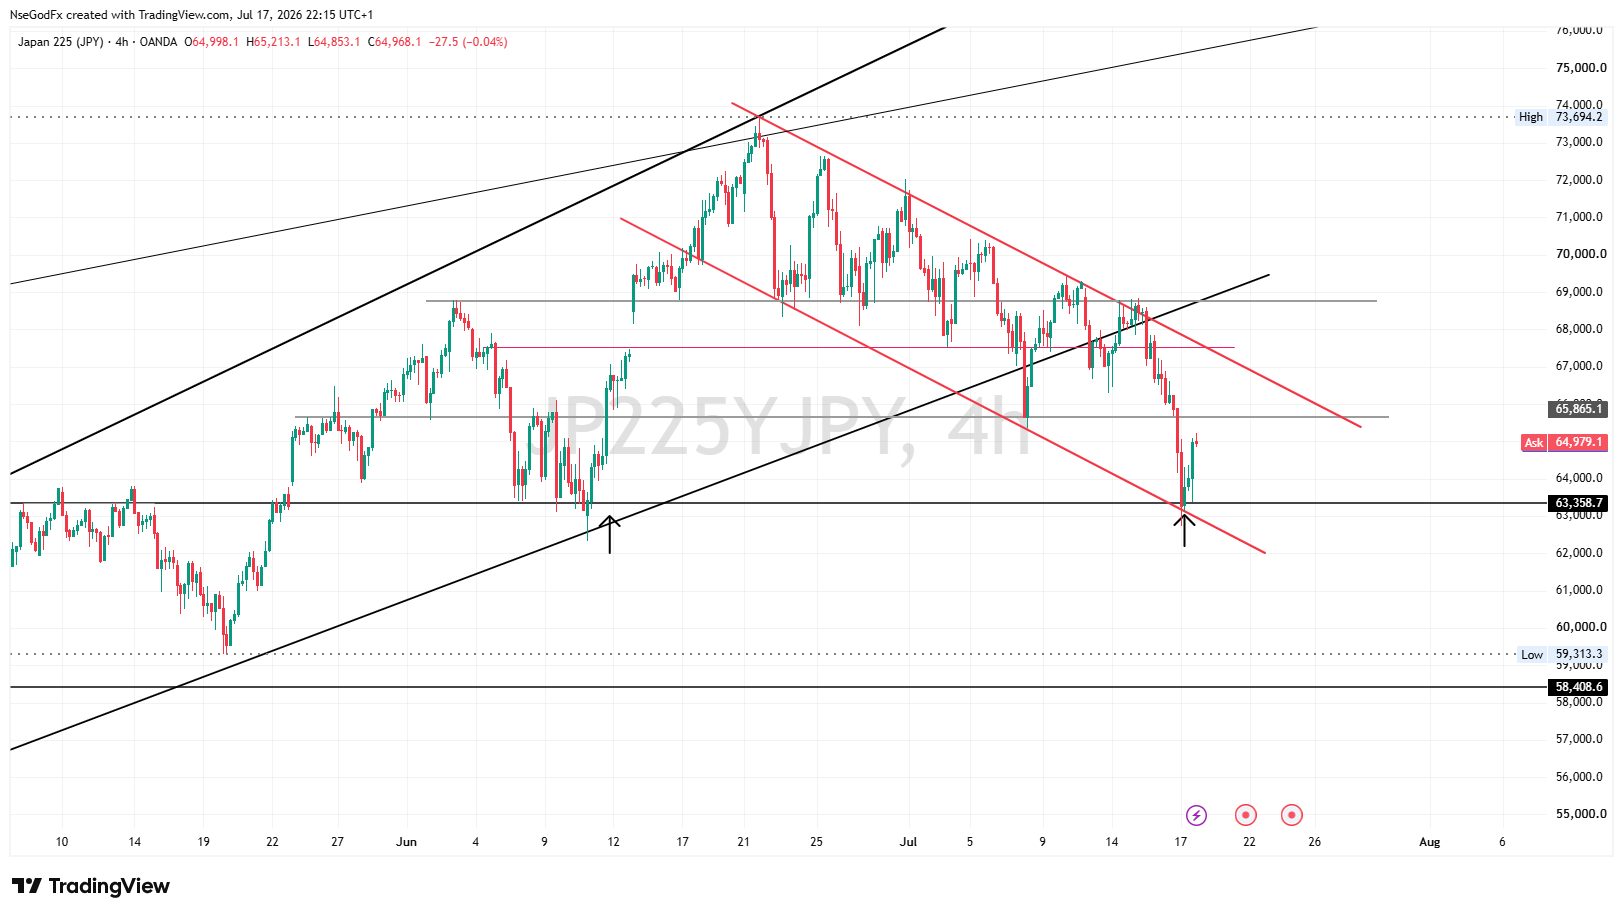
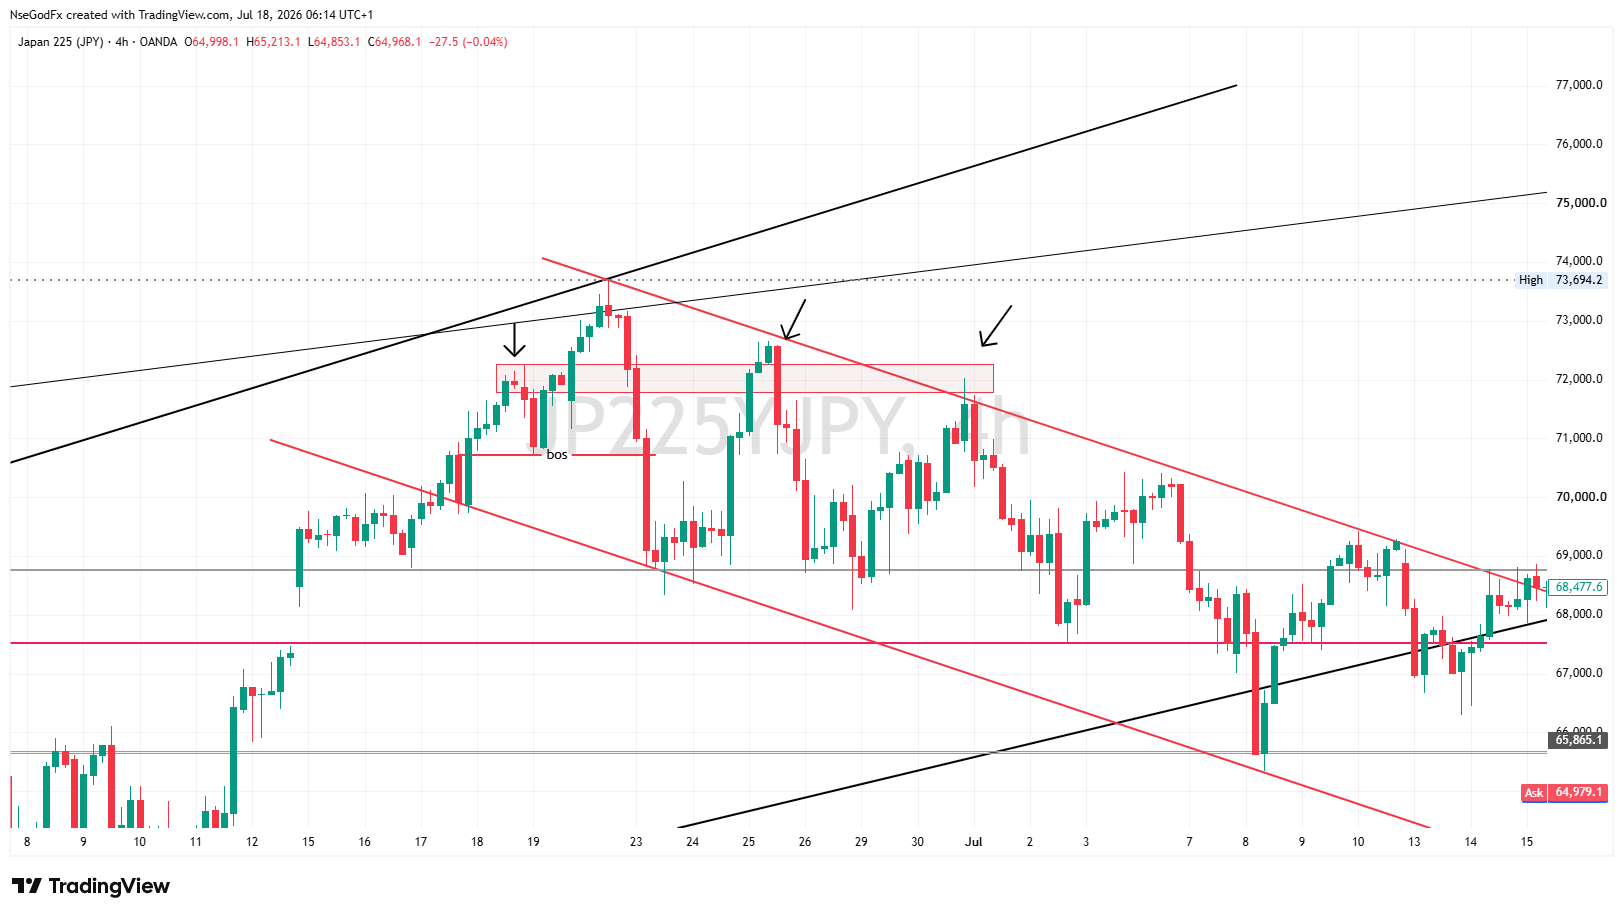
JPY 4hr Trade setup - Price formed a bullish flag pattern which signifies a bearish consolidation phase. This has lasted for weeks and there's yet to be a confirmation that it has ended.

N
@nsg_usd - 2 months ago
Quoted - nsg_usd

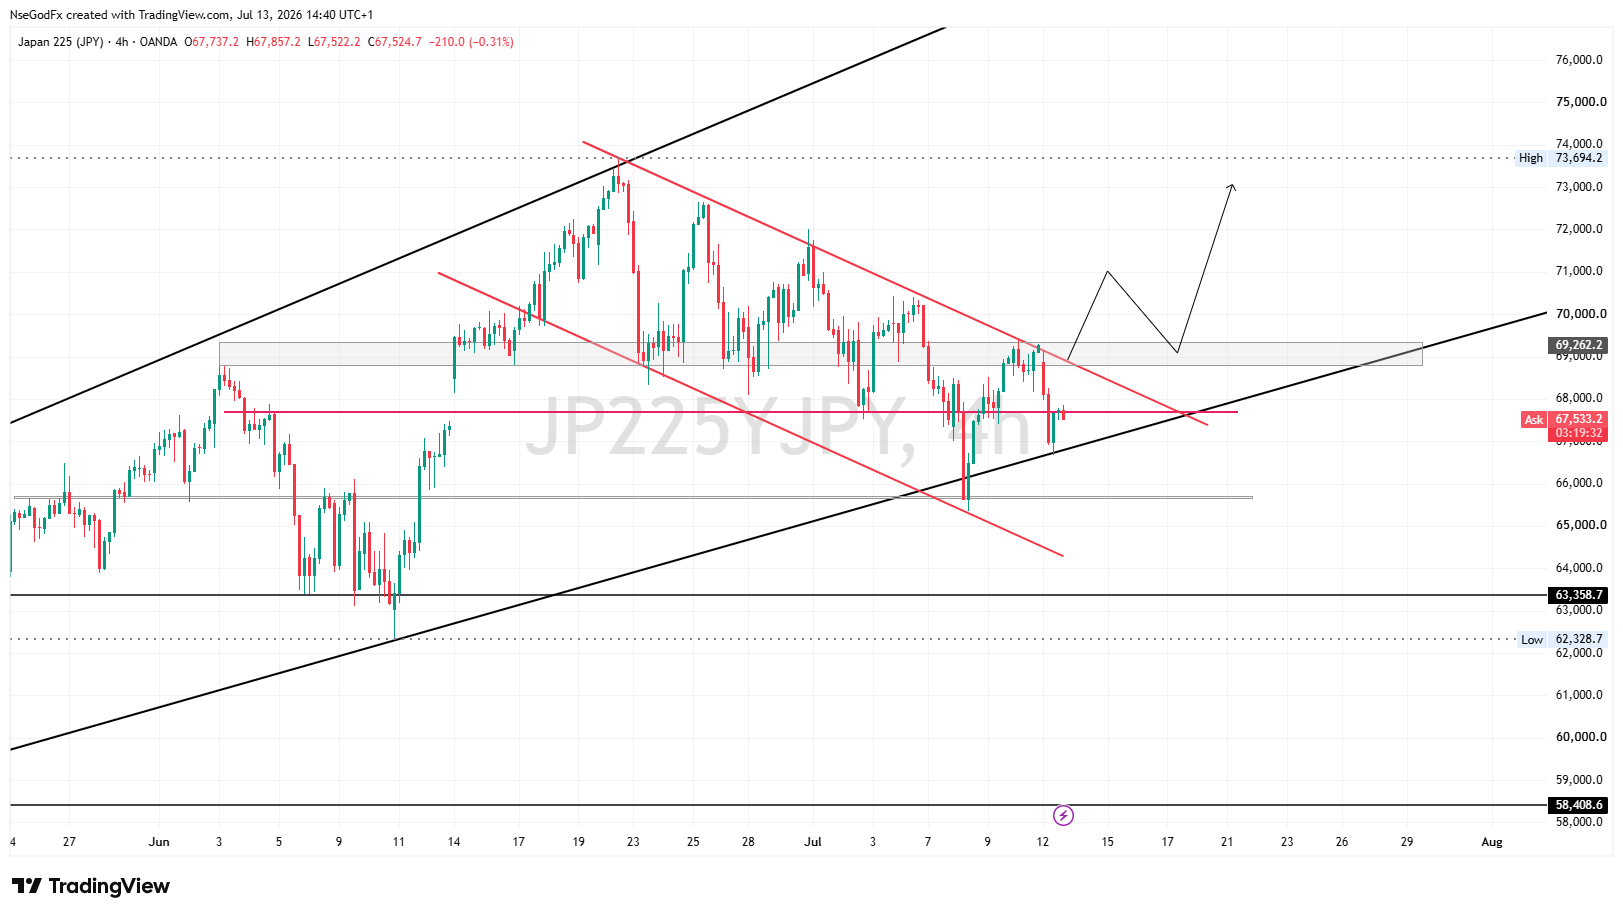
An upside break above 69340 price region will signal the end of the bearish consolidation

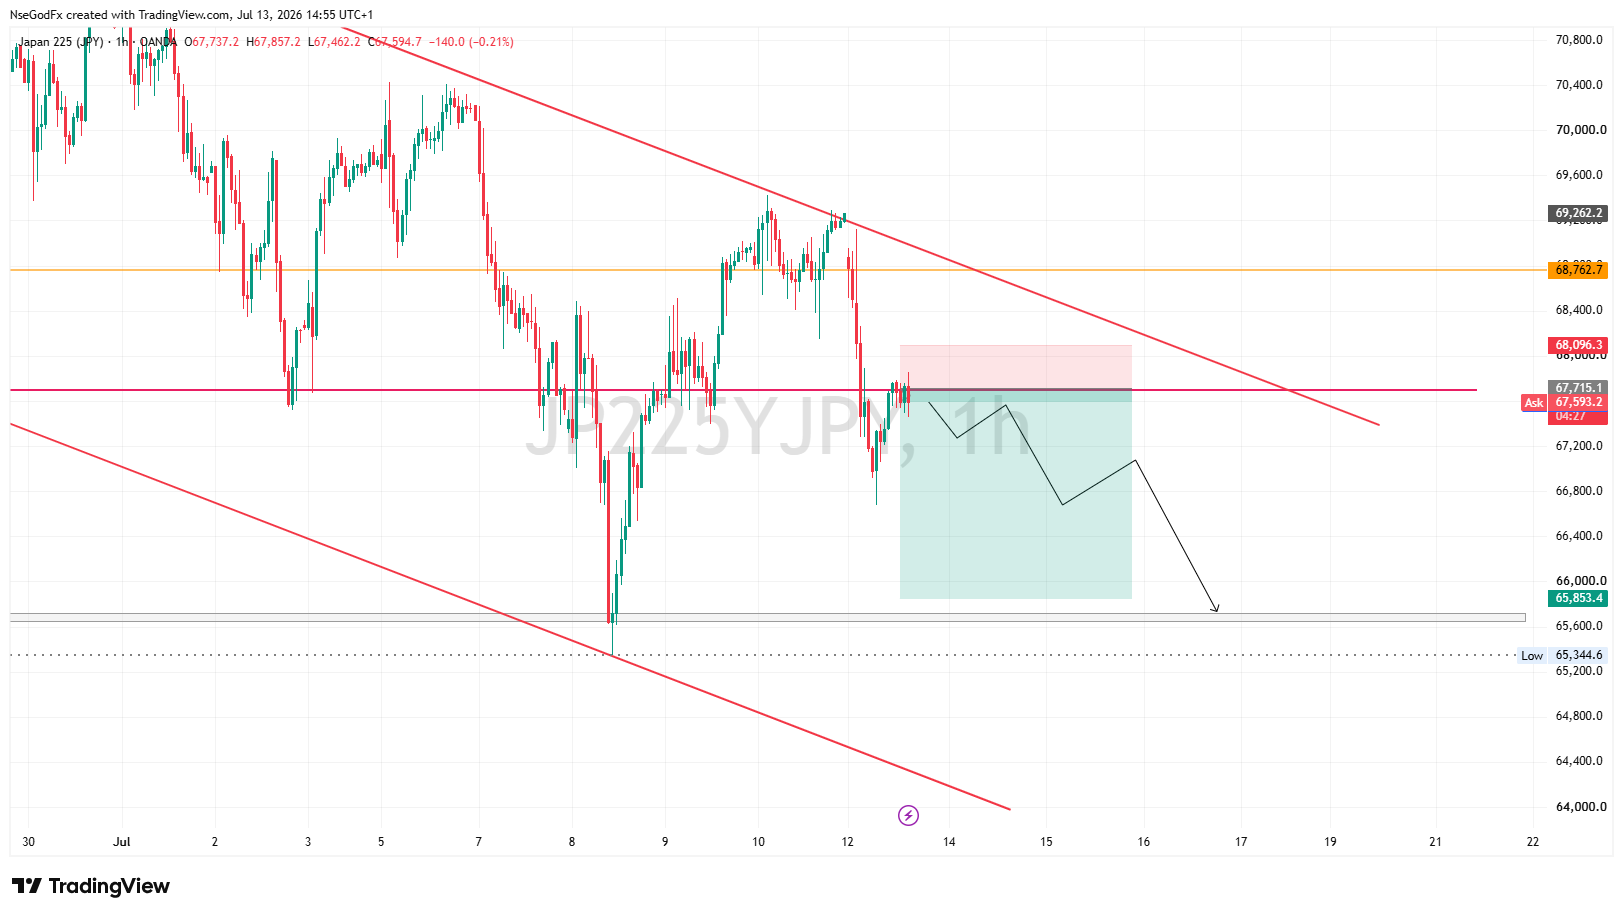
on 1hr, there's good chance of witnessing price decline from current price level 67618 to 65600

N
@nsg_usd - 2 months ago

NIKKEI- Market Summary for the Week

Timeframe: Daily
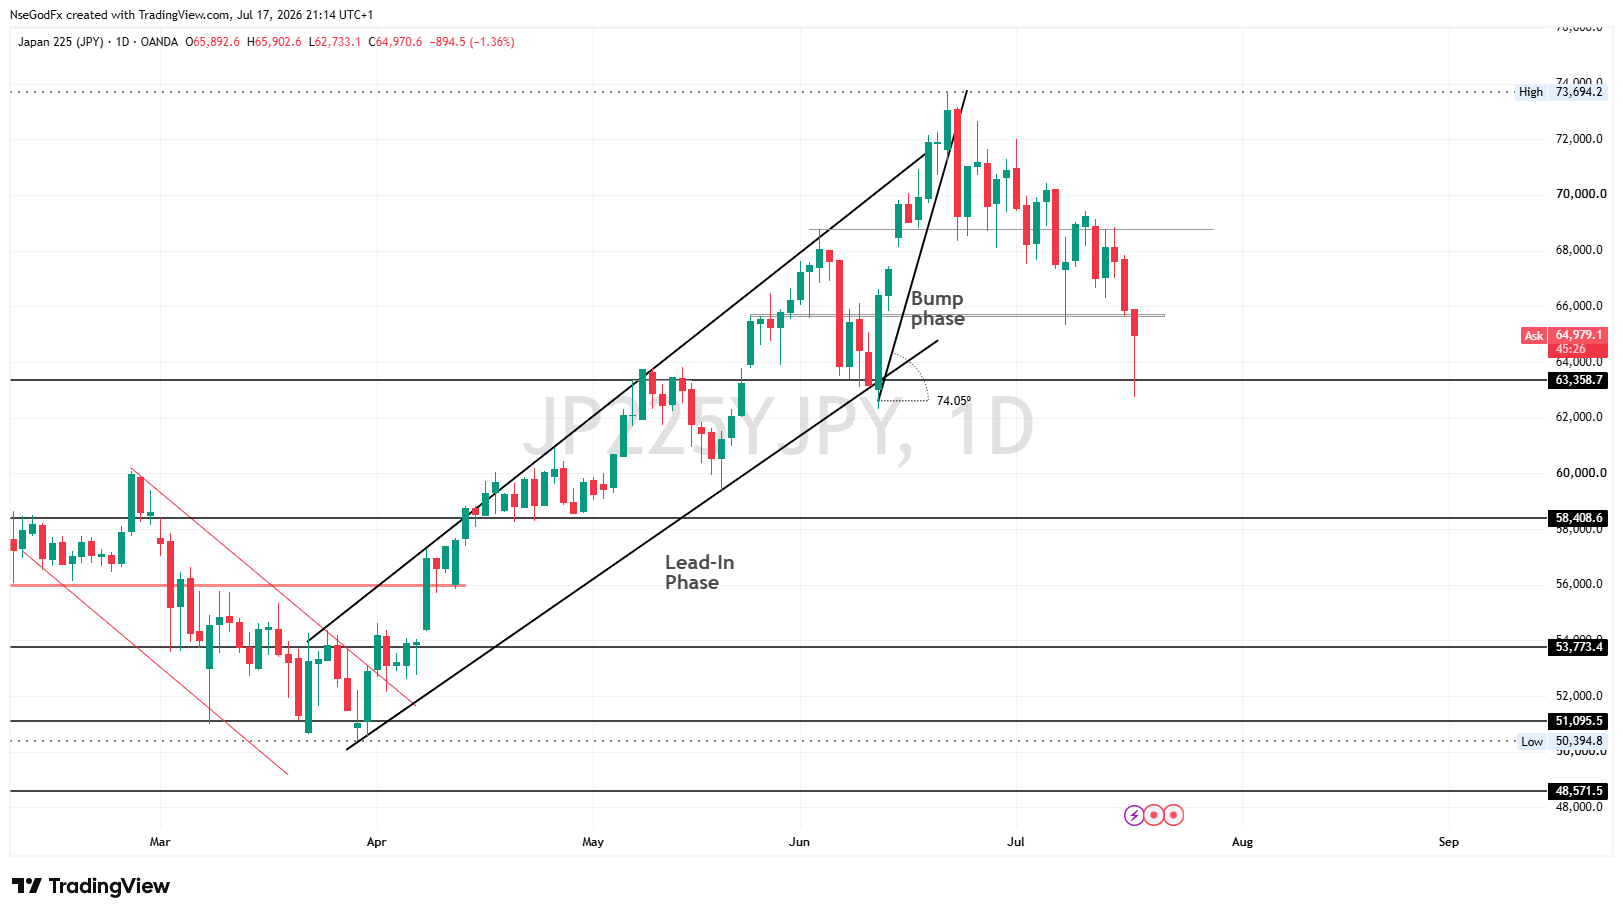
Primary Structure: BARR Pattern (Bump and Run Reversal Top)

The Bump and Run Reversal (BARR) is a powerful chart pattern that signals the end of a strong uptrend. It forms when price accelerates into an unsustainable rally (the bump) before breaking the trendline support and reversing lower (the run). As a trader, you can use this pattern to identify potential trend reversals, institutional distribution, and high-probability selling opportunities after confirmation.

N
@nsg_usd - 2 months ago
Quoted - nsg_usd

Characteristics of the BARR pattern

The BARR pattern has 3 phases

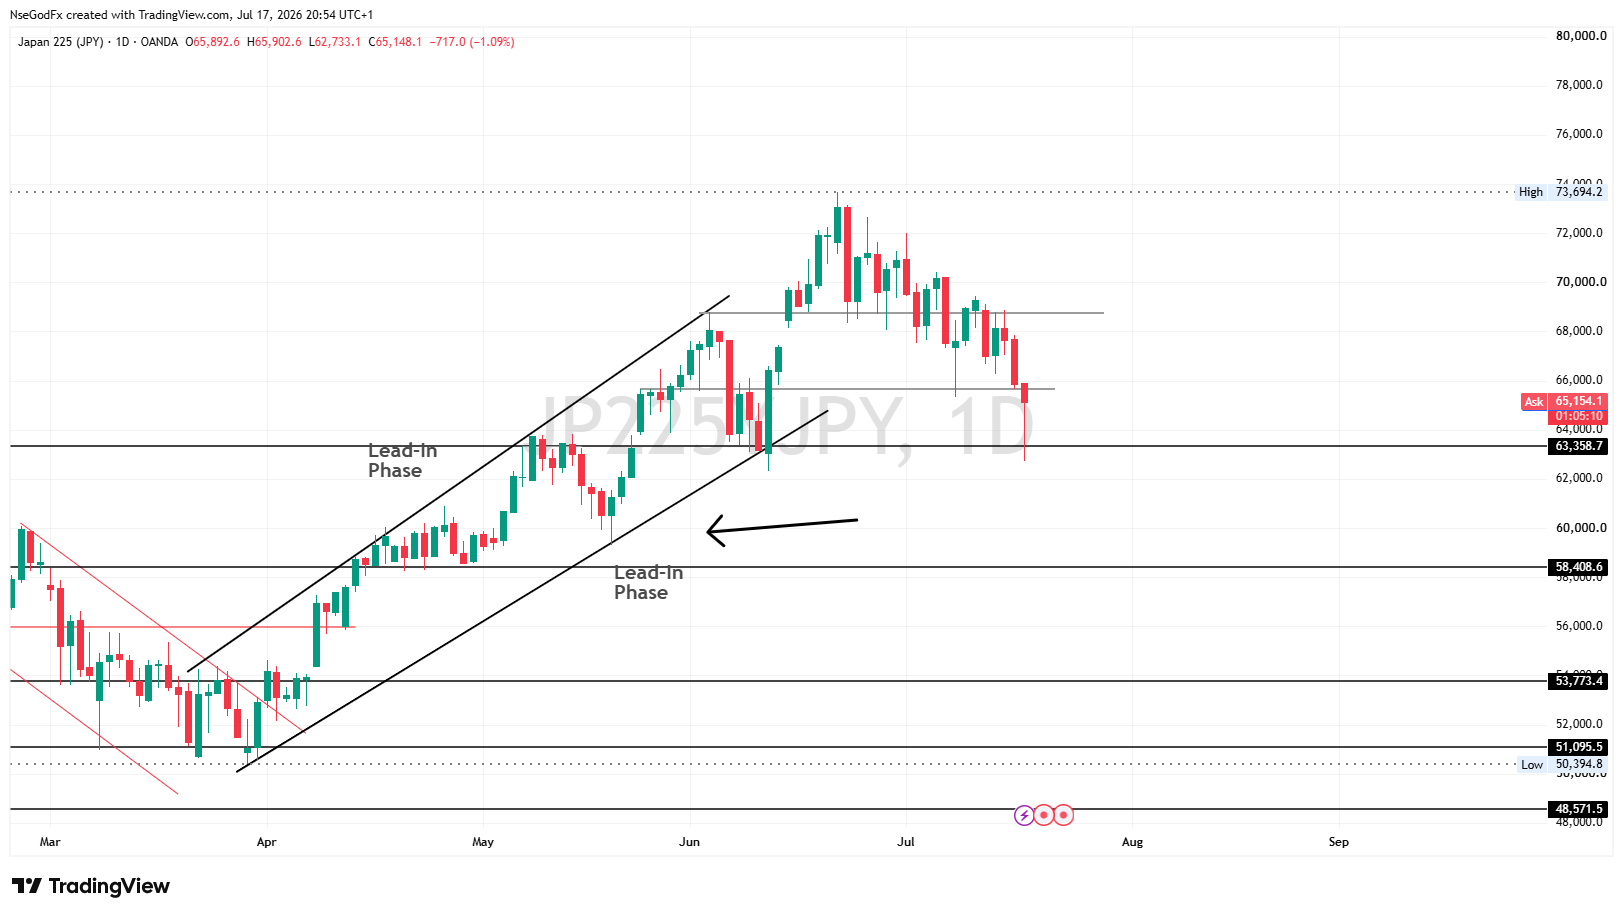
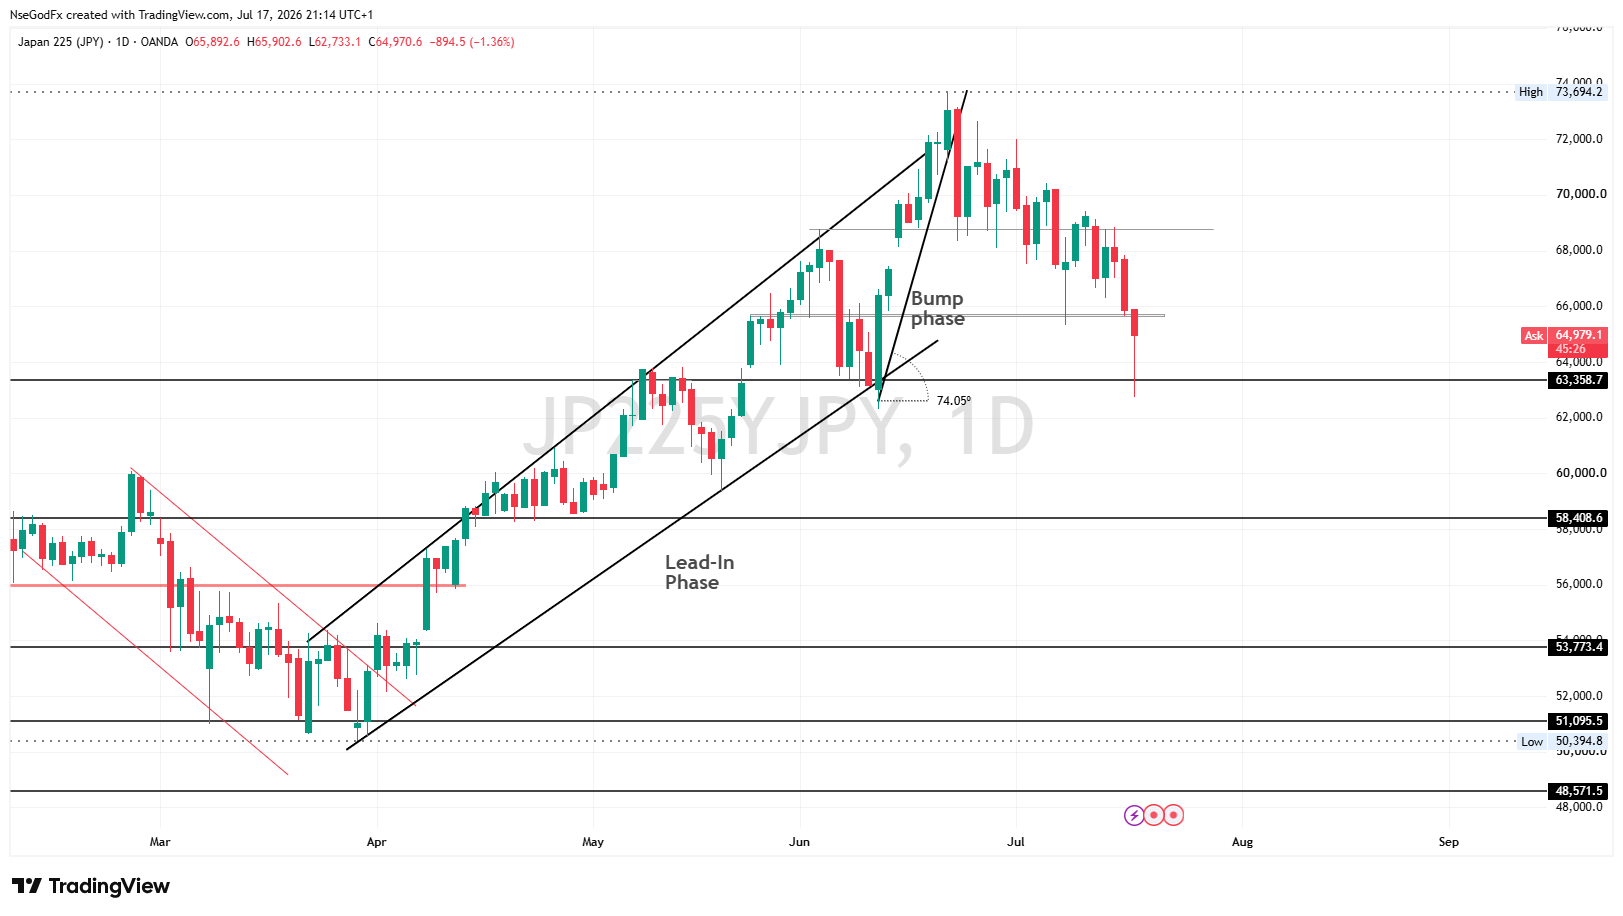
Phase 1- Lead-In: This is the first phase of the pattern. Price advances in a steady, and orderly uptrend(higher-highs, and higher lows) and institutions gradually accumulate positions
The initial trendline (shallower one) represents the lead-in phase.

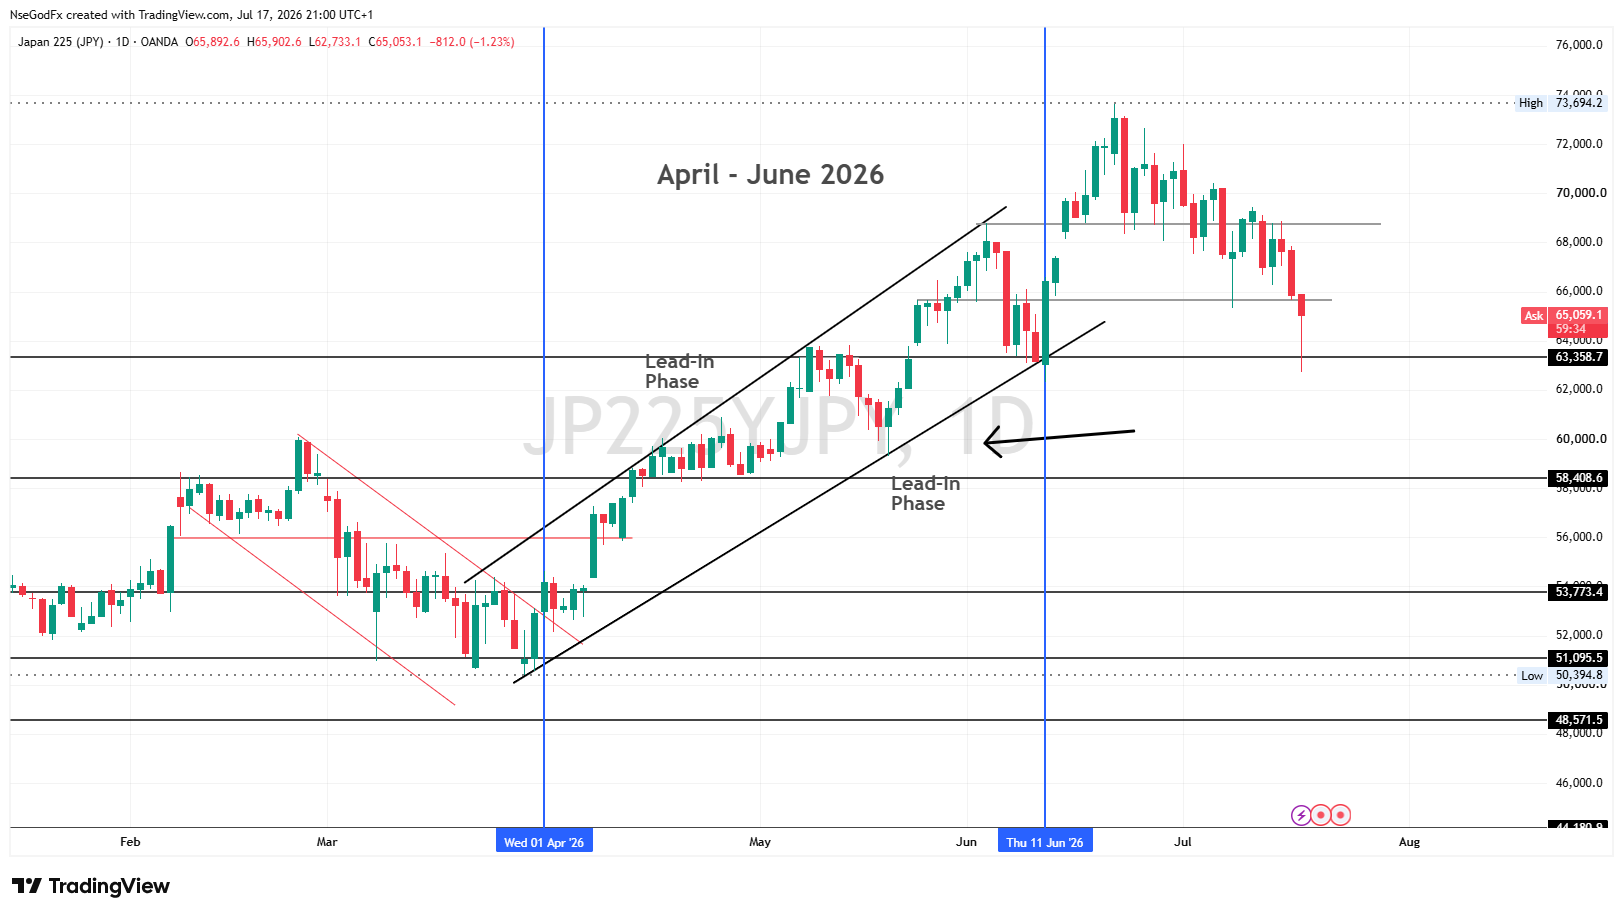
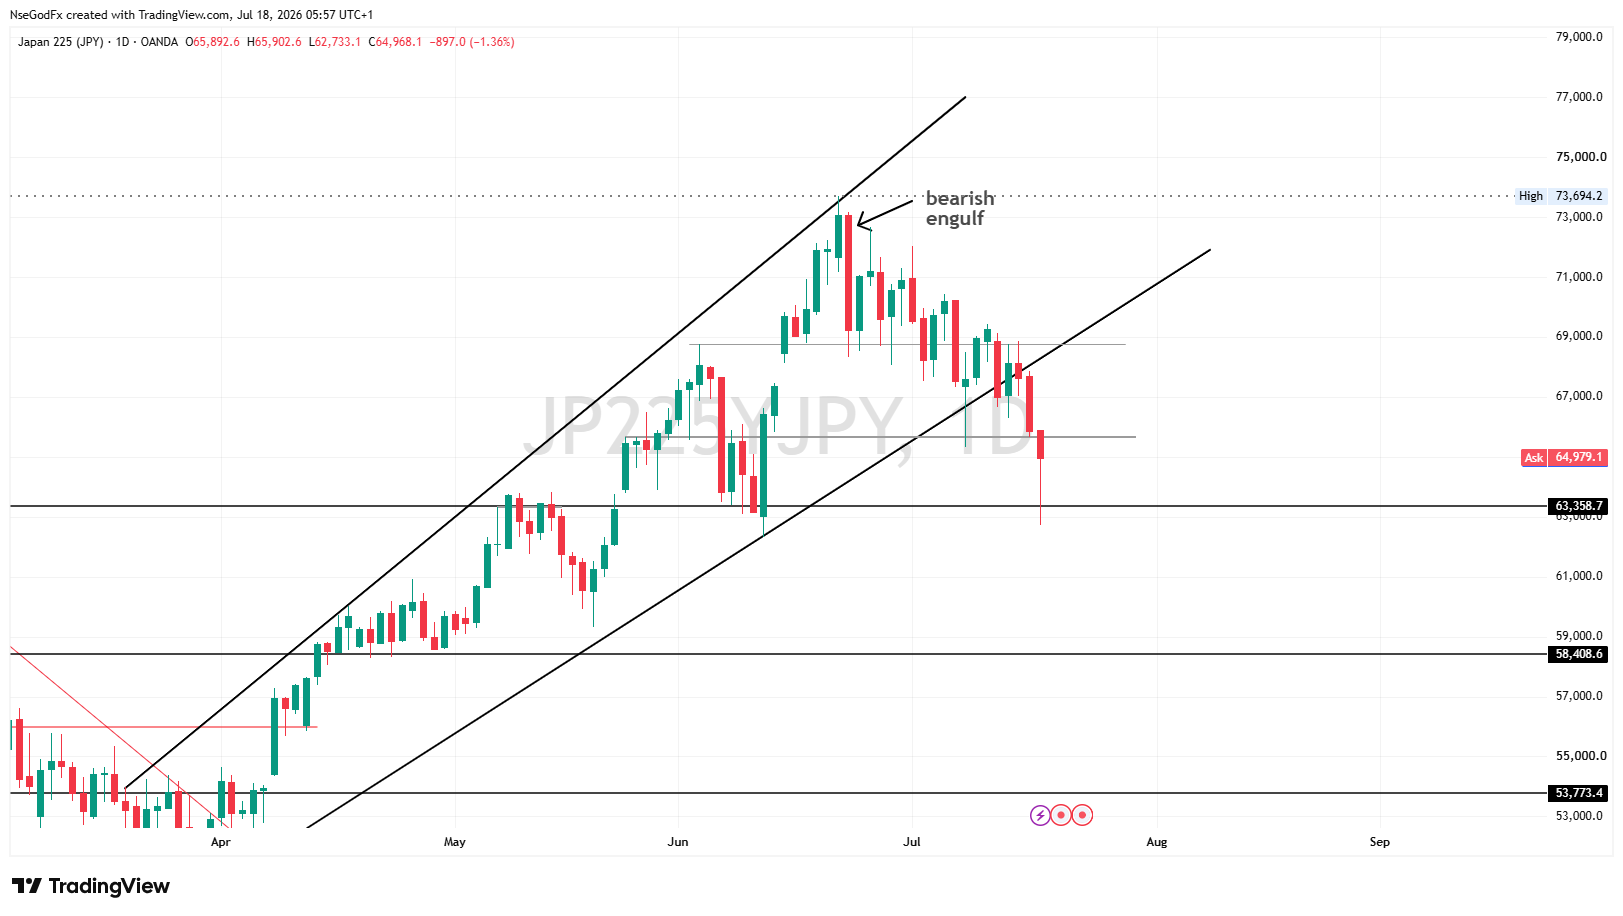
On the JP225 chart, we can see the steady progression of price in a healthy, organized and well-structured trend channel. signifying institutions where accumulating positions from the beginning of April till first week of June. This is the duration of the Lead-in phase.

N
@nsg_usd - 2 months ago
Quoted - nsg_usd

On the JP225 chart, we can see the steady progression of price in a healthy, organized and well-structured trend channel. signifying institutions where accumulating positions from the beginning of April till first week of June. This is the duration of the Lead-in phase.

Phase 2- The Bump

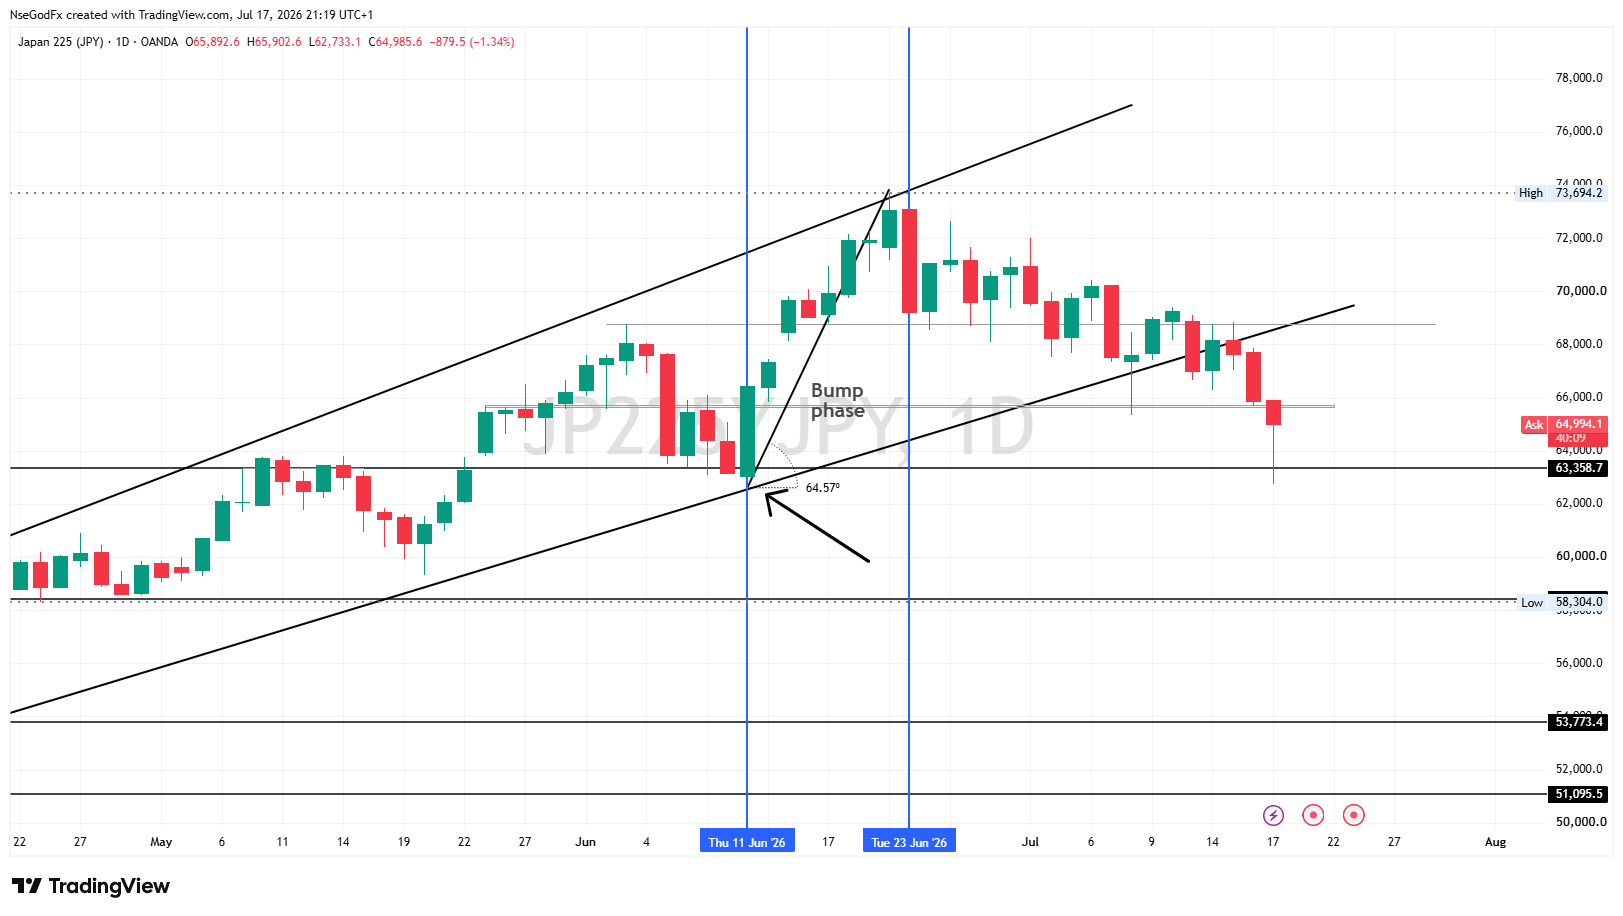
This is when price Accelerates above the lead-in trendline (upper boundaries) making a very steep advance. This is called the bump.

Here Momentum becomes Unsustainably strong, and we see a climatic buying pressure.

N
@nsg_usd - 2 months ago
Quoted - nsg_usd

Phase 2- The Bump

This is when price Accelerates above the lead-in trendline (upper boundaries) making a very steep advance. This is called the bump.

Here Momentum becomes Unsustainably strong, and we see a climatic buying pressure.

On the JP225 Charts, The Bump phase began and lasted the whole of June. Here we see the buying pressure accelerate dramatically, with strong bullish candles and a much steeper trend angle. This is when Institutions begin distributing into the buying and when retail traders always chase the move.

This phase often creates the illusion that the market will continue indefinitely higher, and traps late buyers.

N
@nsg_usd - 2 months ago
Quoted - nsg_usd

On the JP225 Charts, The Bump phase began and lasted the whole of June. Here we see the buying pressure accelerate dramatically, with strong bullish candles and a much steeper trend angle. This is when Institutions begin distributing into the buying and when retail traders always chase the move.

This phase often creates the illusion that the market will continue indefinitely higher, and traps late buyers.

Phase 3- The Run

(most important phase)

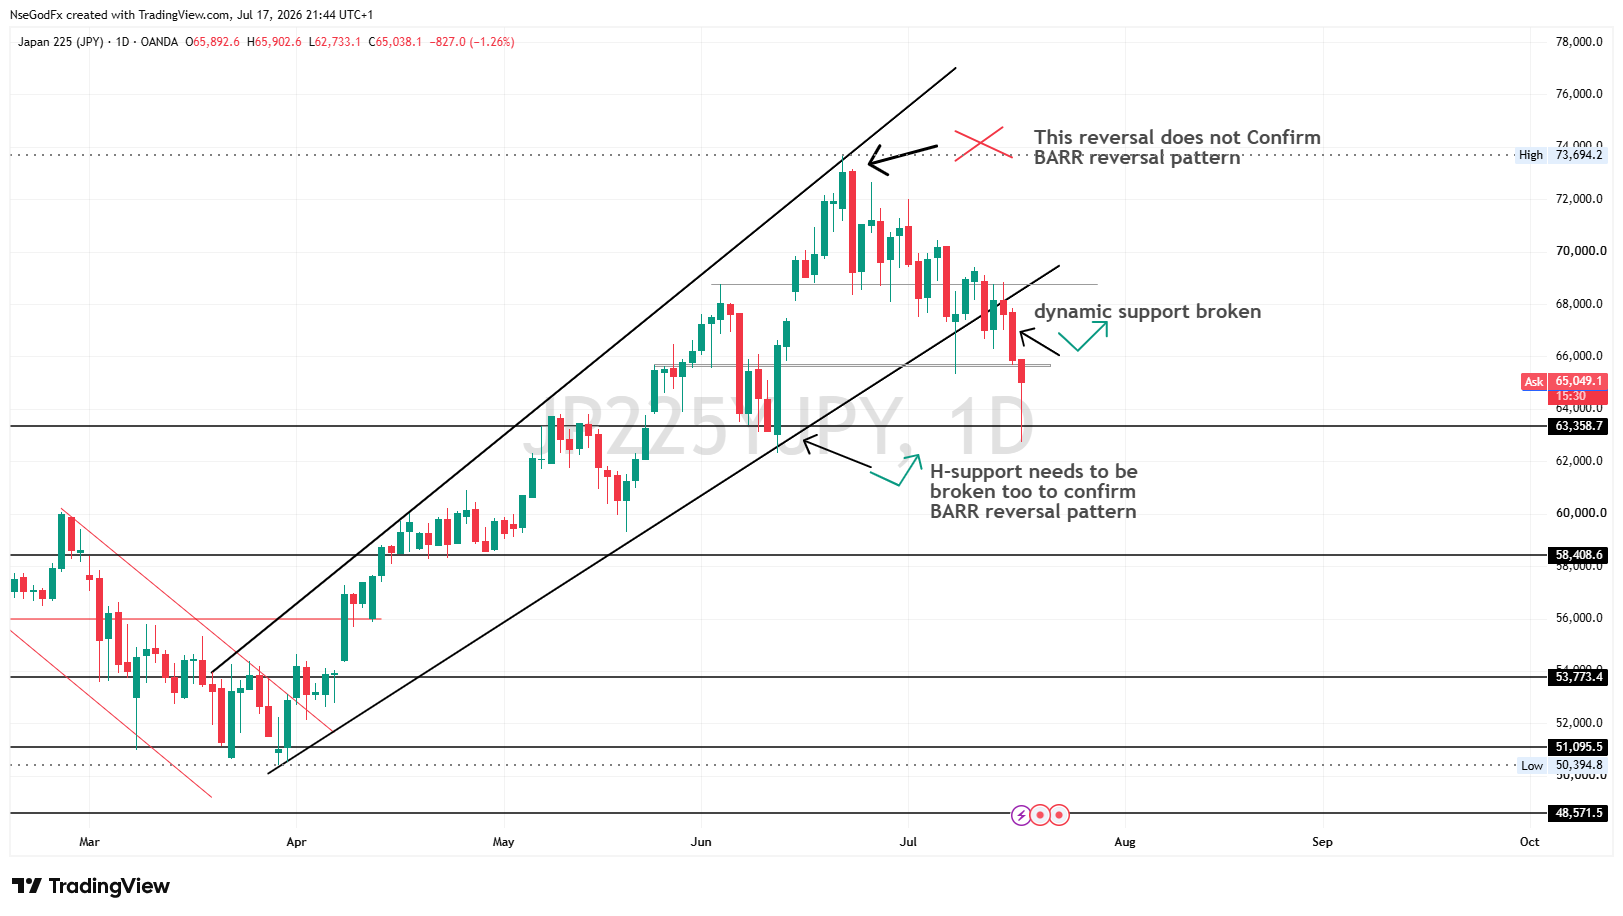
Here, the Reversal begins. Now, the reversal that confirms the BARR pattern, is not the one that begins after the Bump. While that reversal is forming, the pattern yet remains a potential and not a conclusion. i.e. you can't conclude a BARR pattern has been formed when price starts reversing after the Bump phase. Remember, the BARR pattern is a trend reversal pattern, and the first reversal can just be a pullback phase of the Bullish trend.

N
@nsg_usd - 2 months ago
Quoted - nsg_usd

Phase 3- The Run

(most important phase)

Here, the Reversal begins. Now, the reversal that confirms the BARR pattern, is not the one that begins after the Bump. While that reversal is forming, the pattern yet remains a potential and not a conclusion. i.e. you can't conclude a BARR pattern has been formed when price starts reversing after the Bump phase. Remember, the BARR pattern is a trend reversal pattern, and the first reversal can just be a pullback phase of the Bullish trend.

The reversal that confirms the pattern is when the bump trendline (dynamic support) is invalidated alongside the Bump Low (horizontal support). We need to see both the dynamic support and the Higher Low invalidated before we can conclude it is the BARR pattern. Without both Lows being broken, the BARR pattern has not completed.

In most cases, the Trendline (dynamic support) is often taken out, while price forms a second bottom at the bump Low especially if that Low was a rebound of a major Support that was a previous resistance.

N
@nsg_usd - 2 months ago

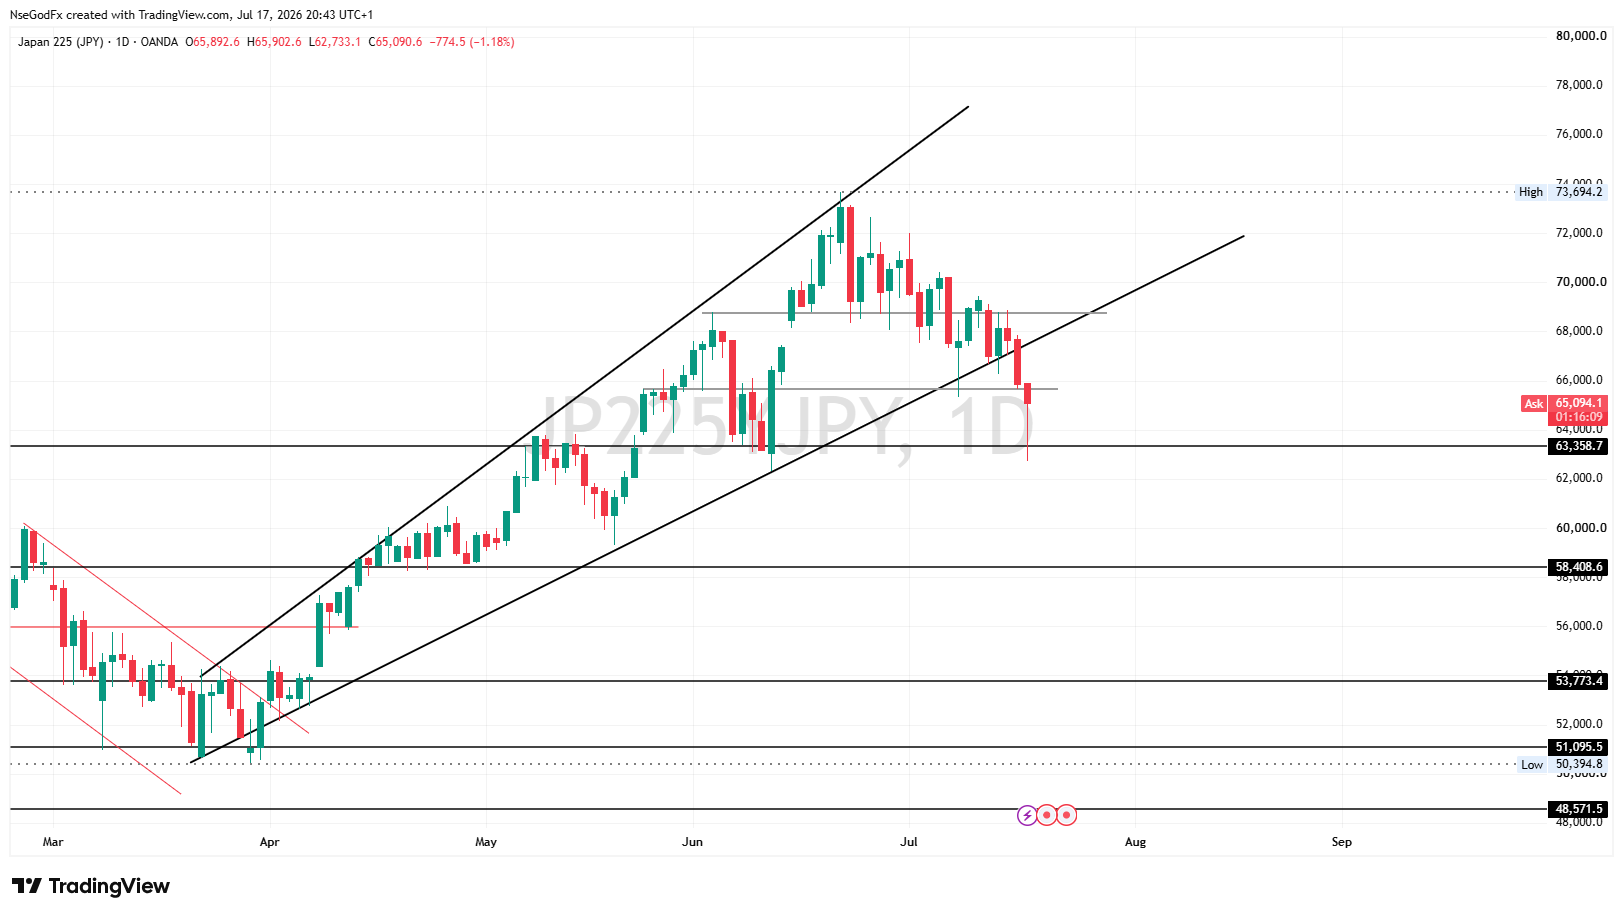
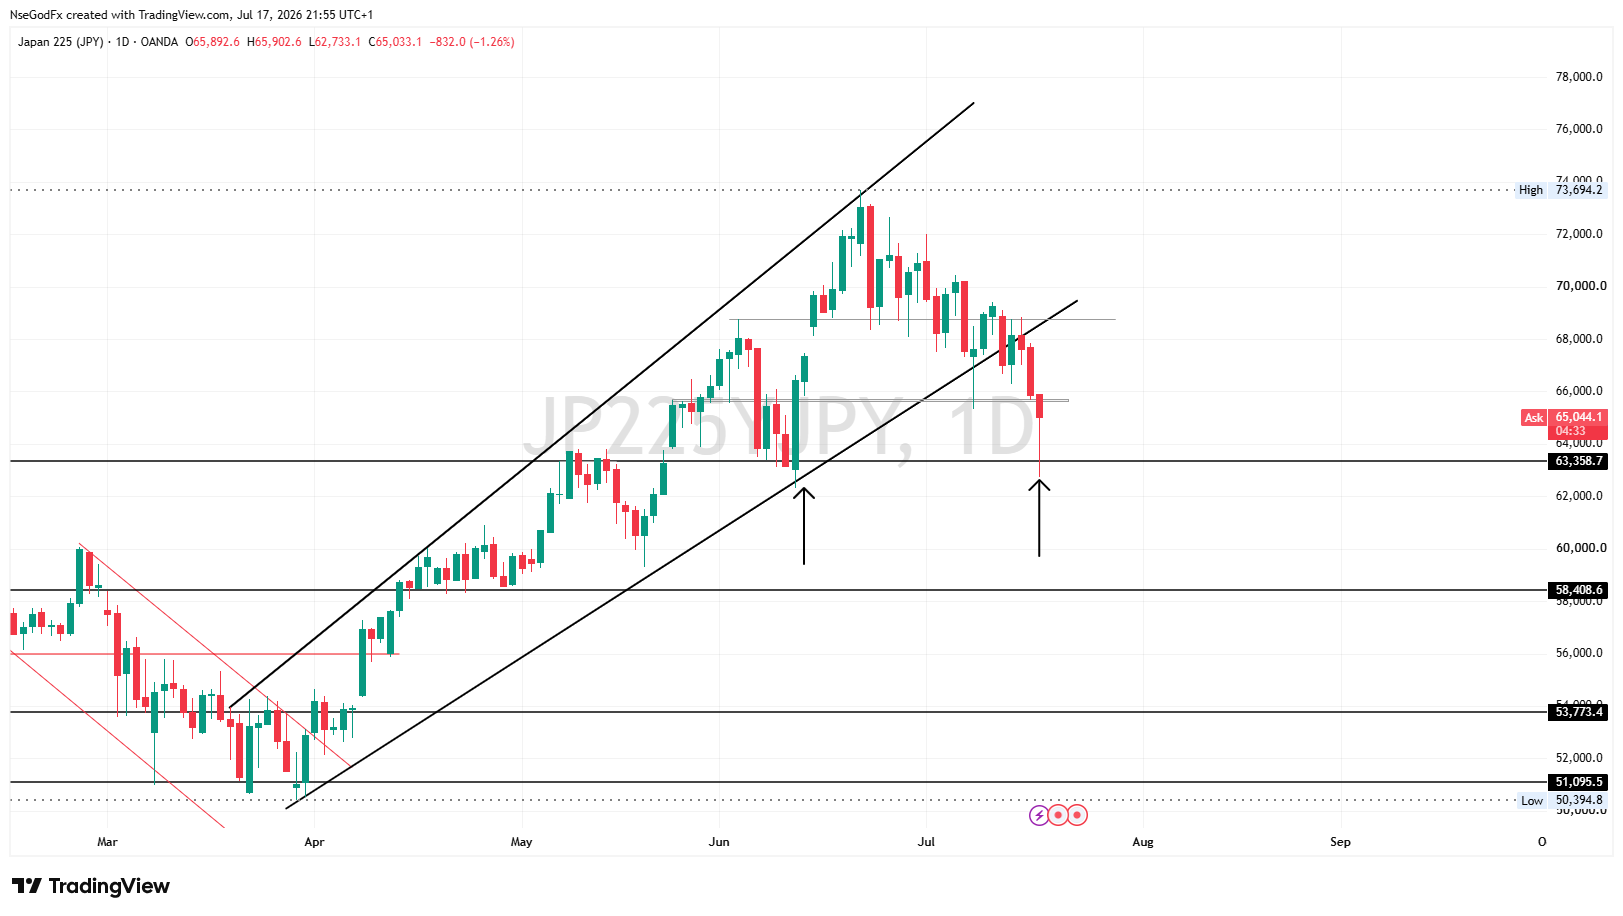
On the JP225 Charts, we can see the invalidation of the bump trendline (dynamic support) but not the Bump Low itself. But rather price rejected strongly at the key support level at 62733 price region which confluences with the lower boundary of the downward sloping channel that was supposed to be a pullback phase of the bullish trend.

N
@nsg_usd - 2 months ago
Quoted - nsg_usd

On the JP225 Charts, we can see the invalidation of the bump trendline (dynamic support) but not the Bump Low itself. But rather price rejected strongly at the key support level at 62733 price region which confluences with the lower boundary of the downward sloping channel that was supposed to be a pullback phase of the bullish trend.

How to trade the BARR pattern.

Personally, I trade the Potential BARR pattern, not the Confirmed BARR pattern. This is my trading style for any chart pattern I spot. I go for the potential version, not the confirmed version. Most Chart patterns textbooks and articles taught us how to trade the confirmed versions of chart patterns which means waiting for the pattern to fully form and then you trade the break and retest of the neckline, or the trendline etc. That version still works, but best suits scalpers and day traders as it often offers good short-range pips they can catch before the sharp reversals that often comes after the patterns are completed.

Although I'm a Dynamic Trader now, Primarily I'm a Swing Trader, trading confirmed versions often leaves me in a state of rush, instead of calm as I can be slow with making decisions because I love to have all my boxes checked carefully and well planned before execution. so, I can relax and watch market play out while having room to attend to other needs that are none-chart related.

So, I'll recommend my styIe of trade (not the textbook style), and will explain how it works.

N
@nsg_usd - 2 months ago
N
@nsg_usd - 2 months ago
Quoted - nsg_usd

How to trade the BARR pattern on JP225

First there are two types of BARR pattern namely;
a) The Bullish BARR Top
b) The Bearish BARR Bottom

The bullish BARR Top is a bearish reversal pattern while the Bearish BARR bottom is a bullish reversal bottom.

The type of BARR I illustrated in the JP225, is The Bullsh BARR Top.

To trade the Bullish BARR Top potential, wait for a Strong bearish drop to follow the last climax candle, forming a bearish Engulf. This often confluences with the upper boundaries of the trendline showing profit taking and sellers stepping in.

N
@nsg_usd - 2 months ago
Quoted - nsg_usd

To trade the Bullish BARR Top potential, wait for a Strong bearish drop to follow the last climax candle, forming a bearish Engulf. This often confluences with the upper boundaries of the trendline showing profit taking and sellers stepping in.

Most last series of climax candles always form with a long lower wick, showing that buyers used their last strength overpowering early sellers and try to break a key resistance level until the next candle that follows closes a strong bearish candle, that shows they failed to breakthrough and rather took profit after exhausting their last strength at the zone.

N
@nsg_usd - 2 months ago
Quoted - nsg_usd

Most last series of climax candles always form with a long lower wick, showing that buyers used their last strength overpowering early sellers and try to break a key resistance level until the next candle that follows closes a strong bearish candle, that shows they failed to breakthrough and rather took profit after exhausting their last strength at the zone.

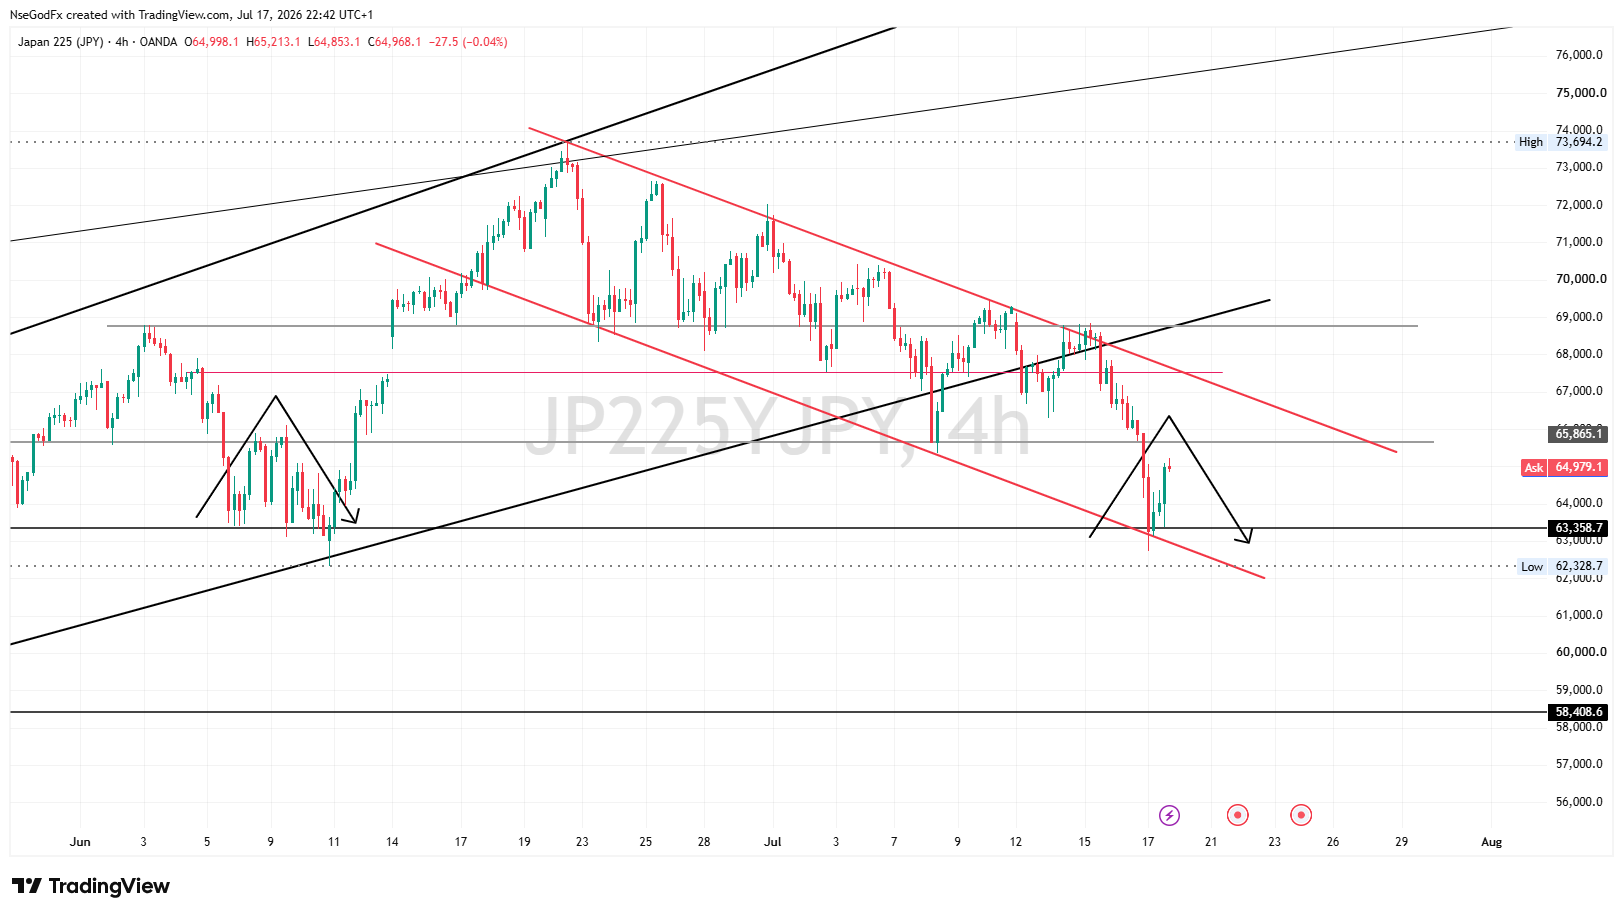
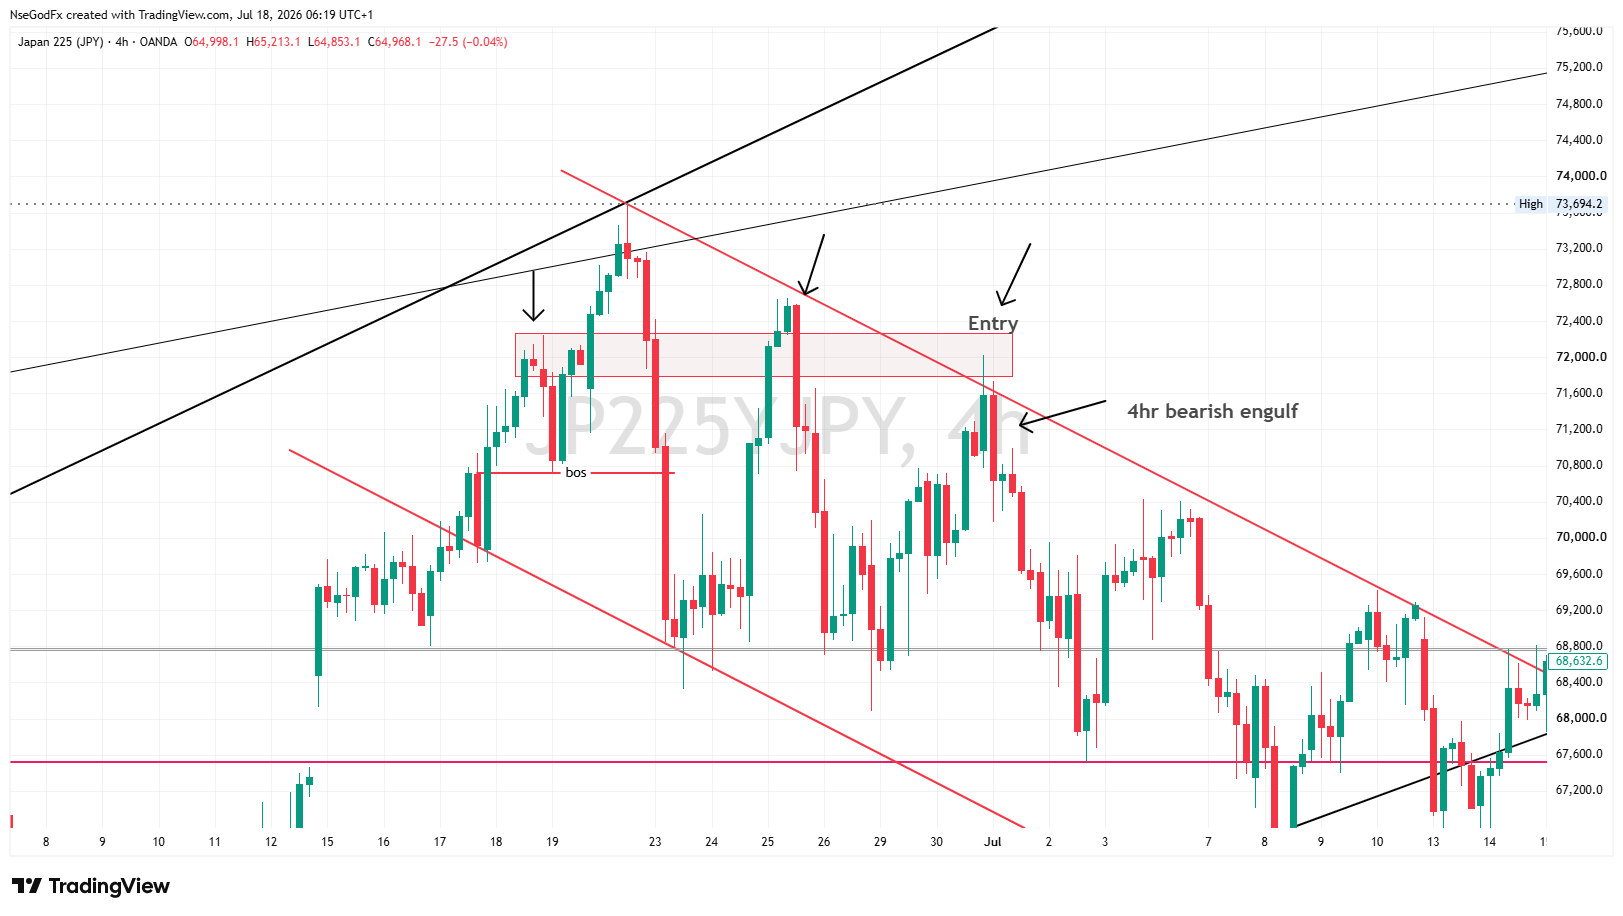
After spotting the Bearish Engulf (do this on highly timeframe D1, Wk), go down to your 4hr and wait for a structure shift, or for price to create a sub bearish pattern still at the resistance level. Those include, double tops, rising wedge, head and shoulders etc. or use the Smart money structure reversal technique like ChoCh, or SSL sweep, bearish Algo structure flow etc.

N
@nsg_usd - 2 months ago
Quoted - nsg_usd

After spotting the Bearish Engulf (do this on highly timeframe D1, Wk), go down to your 4hr and wait for a structure shift, or for price to create a sub bearish pattern still at the resistance level. Those include, double tops, rising wedge, head and shoulders etc. or use the Smart money structure reversal technique like ChoCh, or SSL sweep, bearish Algo structure flow etc.

In this Case, I spotted a bearish trendline formation formed (two touches made) with a LTF structure shift and minor resistance level confluence with the trendline touches. that would have been my entry clue. Execution would follow after the 4hr bearish engulf, with SL above the minor resistance level. My Tp will be the Bump trendline dynamic D-support or Horizontal H-support .

« Previous 1 2 3 4 5

Disclaimer:

At MyTradingLand.com, we connect you with forex brokers and provide a community for traders. While we offer valuable information and resources, please note that we are not financial advisors and cannot provide personalized financial advice. Always conduct your own research and invest responsibly.

Community Guidelines: The MyTradingLand.com community is designed as a resource for forex traders, promoting respectful and constructive discussions. We reserve the right to remove any content that is misleading, abusive, or violates our terms of service.

Broker Information: While we may receive commissions or advertising income from some of the brokers listed, this does not imply an endorsement of any broker, nor does it affect our review process. Our evaluations are based solely on objective criteria and user feedback.

Always verify the regulatory status of any broker with your local financial authority, along with their terms and privacy policies, before engaging with them. It is crucial to conduct thorough research to ensure that you are making informed decisions.

Risk Warning: At MyTradingLand.com, we strive to provide accurate information; however, the forex market is highly volatile and can change rapidly. It is essential to verify any information before making investment decisions.

Please be aware that trading in forex involves substantial risk, and it is possible to lose more than your trading equity/investment capital. 70-90% of retail CFD traders incur losses in their trading activities as per information from various brokers.

You are solely responsible for your use of MyTradingLand.com and any trading decisions you make. We encourage all users to educate themselves thoroughly about forex trading and to consider seeking advice from qualified financial professionals.

Advertising Disclosure: We may earn commissions from recommended brokers, but our reviews are independent (not influenced by potential earnings). Sponsored content is clearly marked and doesn't reflect our views.

©2026 ©2025 All rights reserved Mytradingland.com