HOW TO TRADE INDICES

N
@nsg_usd - 1 week ago
Quoted - nsg_usd

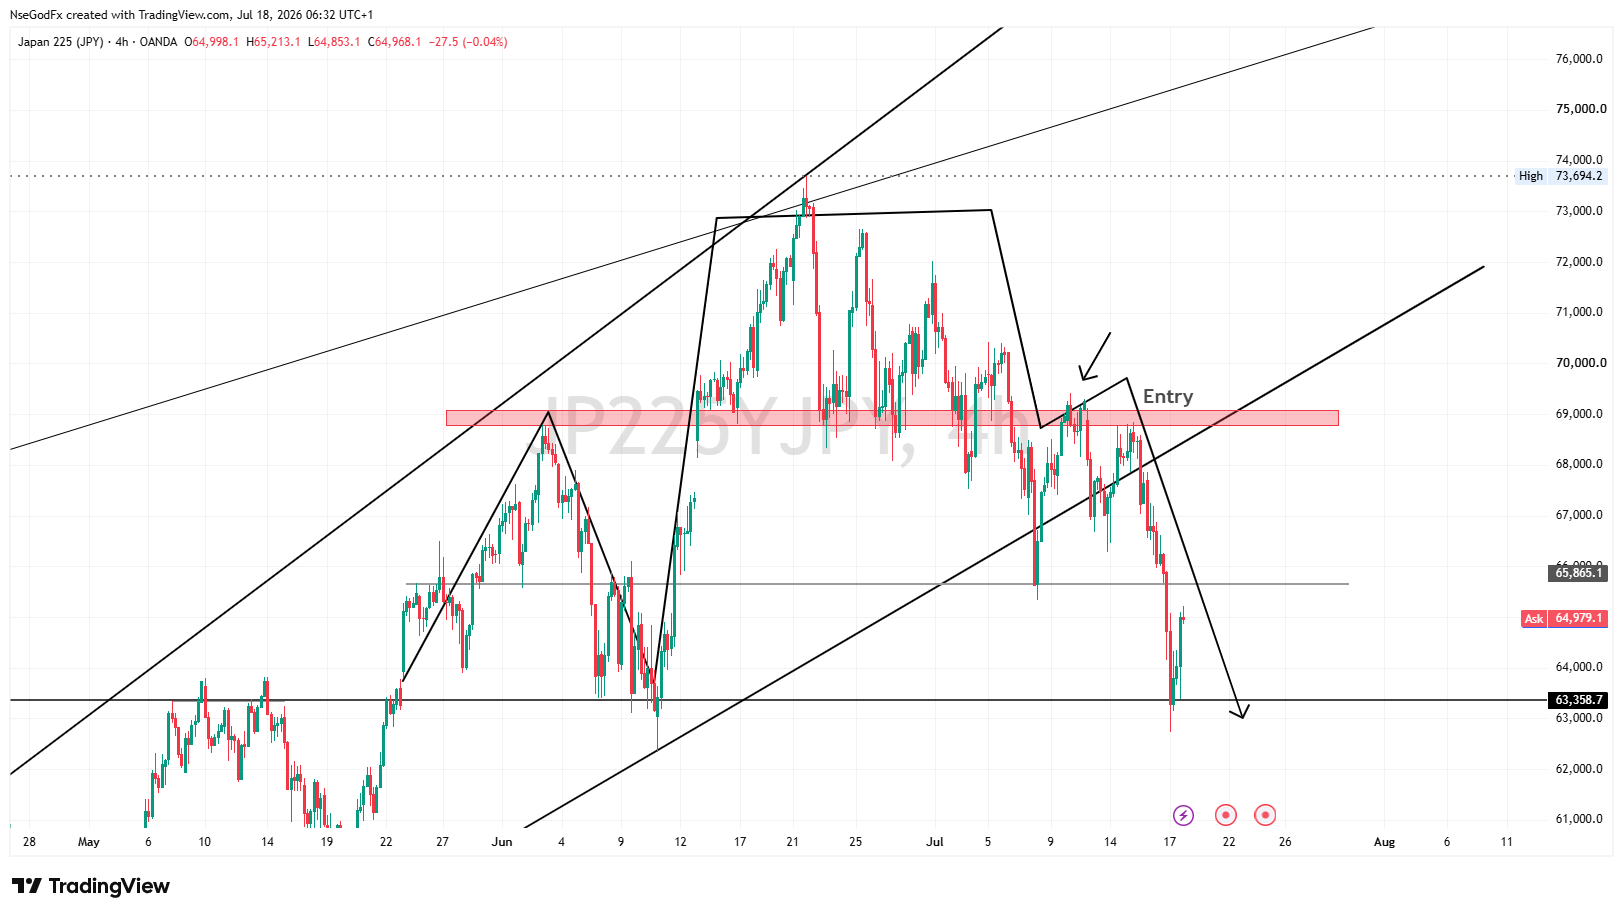
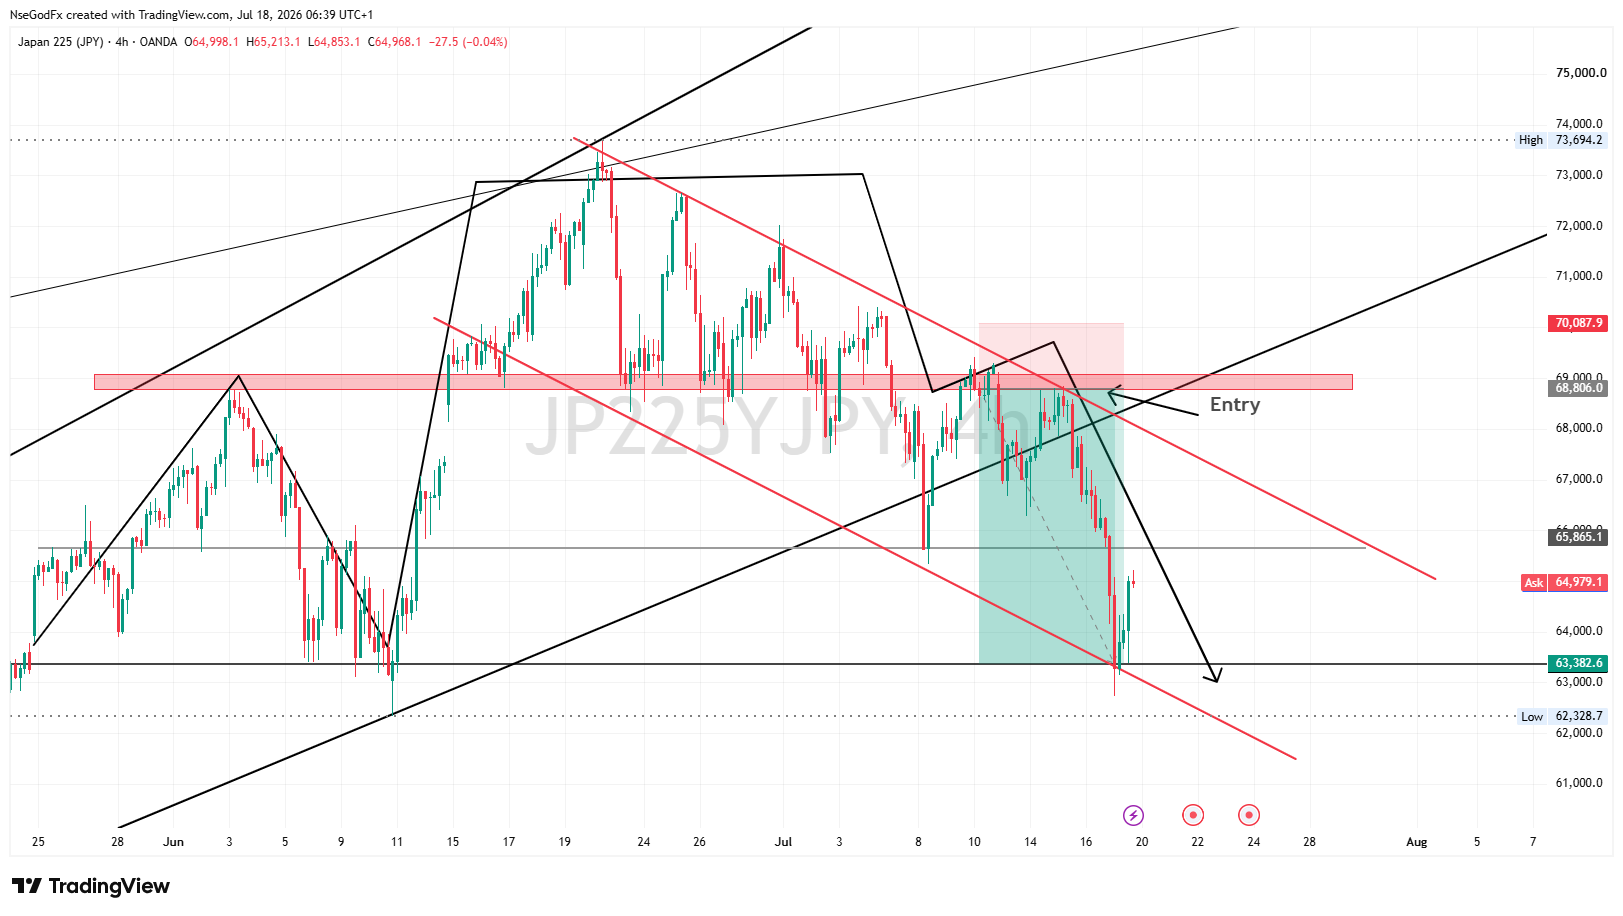
In this Case, I spotted a bearish trendline formation formed (two touches made) with a LTF structure shift and minor resistance level confluence with the trendline touches. that would have been my entry clue. Execution would follow after the 4hr bearish engulf, with SL above the minor resistance level. My Tp will be the Bump trendline dynamic D-support or Horizontal H-support .

The First entry is the early entry and most times I'll keep my expectations short term, targeting the immediate zone price broke out from Rather than the bump Low.

The Second entry is the Confidence entry for me. I'll wait for the sharp bearish drop on the daily to break below a support that it invalidated as a resistance, creating the classical Head and Shoulders pattern entry which is a high probability entry for me.

This Confidence entry usually has a lot of technical confluences checked before execution such as Trendline touch + right shoulder + counter trendline retest + candlesticks pattern + fibonacci level etc. My TP will be the Bump Low.

This often gives a 1:4 RRR.

A
@asuquokelvin - 1 week ago
Quoted - nsg_usd

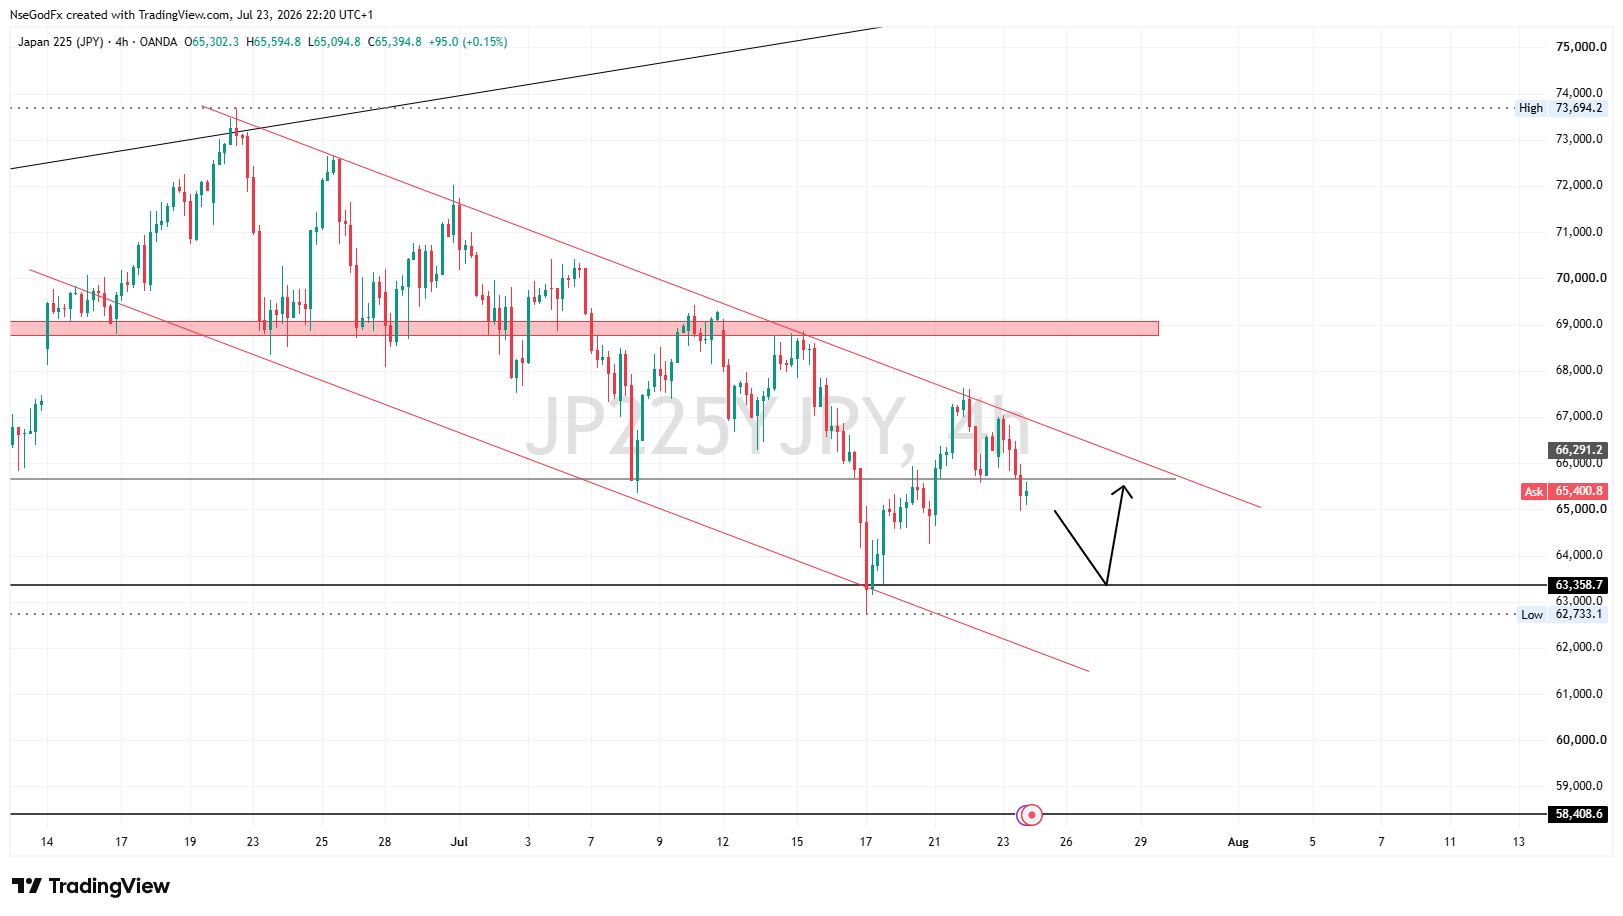
On the JP225 Charts, we can see the invalidation of the bump trendline (dynamic support) but not the Bump Low itself. But rather price rejected strongly at the key support level at 62733 price region which confluences with the lower boundary of the downward sloping channel that was supposed to be a pullback phase of the bullish trend.

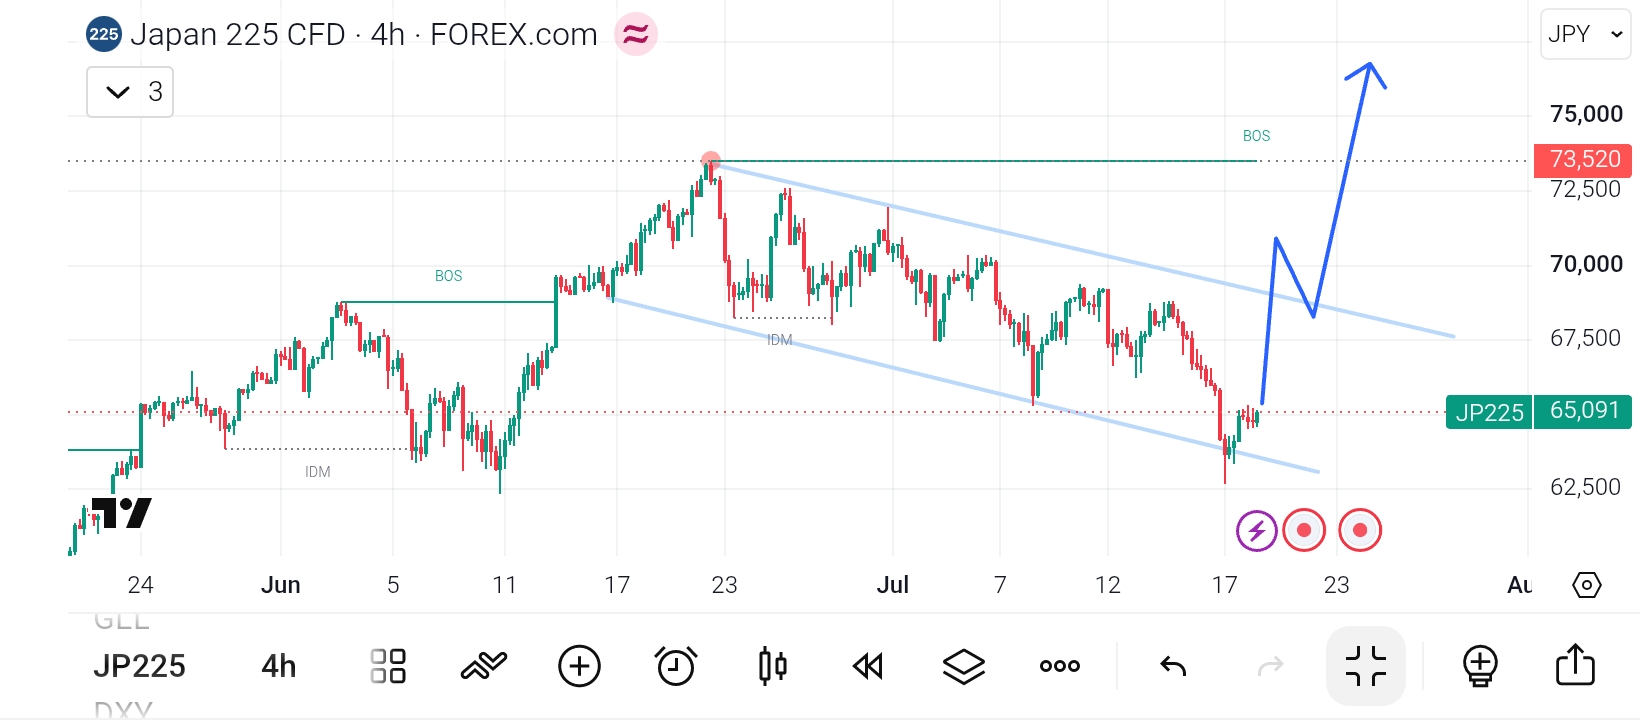
That rejection is significant because it shows buyers defended the horizontal support even after the dynamic trendline failed. For me, the next confirmation would be a break above the pullback channel with strong bullish displacement. If that happens, it increases the probability that the correction has ended and the higher-timeframe bullish trend is resuming rather than transitioning into a deeper reversal.

G
@godspowerdan - 1 week ago
Quoted - nsg_usd

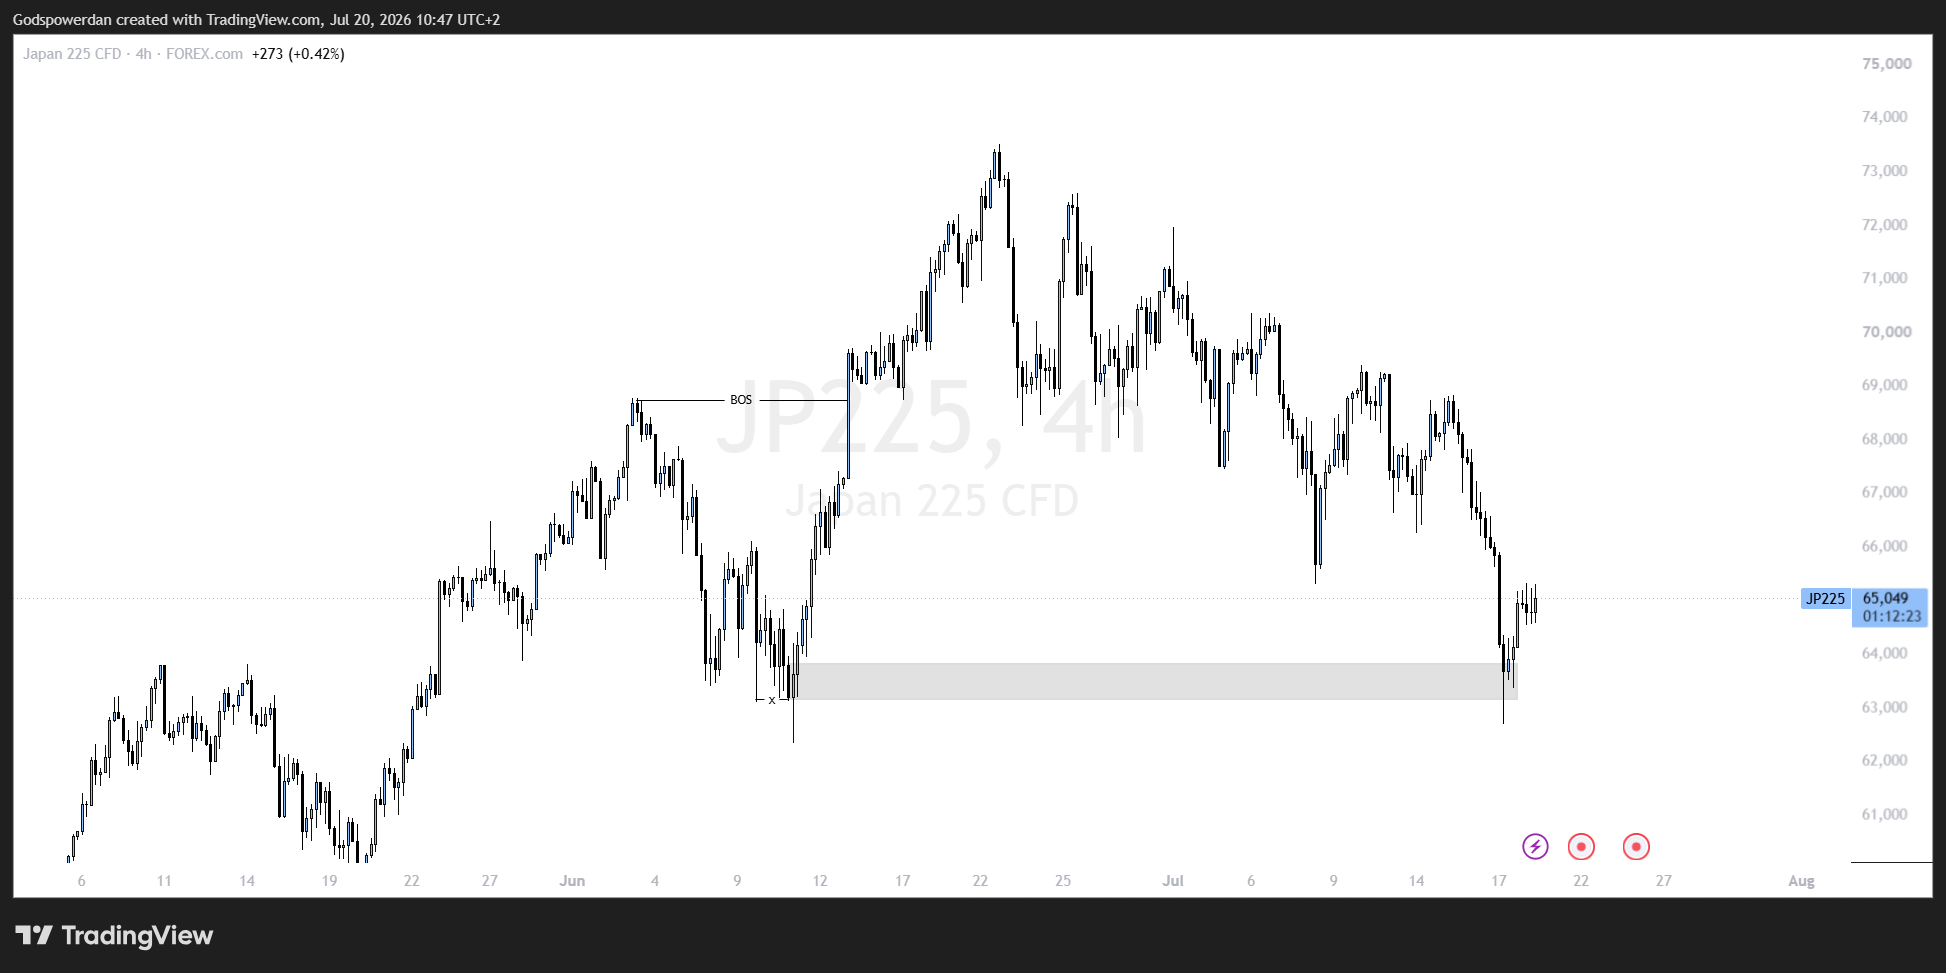
On the JP225 Charts, The Bump phase began and lasted the whole of June. Here we see the buying pressure accelerate dramatically, with strong bullish candles and a much steeper trend angle. This is when Institutions begin distributing into the buying and when retail traders always chase the move.

This phase often creates the illusion that the market will continue indefinitely higher, and traps late buyers.

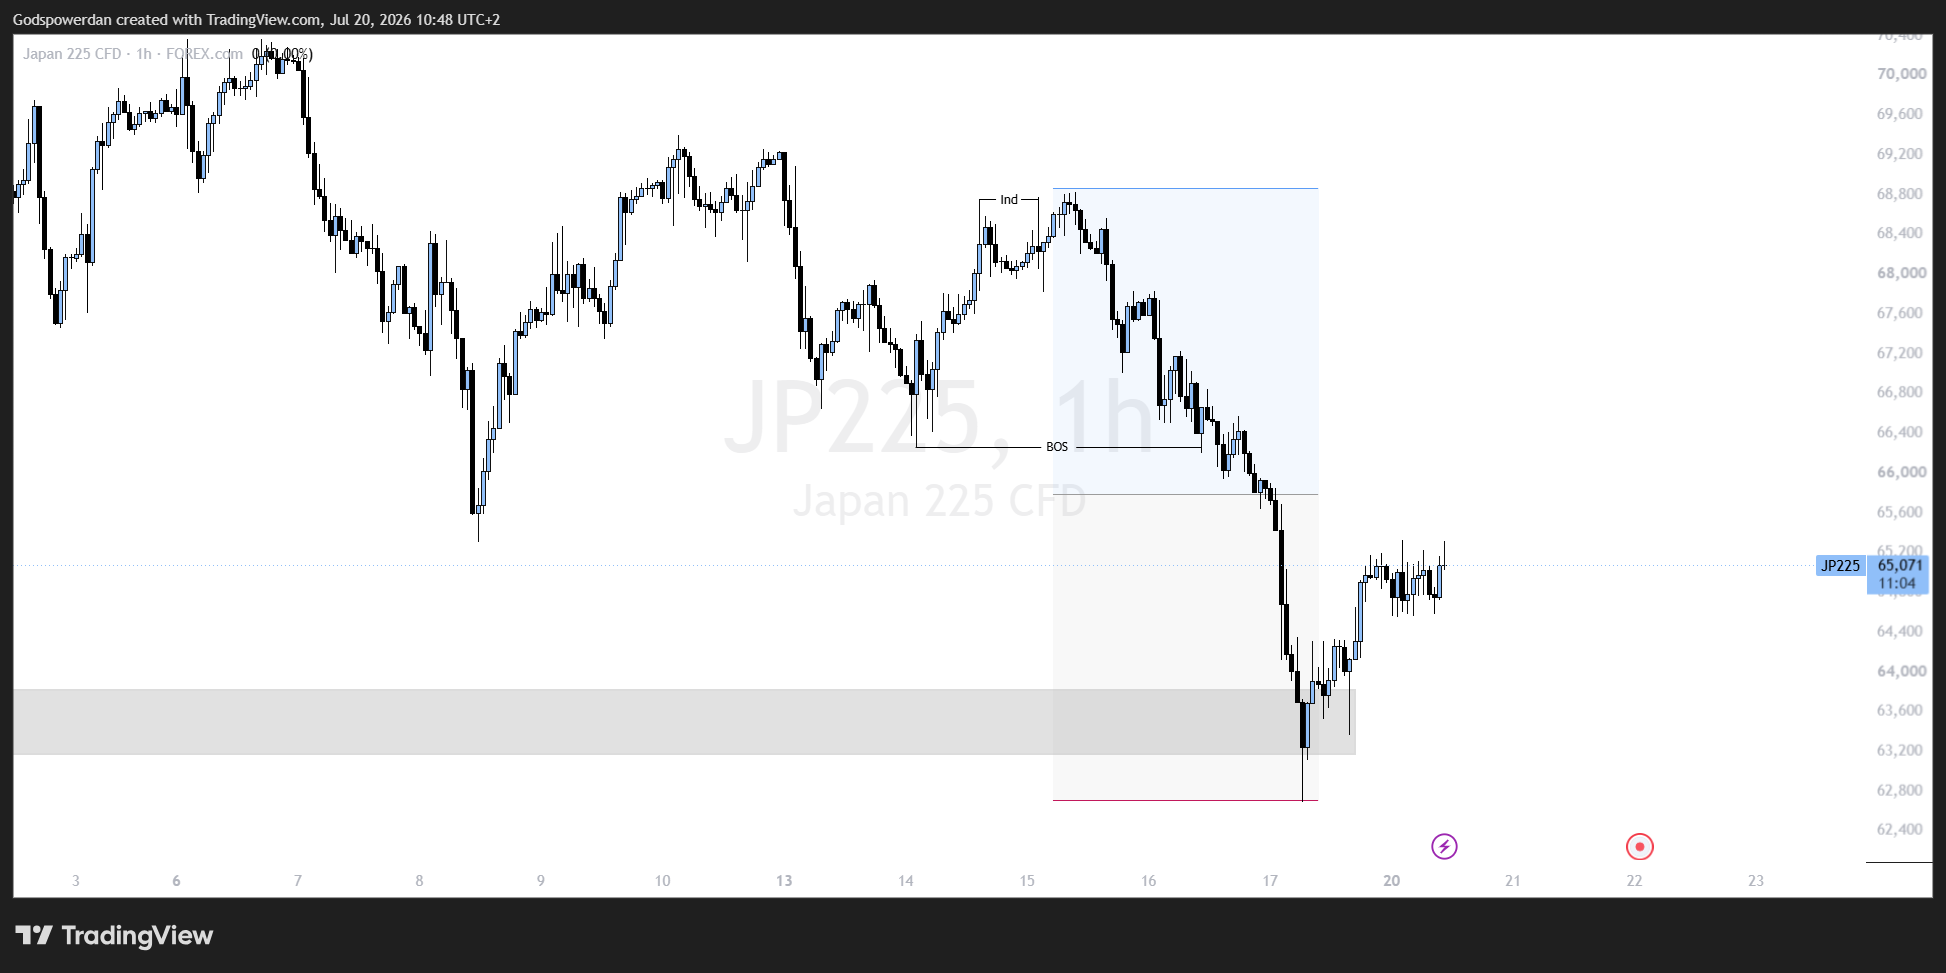
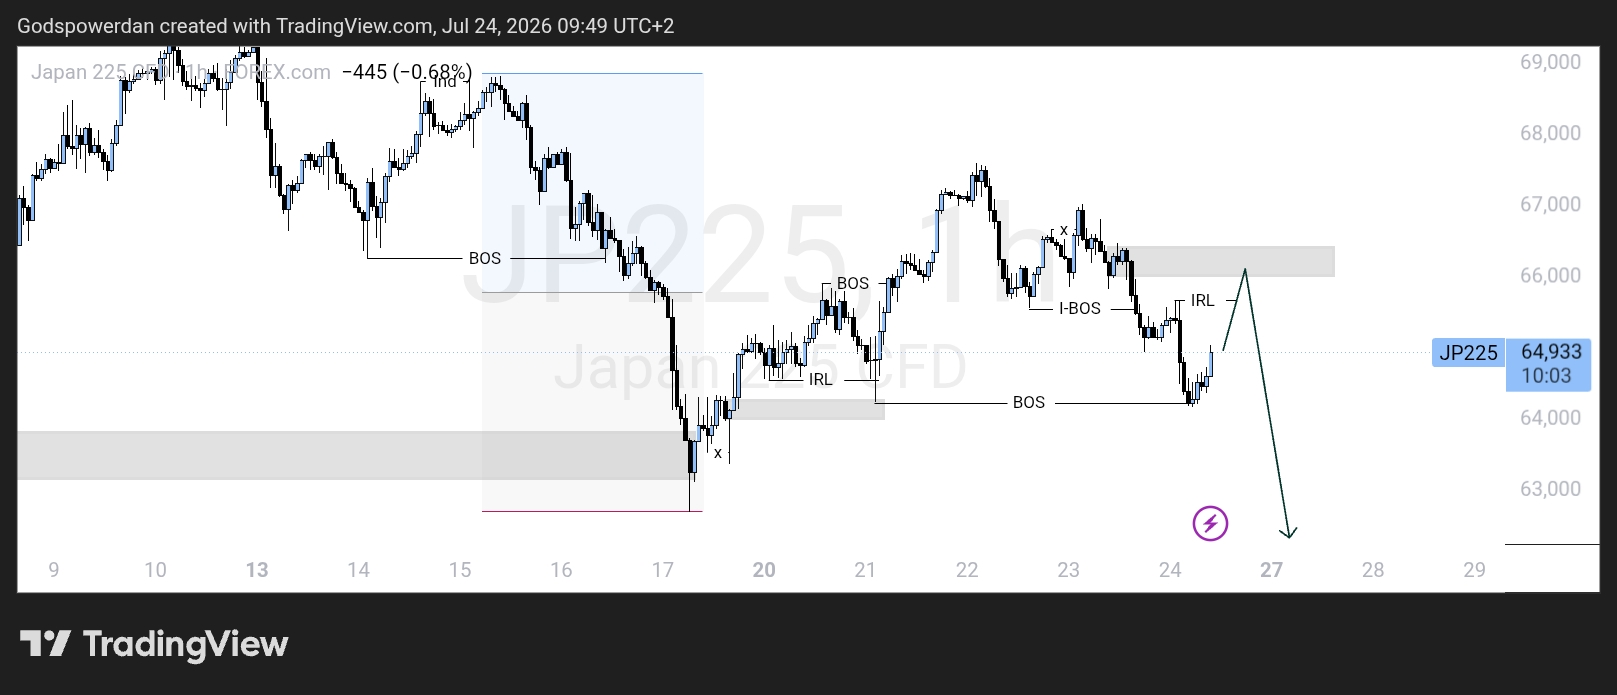
First of all on the 4h timeframe price didn't break or sweep below that, but that is due to differences in broker.

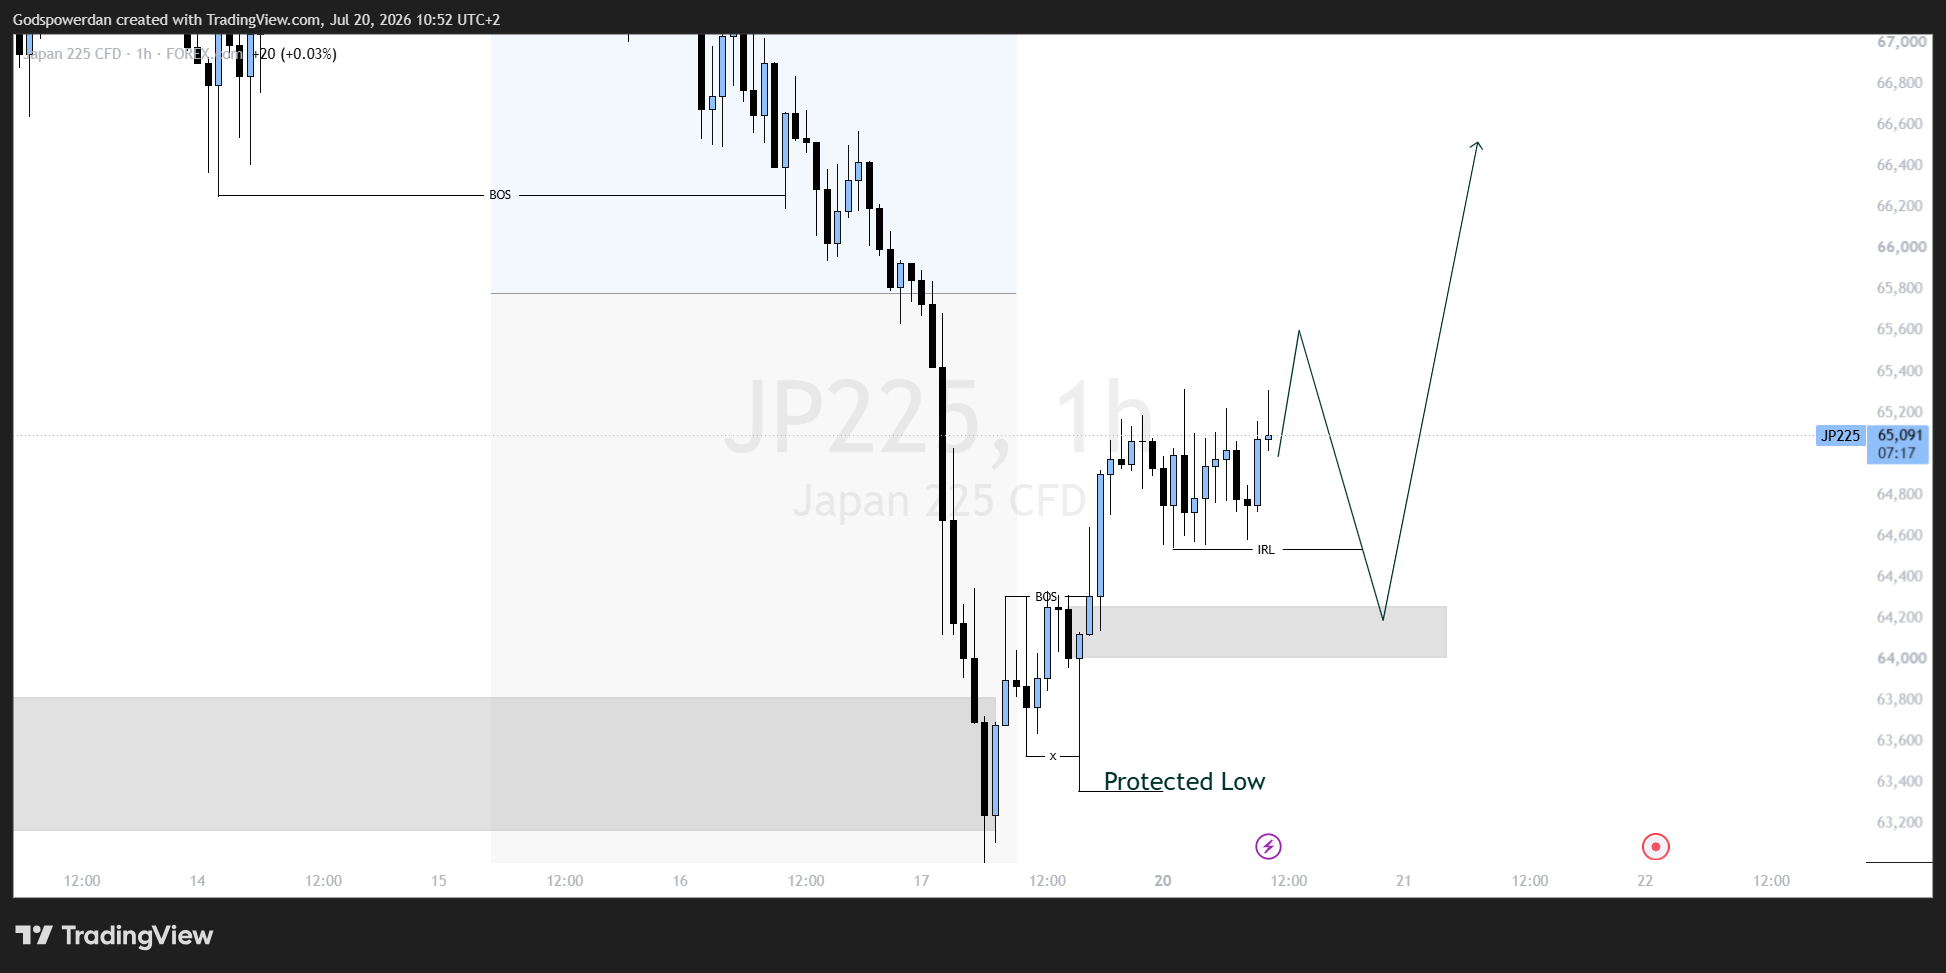
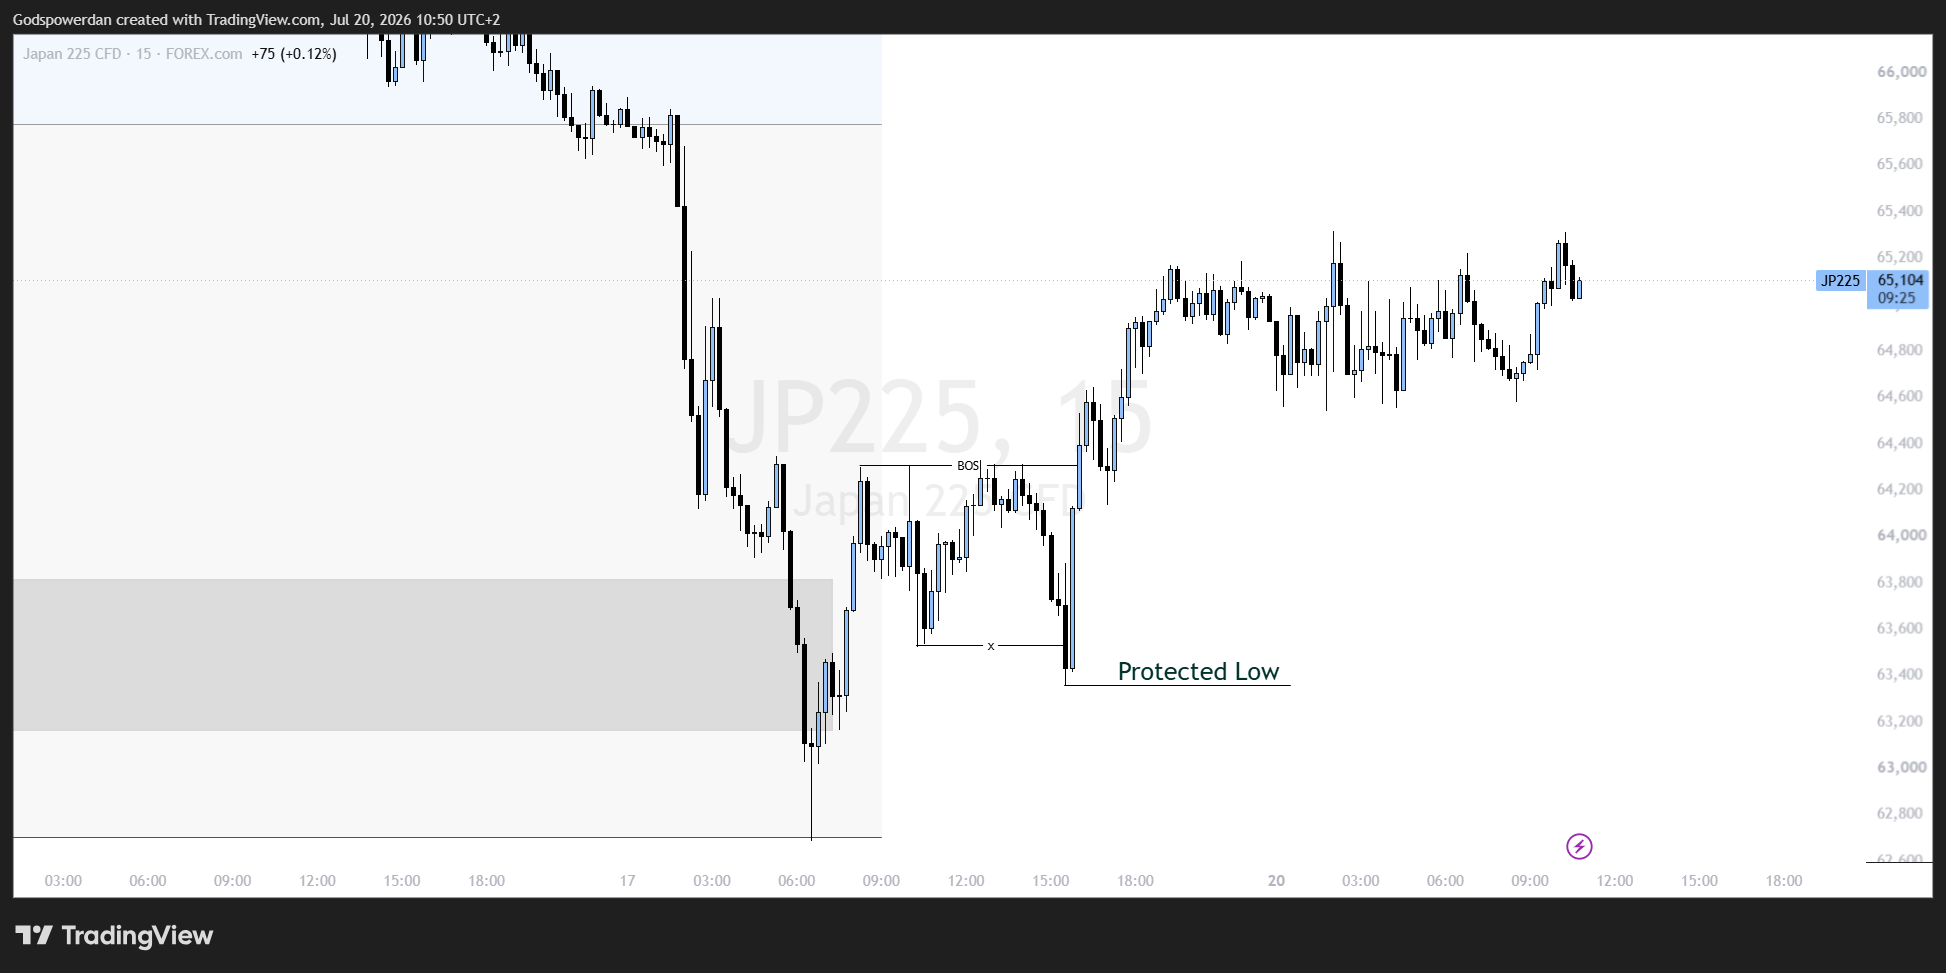
Price reacted from an orderblock in the 4h timeframe, then going down to the 15 mins we see that price has protected a low, so if price intends to start the buys from there, it should trade a little bit higher then retrace to that orderblock marked out on the 1h and putting your stops below the protected low

N
@nsg_usd - 6 days ago
Quoted - asuquokelvin

That rejection is significant because it shows buyers defended the horizontal support even after the dynamic trendline failed. For me, the next confirmation would be a break above the pullback channel with strong bullish displacement. If that happens, it increases the probability that the correction has ended and the higher-timeframe bullish trend is resuming rather than transitioning into a deeper reversal.

JP225- Trade Update
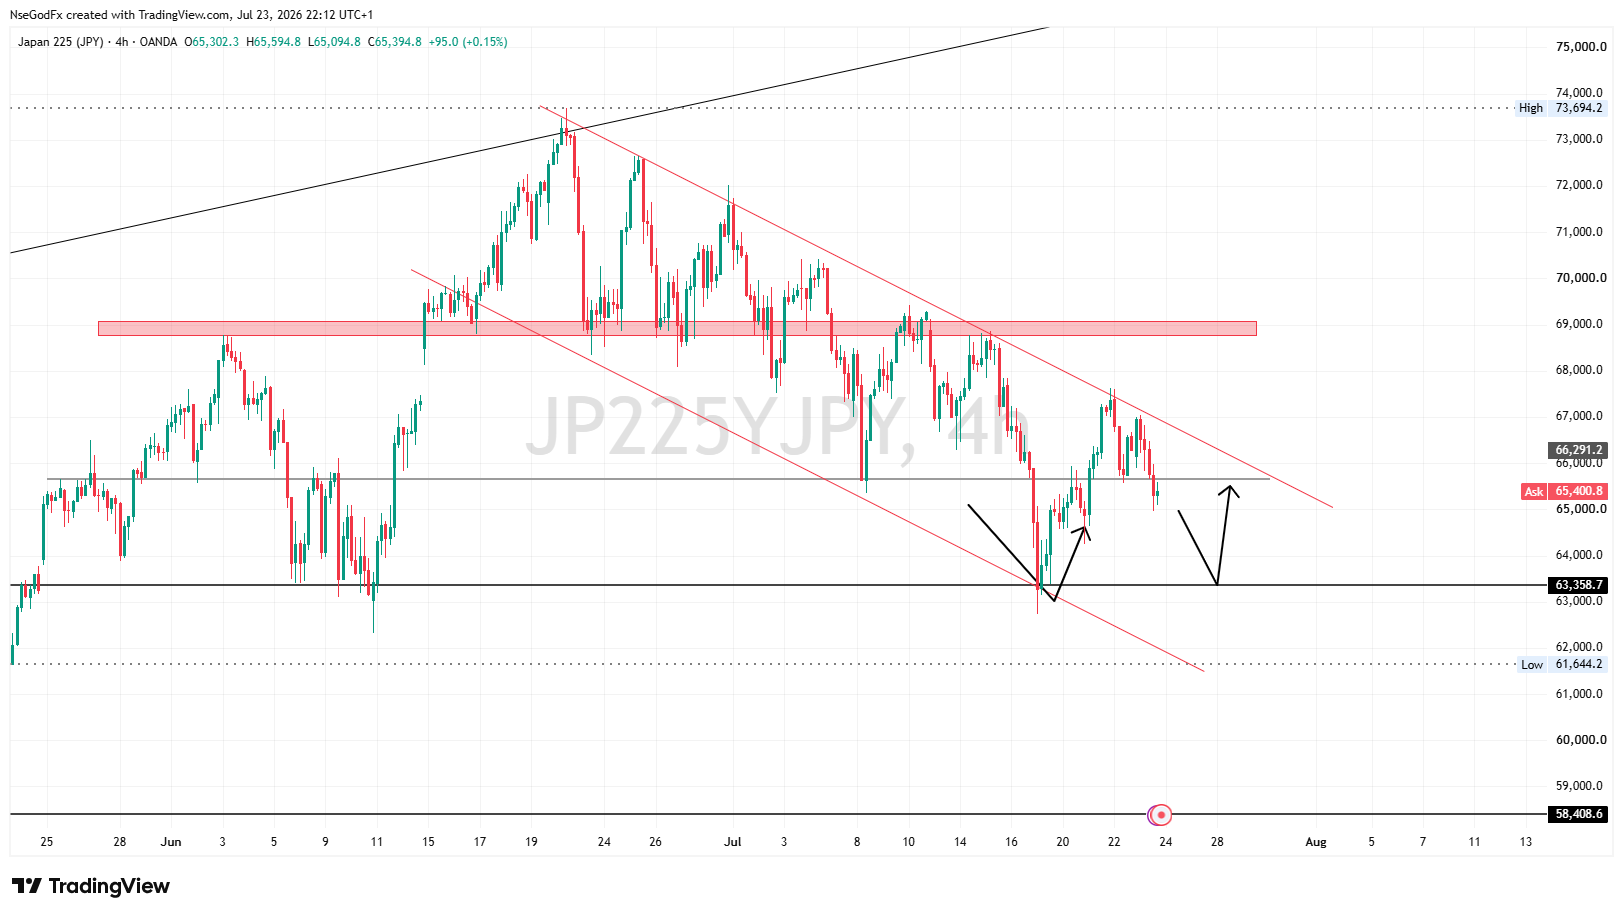
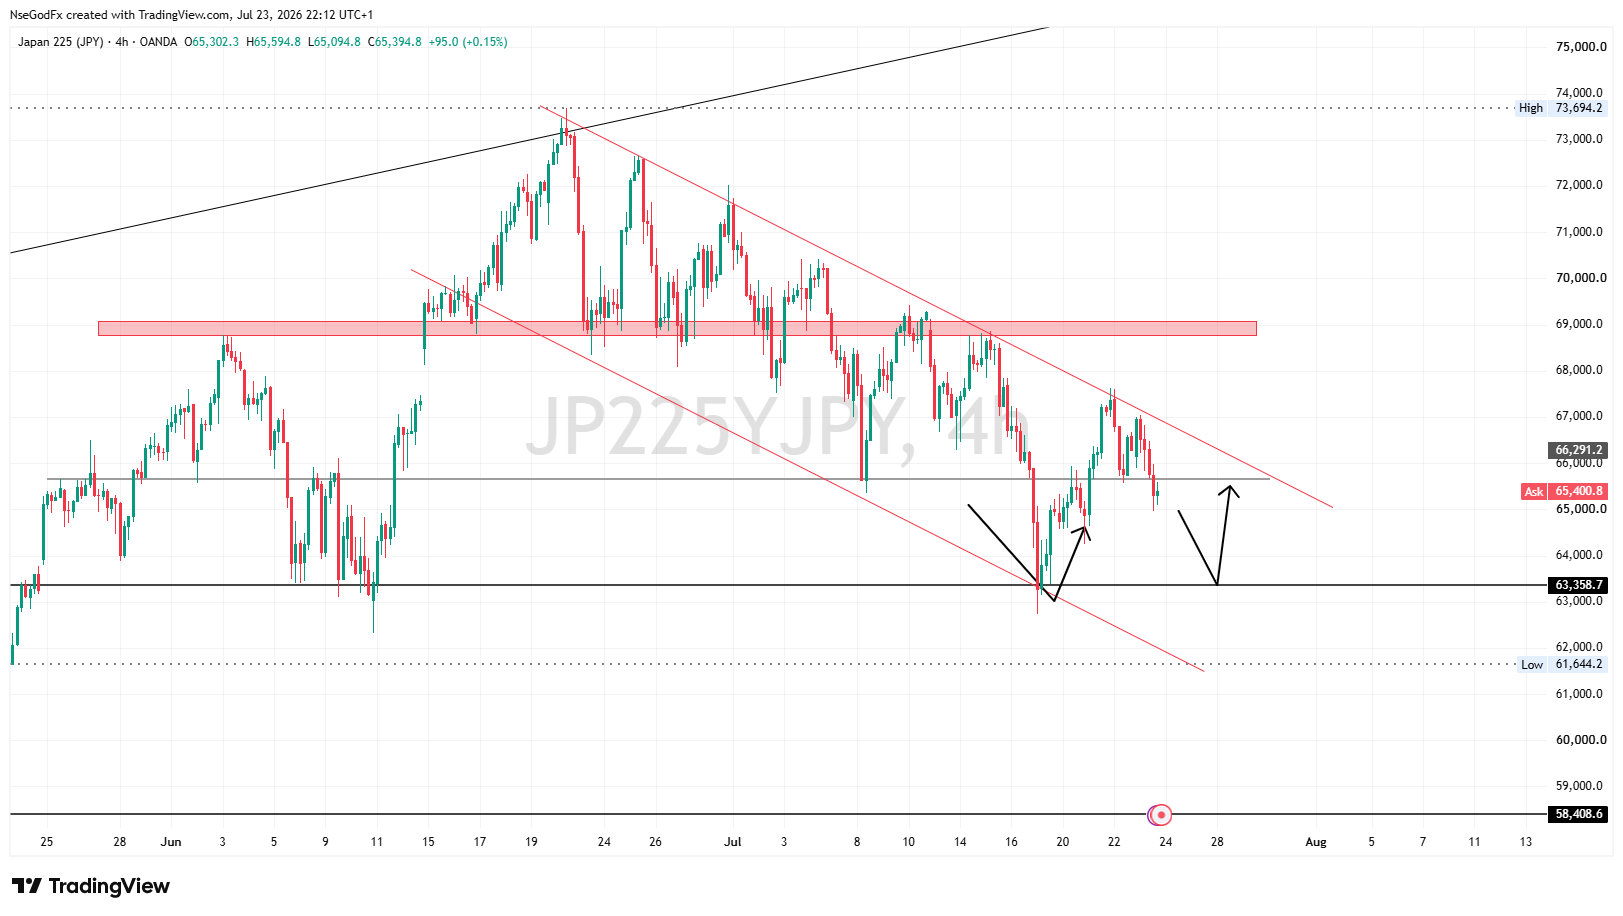
Price reacted at the Upper boundaries of the Bearish Channel and retreated for sells downwards. I'll be expecting the formation of double bottom at the 63,000-price level. This will signify buyers are mounting a defense at the support, and not ready to give up dominance to sellers.

Potential of Strong buys from the zone if the double bottom forms.

A
@asuquokelvin - 5 days ago
Quoted - nsg_usd

JP225- Trade Update
Price reacted at the Upper boundaries of the Bearish Channel and retreated for sells downwards. I'll be expecting the formation of double bottom at the 63,000-price level. This will signify buyers are mounting a defense at the support, and not ready to give up dominance to sellers.

Potential of Strong buys from the zone if the double bottom forms.

That 63,000 region is definitely the key level to monitor. A confirmed double bottom with strong bullish rejection, increased buying volume, and a break above the neckline would suggest buyers have successfully defended support and could trigger another impulsive leg higher. If support fails instead, avoid anticipating longs and wait for price to establish a new structure before reassessing the bias.

A
@asuquokelvin - 5 days ago
Quoted - nsg_usd

JP225- Trade Update
Price reacted at the Upper boundaries of the Bearish Channel and retreated for sells downwards. I'll be expecting the formation of double bottom at the 63,000-price level. This will signify buyers are mounting a defense at the support, and not ready to give up dominance to sellers.

Potential of Strong buys from the zone if the double bottom forms.

That 63,000 region is definitely the key level to monitor. A confirmed double bottom with strong bullish rejection, increased buying volume, and a break above the neckline would suggest buyers have successfully defended support and could trigger another impulsive leg higher. If support fails instead, I'd avoid anticipating longs and wait for price to establish a new structure before reassessing the bias.

A
@asuquokelvin - 2 days ago
Quoted - nsg_usd

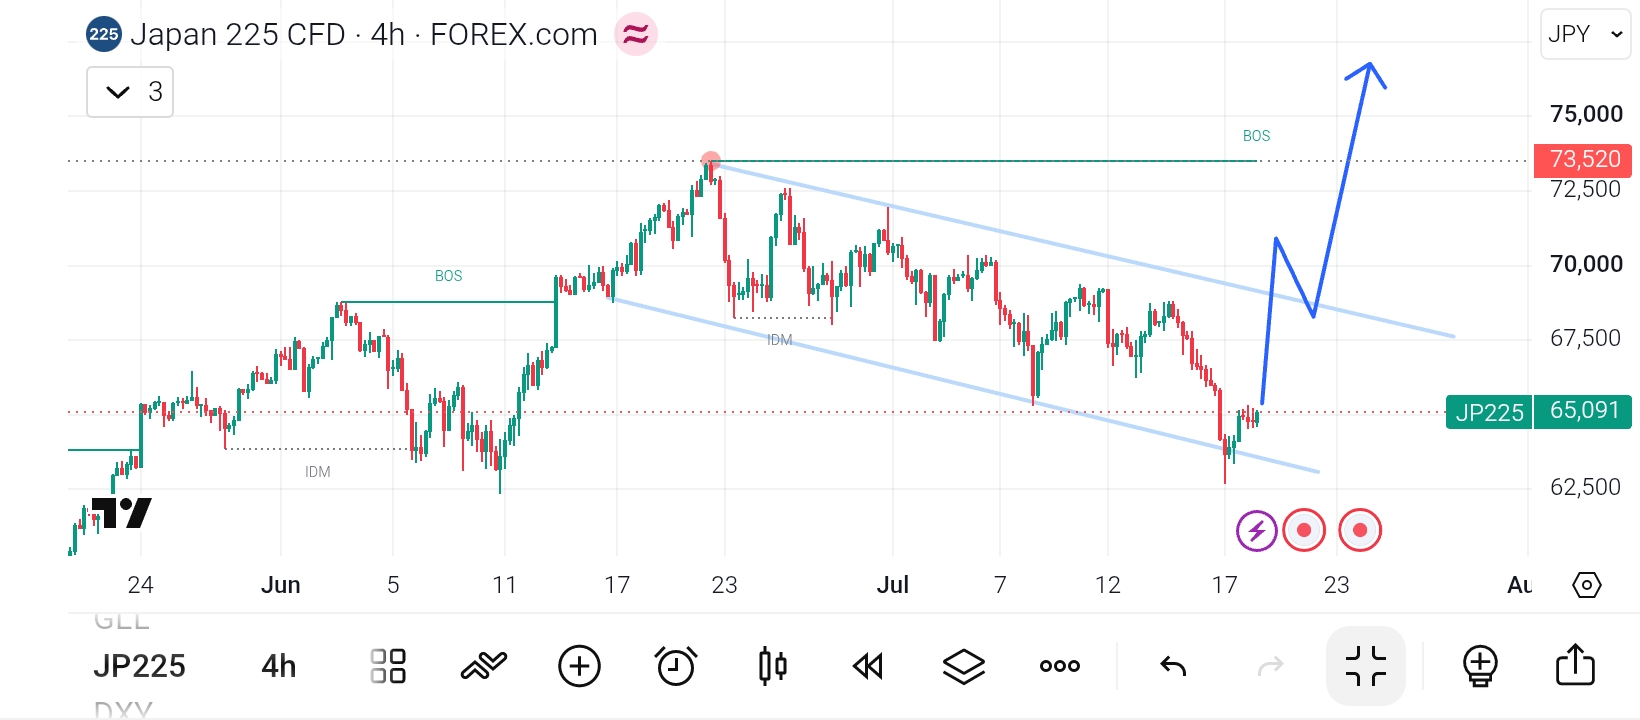
That's right. An intraday bearish channel has been created for the move down. Will monitor price reaction at the support level.

The channel looks exhausted, any break of an external high from that timeframe can cause a change in market direction

N
@nsg_usd - 16 hours ago

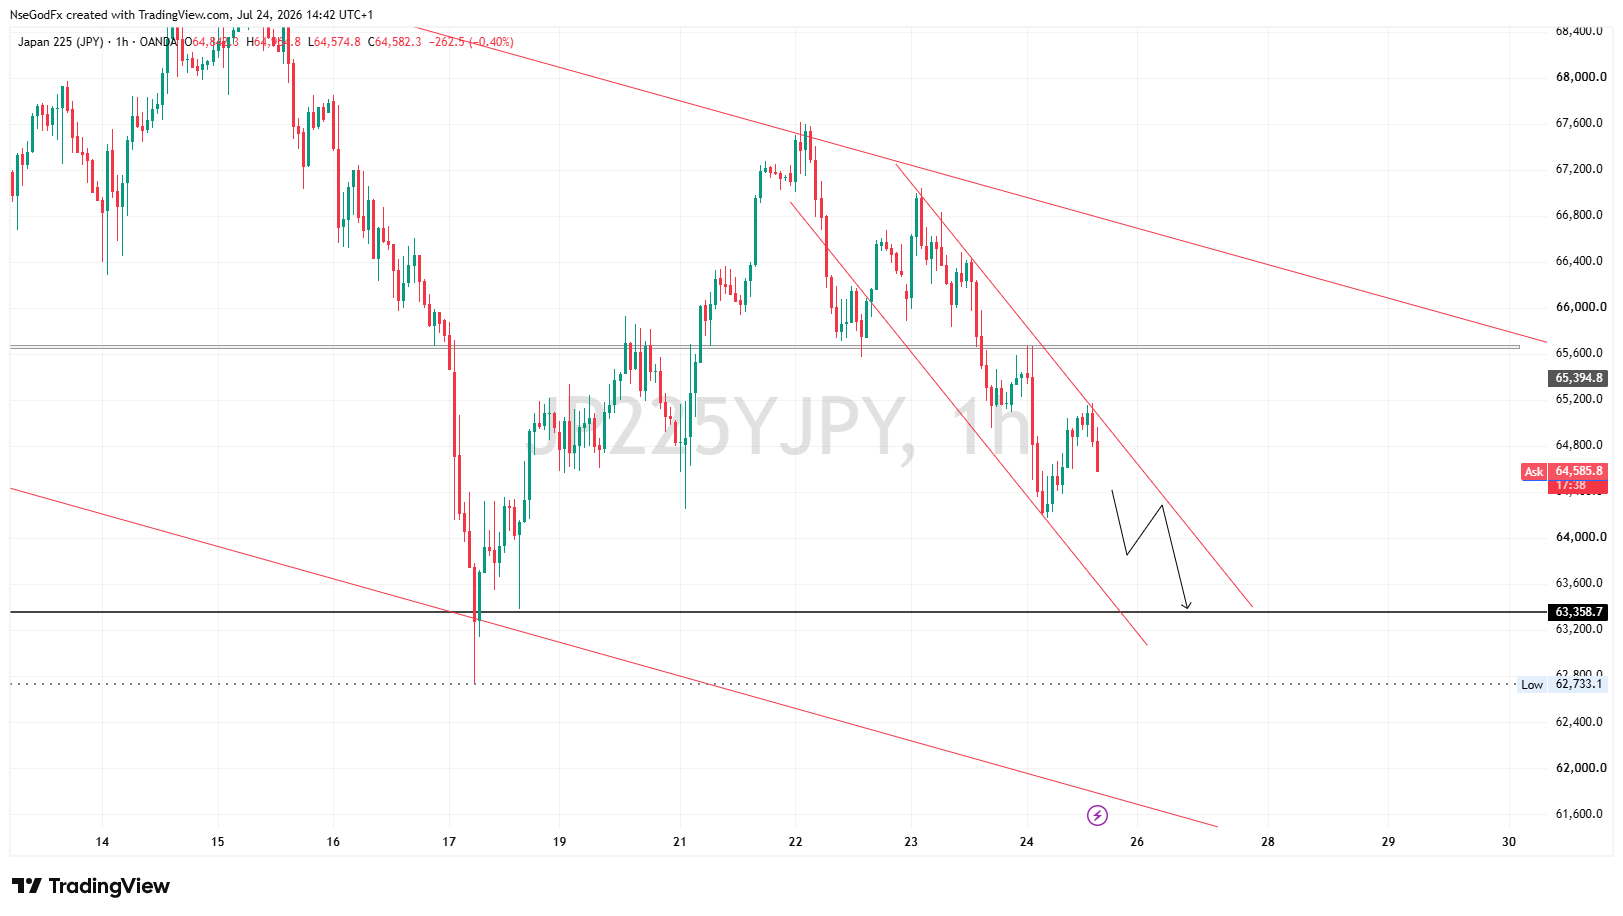
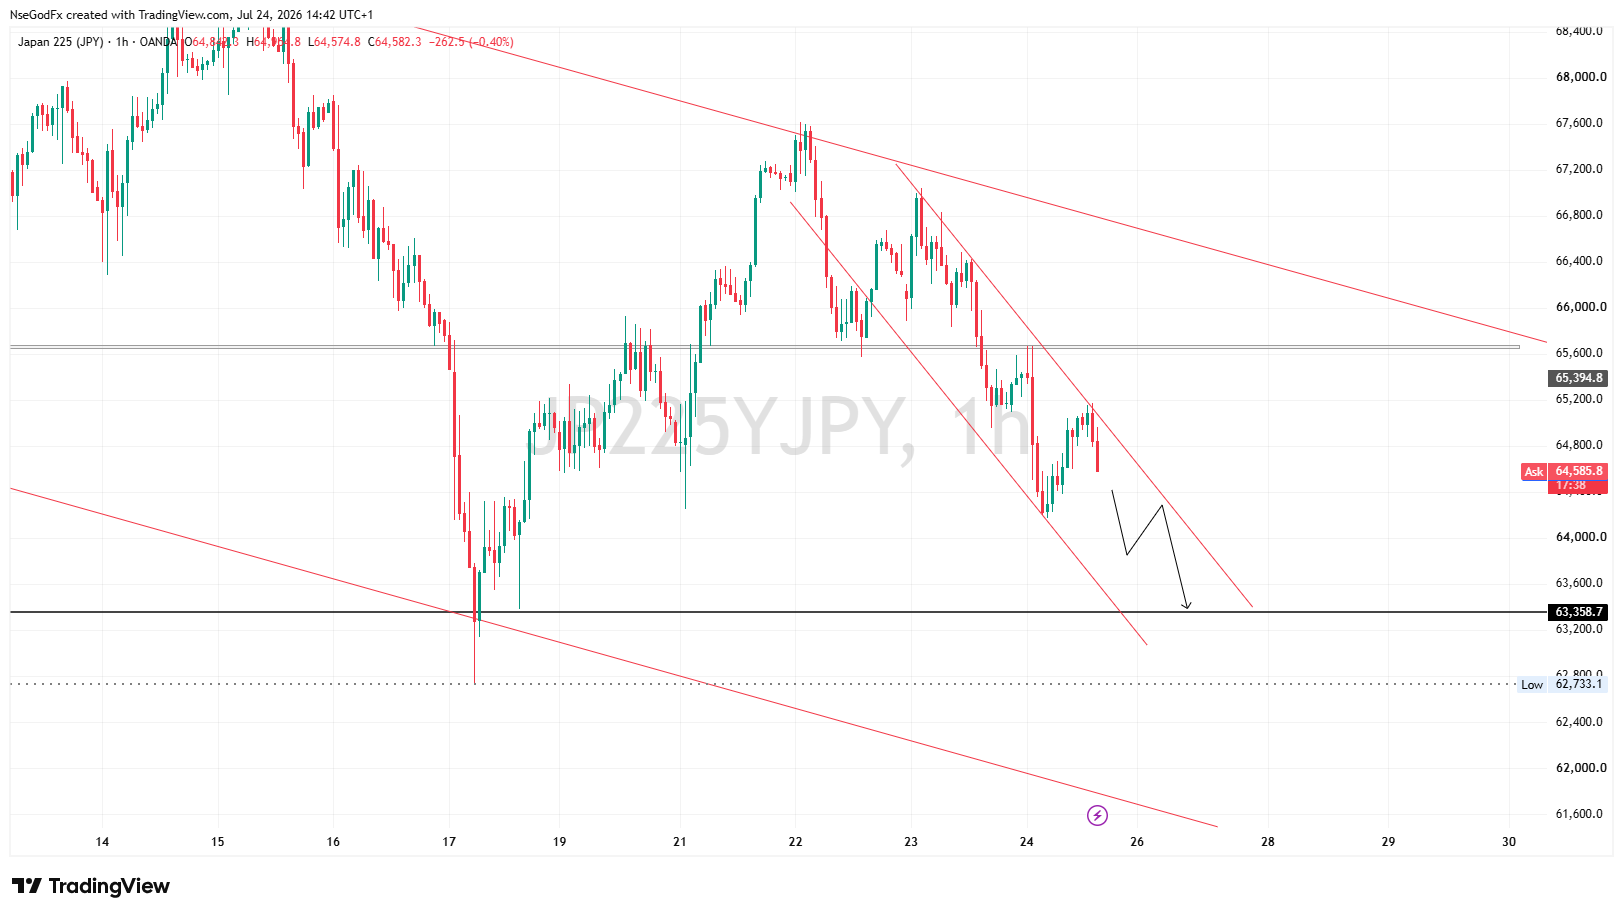
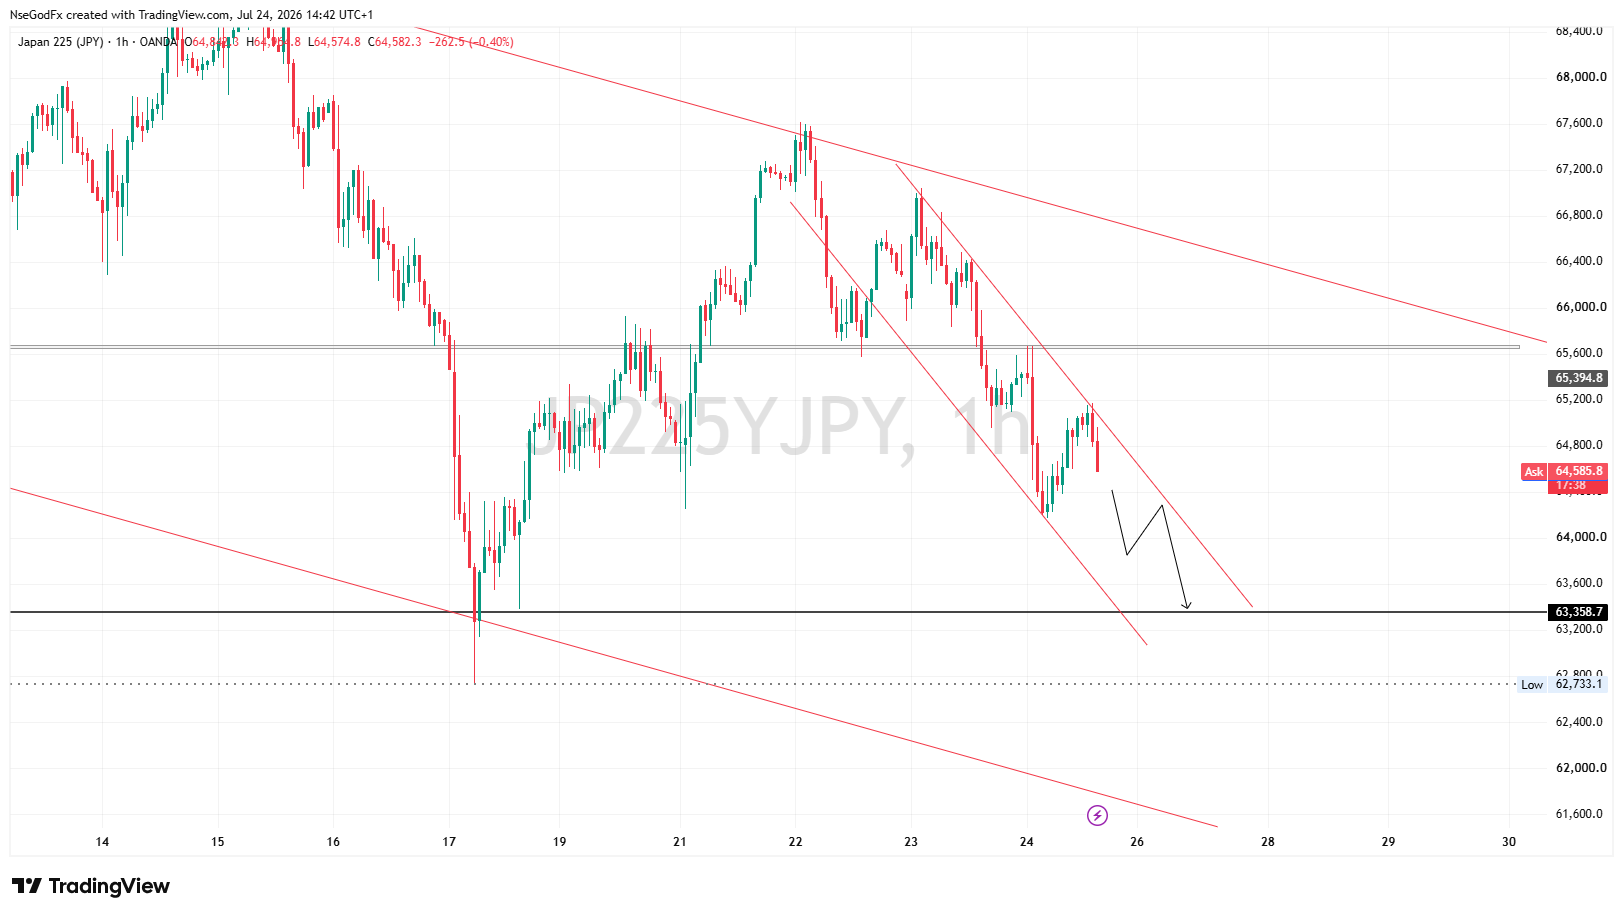
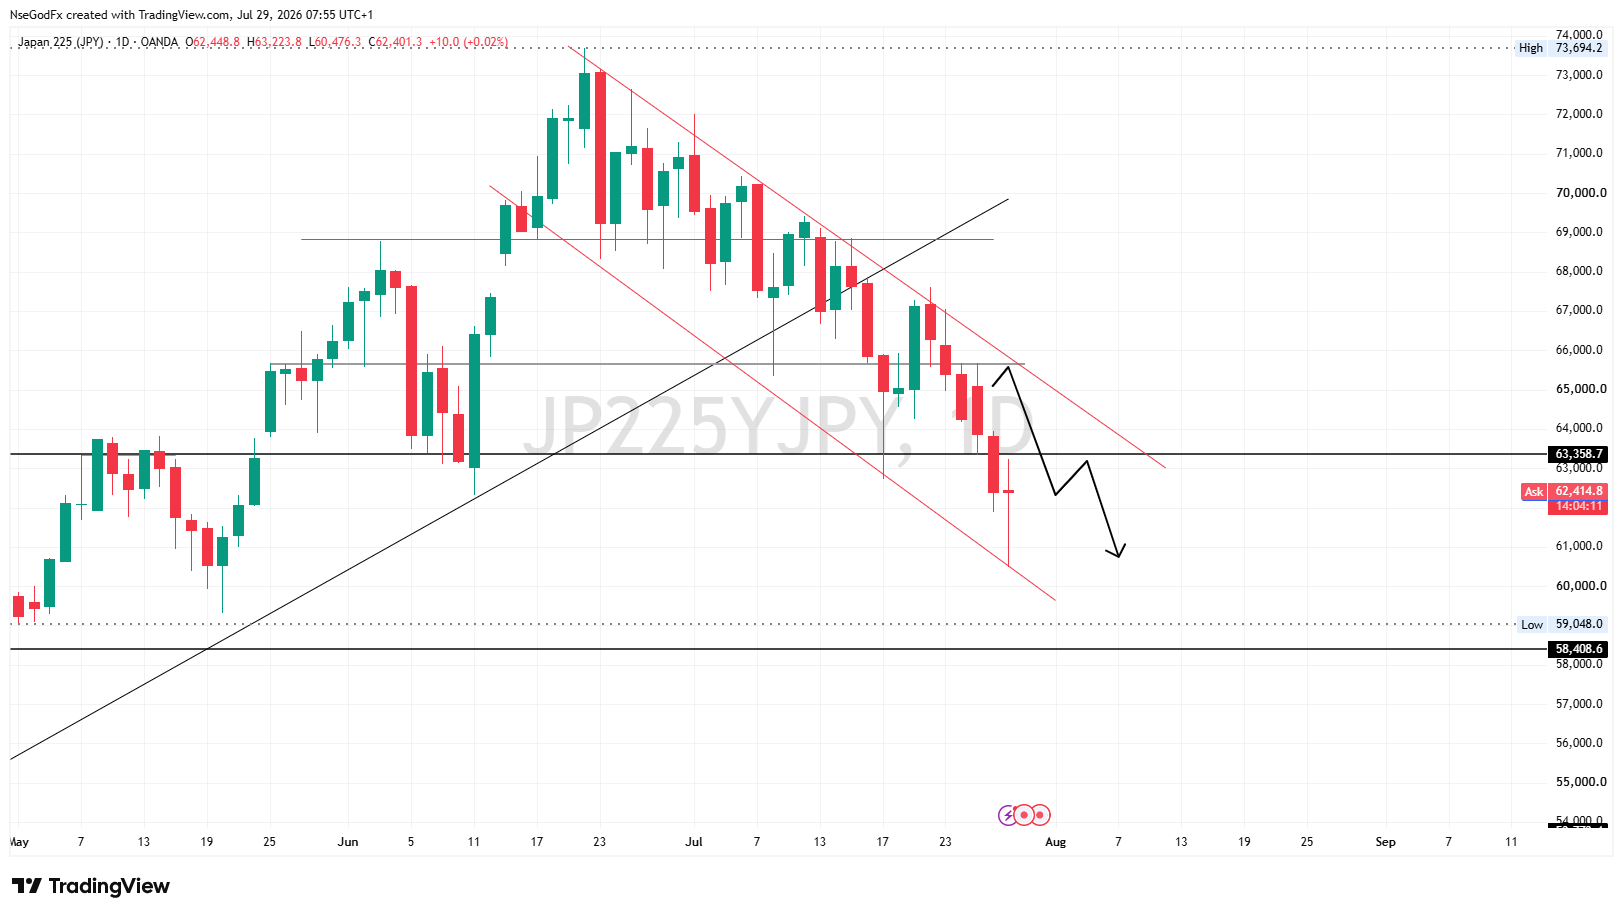
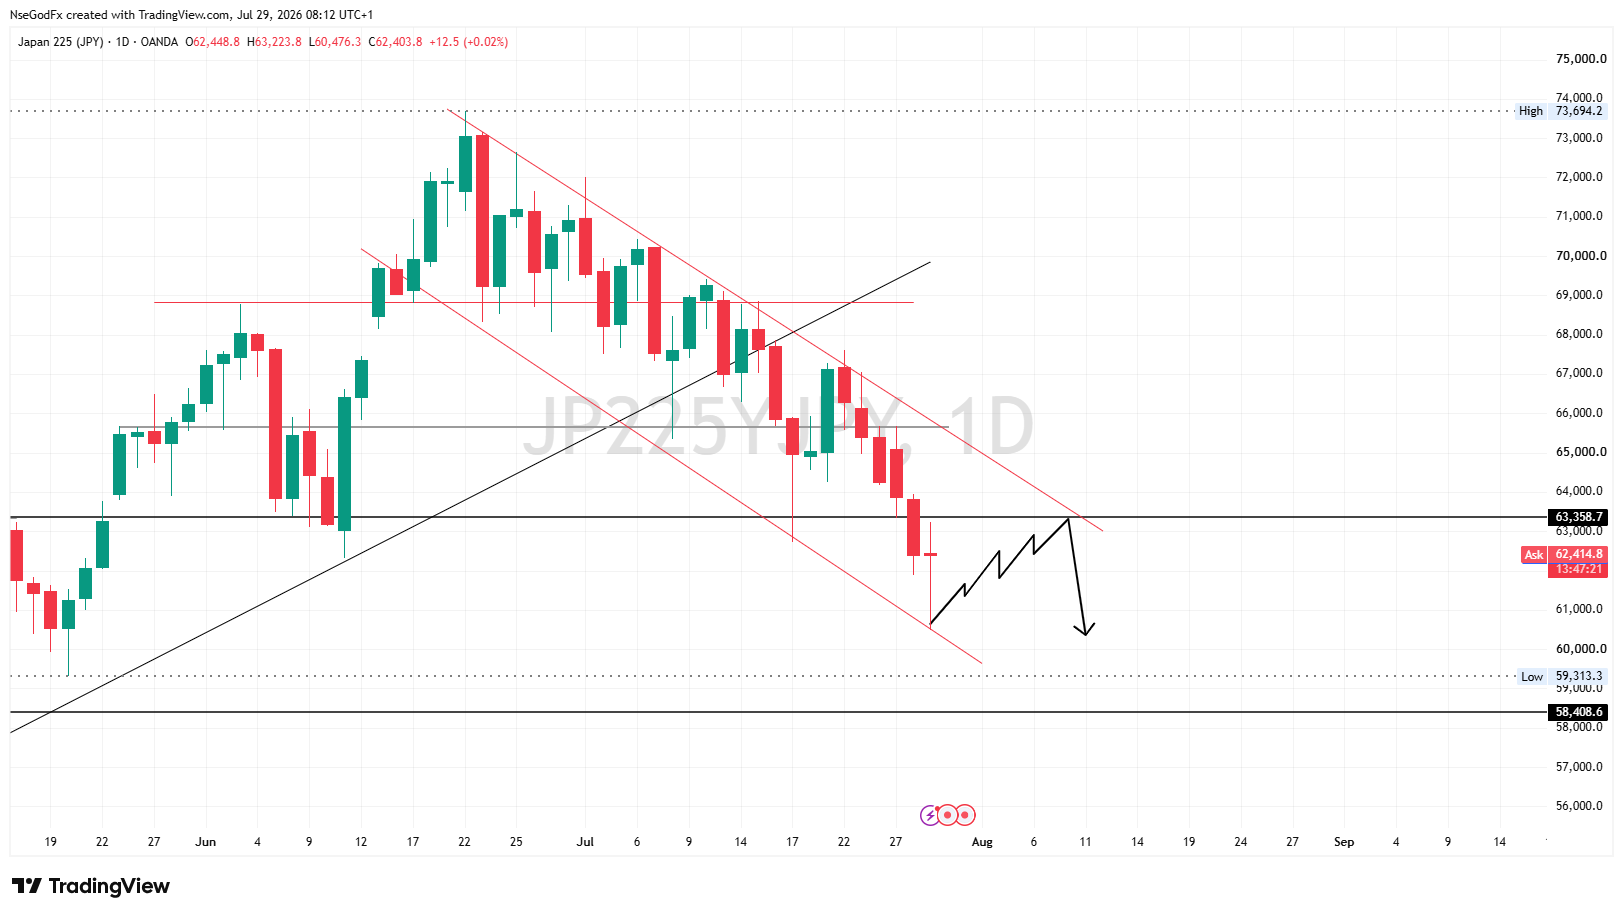
JP225 Daily Trade Analysis
Bias-Bearish
Technical Outlook-Descending Channel

Nikkei (JP225) has experienced a strong price decline of -3% gain this week following more sells on semi-conductor and AI stocks in Asia, which was preceded by US chip stocks like seen on Nasdaq.

Technically, the sharp selloff this week, resumed at 65,667 price level (Monday's high), breaking below a strong key level support @63000 price region.

Disclaimer:

At MyTradingLand.com, we connect you with forex brokers and provide a community for traders. While we offer valuable information and resources, please note that we are not financial advisors and cannot provide personalized financial advice. Always conduct your own research and invest responsibly.

Community Guidelines: The MyTradingLand.com community is designed as a resource for forex traders, promoting respectful and constructive discussions. We reserve the right to remove any content that is misleading, abusive, or violates our terms of service.

Broker Information: While we may receive commissions or advertising income from some of the brokers listed, this does not imply an endorsement of any broker, nor does it affect our review process. Our evaluations are based solely on objective criteria and user feedback.

Always verify the regulatory status of any broker with your local financial authority, along with their terms and privacy policies, before engaging with them. It is crucial to conduct thorough research to ensure that you are making informed decisions.

Risk Warning: At MyTradingLand.com, we strive to provide accurate information; however, the forex market is highly volatile and can change rapidly. It is essential to verify any information before making investment decisions.

Please be aware that trading in forex involves substantial risk, and it is possible to lose more than your trading equity/investment capital. 70-90% of retail CFD traders incur losses in their trading activities as per information from various brokers.

You are solely responsible for your use of MyTradingLand.com and any trading decisions you make. We encourage all users to educate themselves thoroughly about forex trading and to consider seeking advice from qualified financial professionals.

Advertising Disclosure: We may earn commissions from recommended brokers, but our reviews are independent (not influenced by potential earnings). Sponsored content is clearly marked and doesn't reflect our views.

©2026 ©2025 All rights reserved Mytradingland.com