MTL UNI
This is where we share lessons and real trades from the 20 Day Box Trading Strategy Challenge.
One trade per day.
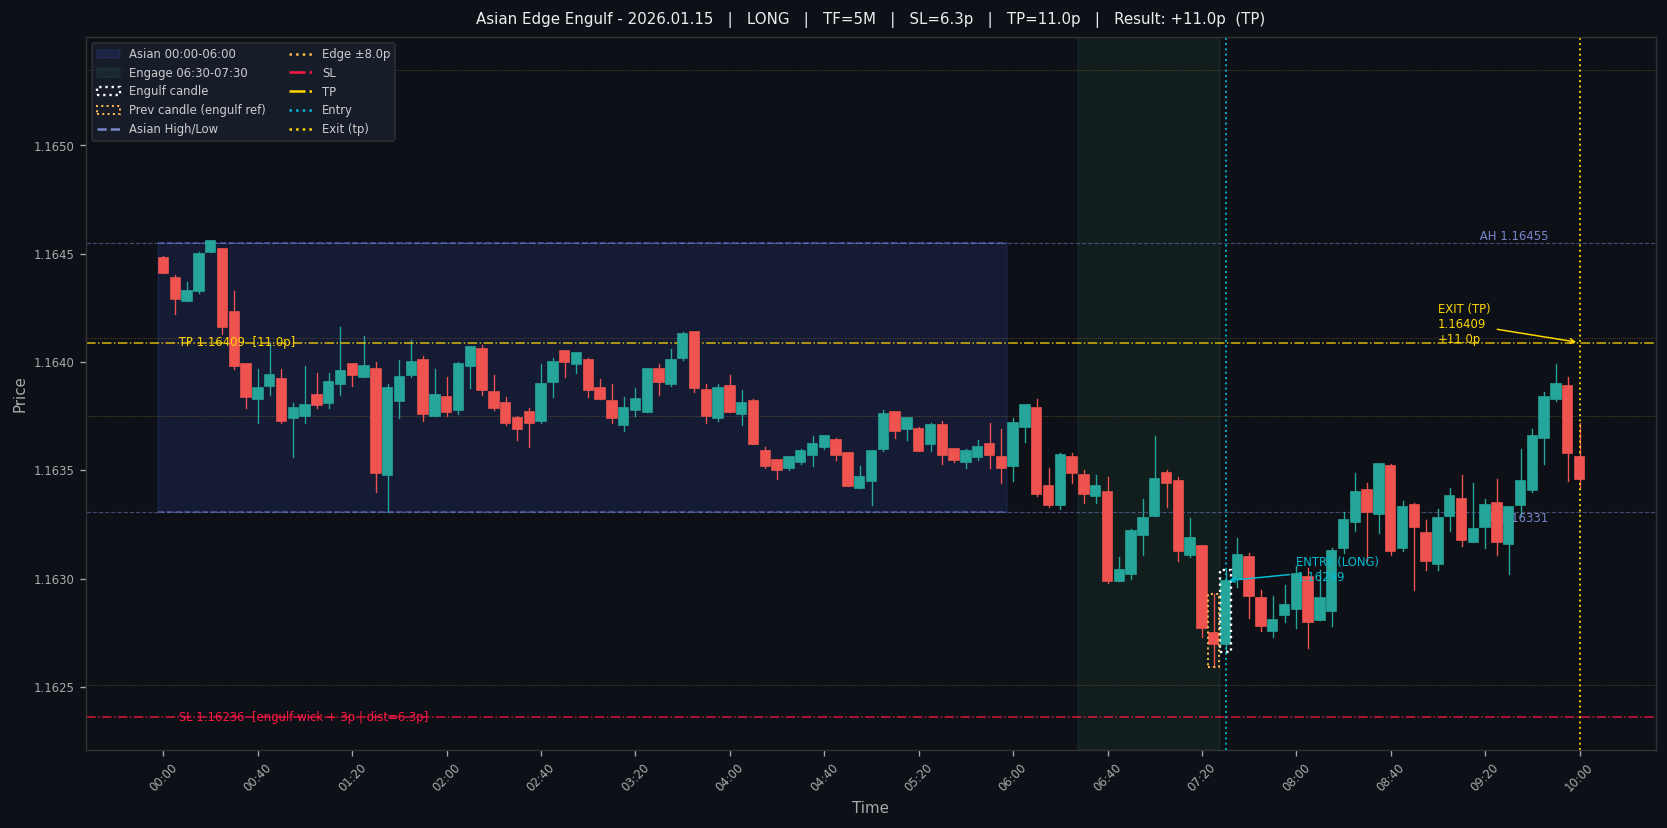
Only between 6:30 and 7:30 AM UTC.
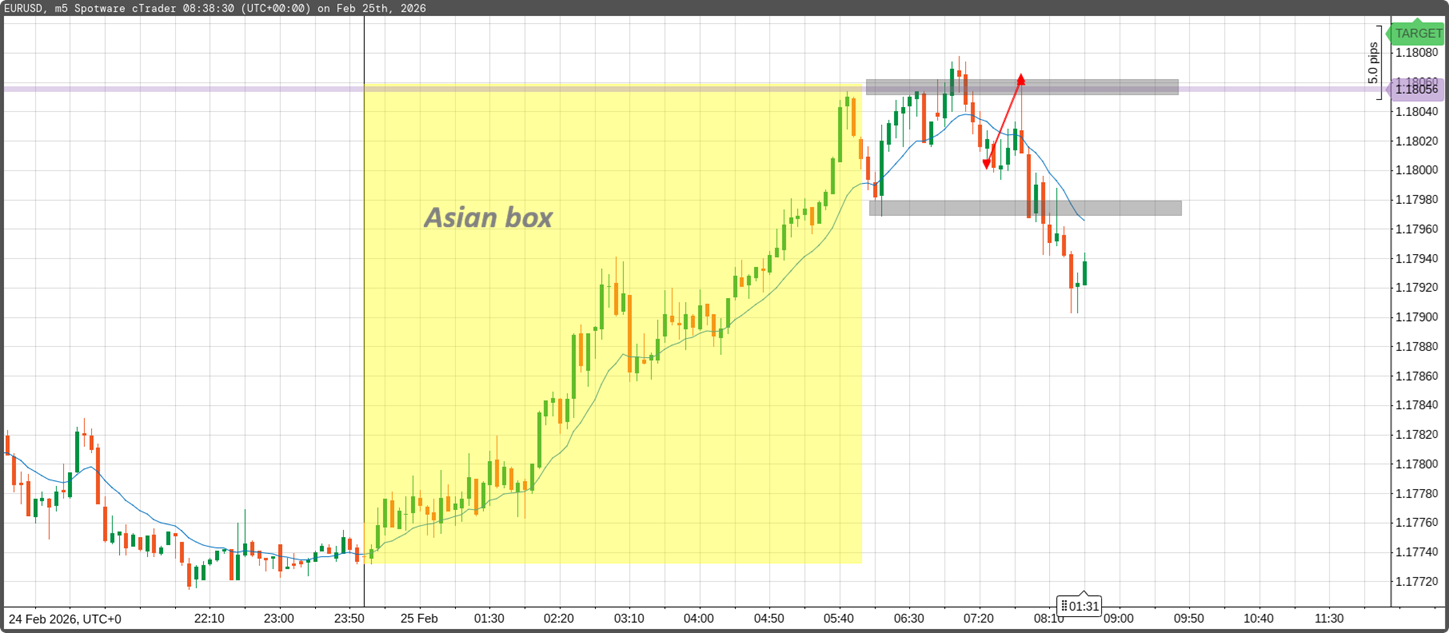
Only at the edge of the Asian range.
Stop loss 3 pips beyond the trigger candle.
Fixed or proportional take profit based on risk.
No moving stops.
No cutting winners early.
No revenge trading.
No second trade.
Inside the community, we post executions, review discipline, and focus on following the rules exactly as designed.
Because the goal is not to be right every day.
The goal is to execute correctly every day.
Hi, I'm also very interested to be part of this journey every morning. Thank you.
This is the Running Pip Total Chart or "Trade Performance Accumulation Chart" over the last 4 years of data.
The Asian Edge Engulfing setup is a rules-based, price action strategy on EURUSD using the 5-minute chart.
The core idea is simple: the Asian session (00:00–06:00) creates a defined price range. Once that range is established, we watch for price to revisit one of its edges (at the edge or outside it by 6 pips max.) and then if there is an engulfing pattern - during a specific engagement window of 6:30 to 7:30 UTC (London time), we enter.
If no valid setup appears in the window, there is no trade. Full stop. There are lots of examples (you get one every other day), I'm attaching one.
I'll follow up more on this later.
Okay I saw the challenge on YouTube and I'm in to participate.
Yes!!!! 20 days of focused execution
Day 1
I got stopped out because I placed my stop loss too close but the price action worked out pretty well as you explained in your video. Next time I will place my stop loss further away from the reversal point.
Day 1
I got stopped out because I placed my stop loss too close but the price action worked out pretty well as you explained in your video. Next time I will place my stop loss further away from the reversal point.
The SL must go 3-4 pips above the trigger candle. This was the trigger, my SL was at 09, it was very close to hitting.
My average entry was at 18026, I exited the position at the pre low of around 96 (green box low). On some days when Asian is trending, the pre-low continues the trend.
It did go to the next hourly low of around 90, but I was cautious, so I took all off at the pre low.
Yes, I think I will reduce/lower my lot size next time so I can set a wider stop loss.
Pls what timeframe is this?
This is a 5-minute timeframe
Yes, I think I will reduce/lower my lot size next time so I can set a wider stop loss.
Sizing the trade correctly is so important, I cannot emphasize this enough.
I want to show you something that took me some time to truly understand (it helps you protect your equity, knowing when to size up or size down or keep it consistent), and I think seeing it visually makes it click in a way that no amount of theory can.
Both charts below are the exact same trades over the years on the same strategy. Same entries, same exits, same win rate of 45% on an average. The only thing that changes is how much risk was applied per trade.
Chart 1 is 2% risk per trade & Chart 2 is 5%, just for example on the same strategy with a starting balance of $1000.
Same $1,000. Same trades. One ends at $7k, the other at $71k. But there is a caveat. You have much bigger drawdowns.
The 5% curve looks obviously superior on paper. 10x more money from the same sequence.
But look at what you're actually living through to get there. A 41.4% drawdown means at your worst point, your account dropped from peak all the way down. You watched nearly half your peak equity evaporate.
Most people don't survive that psychologically. They reduce size. They skip signals. They close the system down. And by doing so, they miss the exact rally that generates the bulk of the returns.
The 2% curve never puts you in that position, the max drawdown on this edge will be 18%. But for a small account, it may not even grow that fast or by much. You can maybe expect it to double in an year.
It's not just a math problem. It's a psychology problem. The question isn't "what size maximizes my return on paper?" The question is "what is the largest size I can trade without altering my execution during a losing streak?"
For most people starting out, that number is lower than they expect. But psychologically, are you happy with those returns? That is why you either need larger capital where you minimize drawdowns but are not expecting too much, or you are risking a high percentage, but there are risks there too.
In all that, don't ignore the fact that you first need very clear trigger strategy (with risk framework depending on how many strings of losses your strategy can get) that is mechanical, so you don't think, just do.