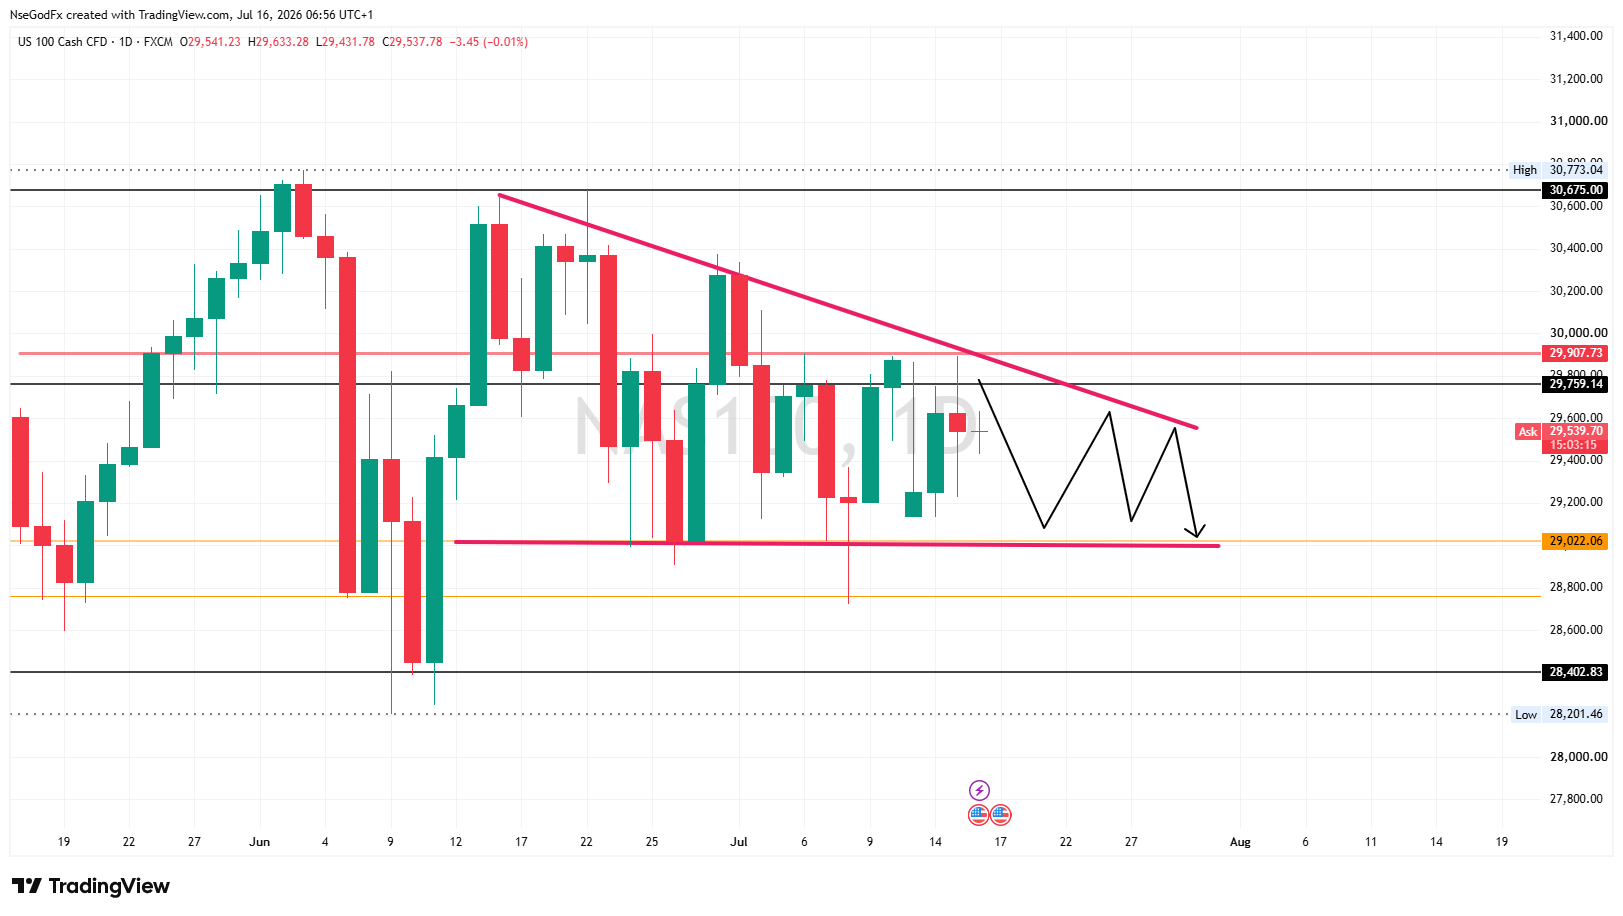
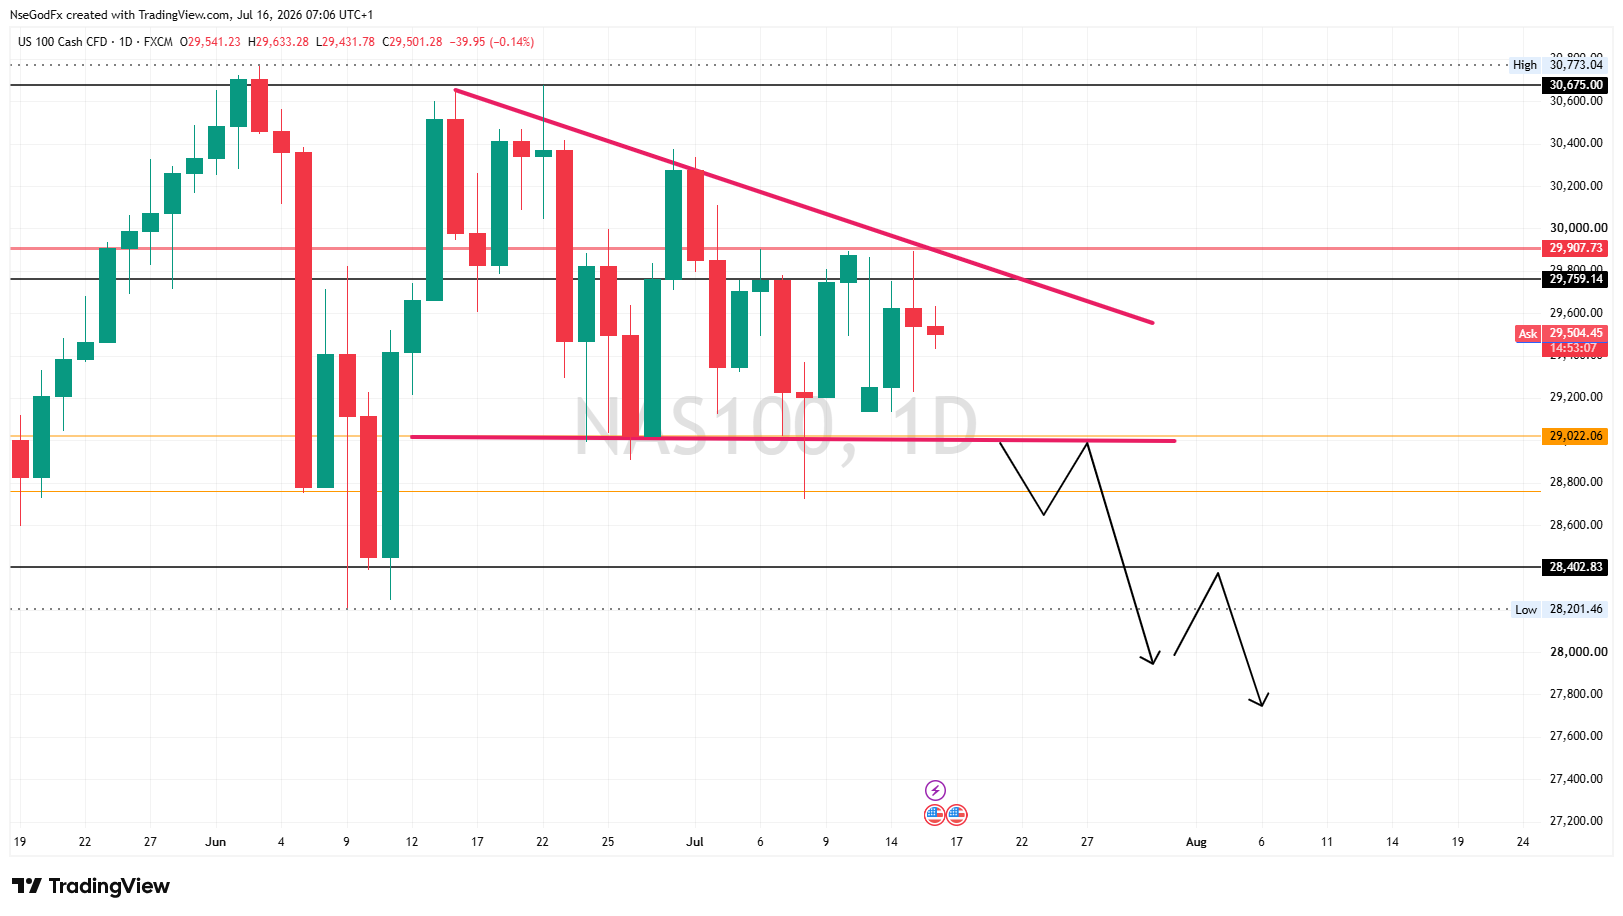
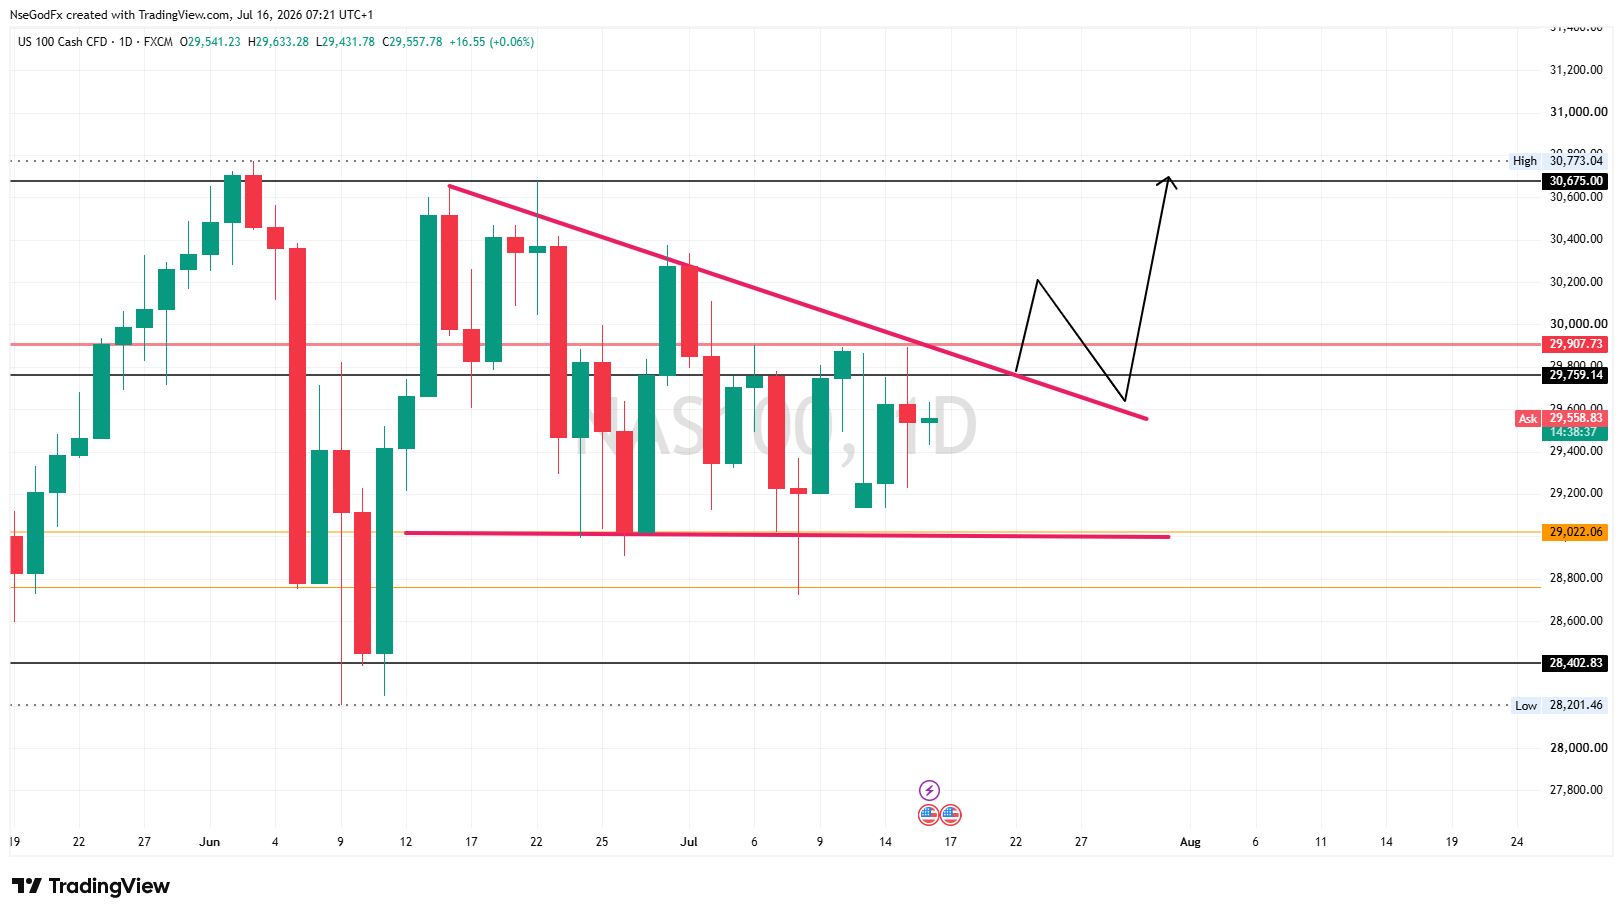
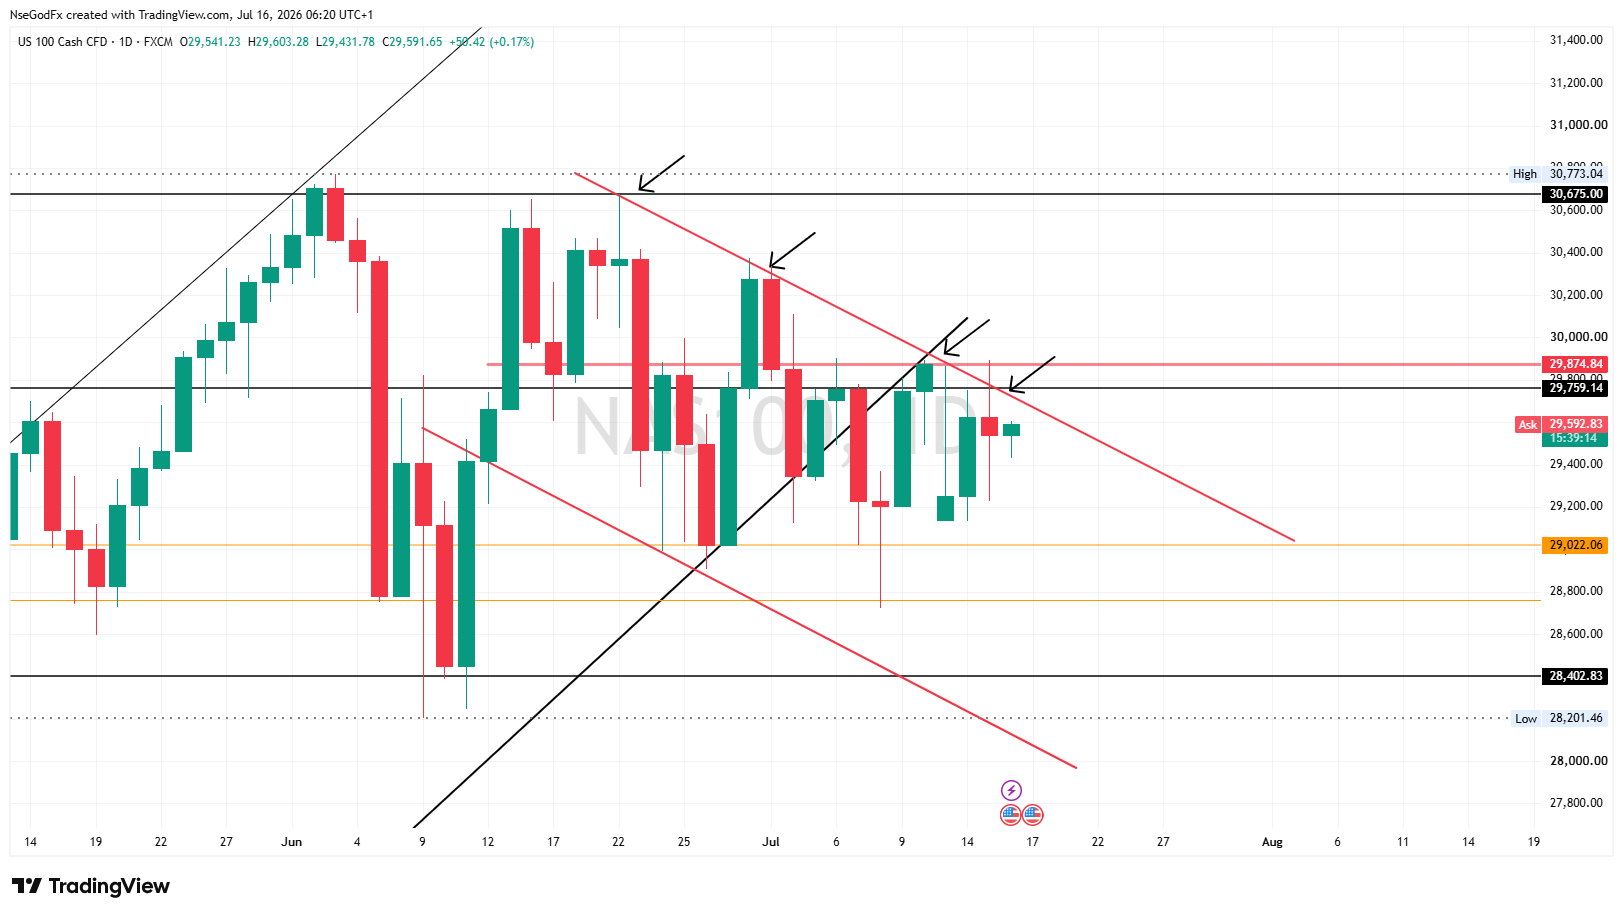
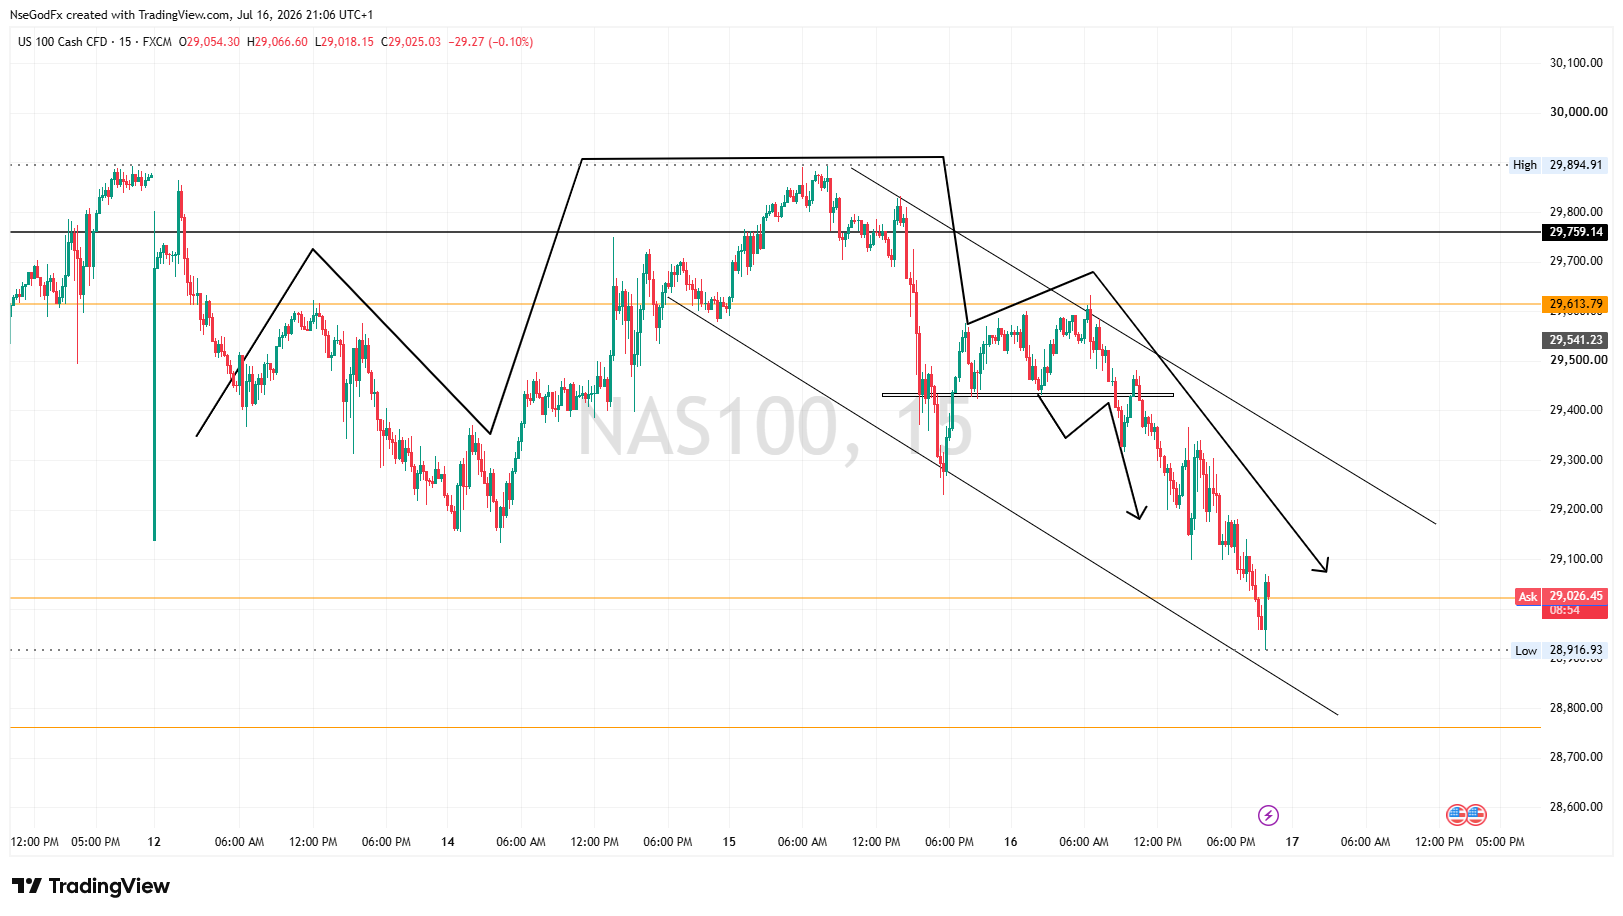
Nas 100- Daily Descending Triangle meaning (part 3)
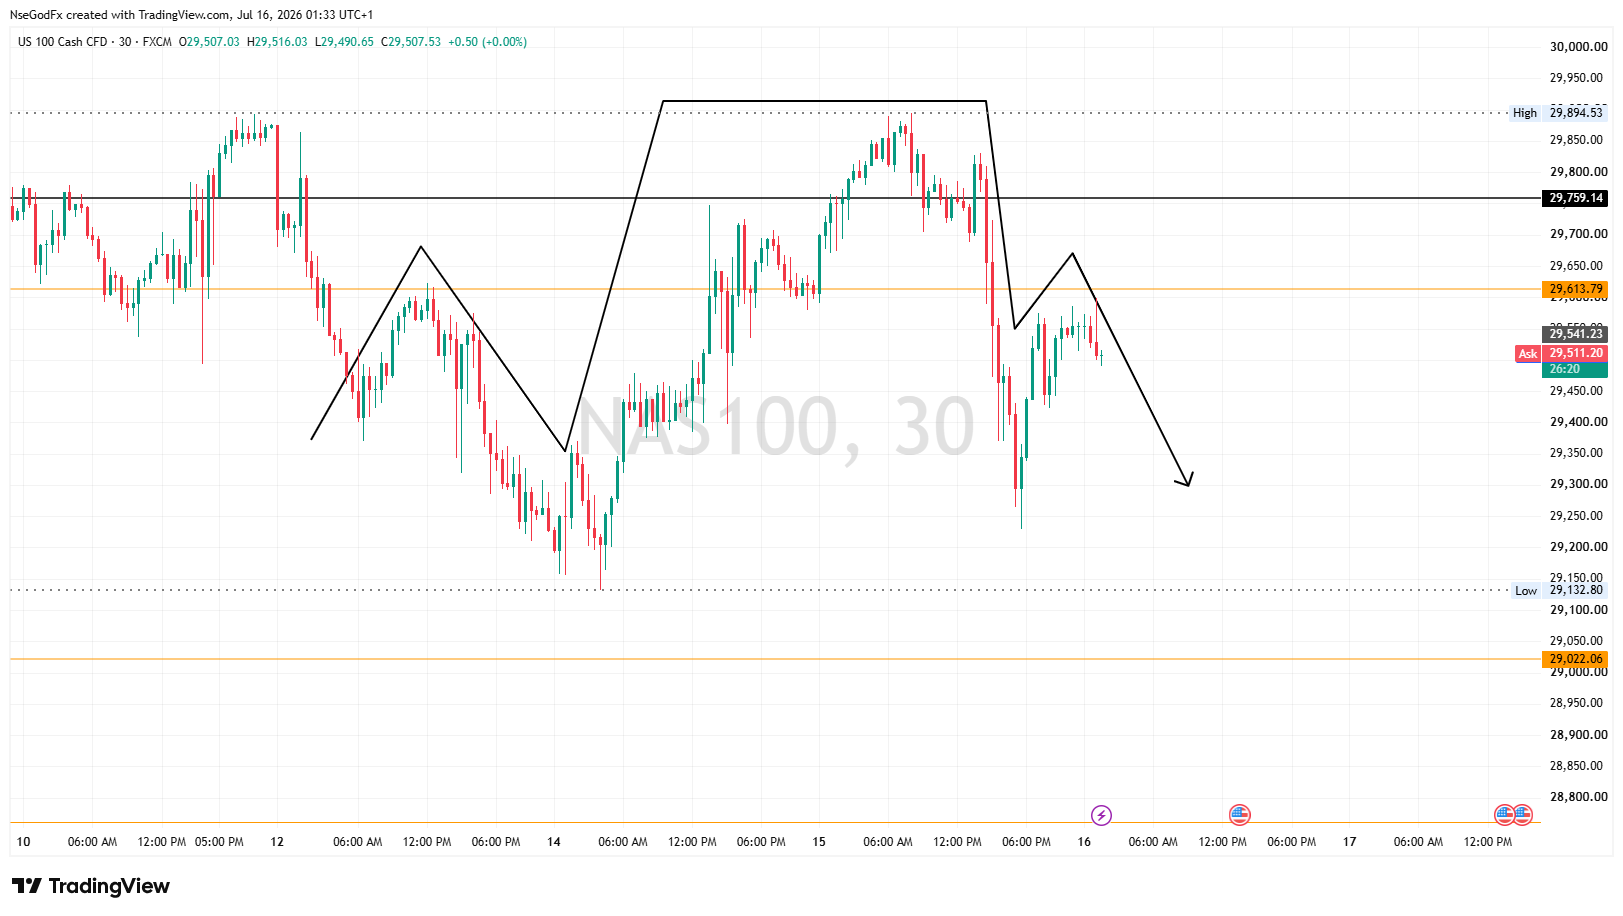
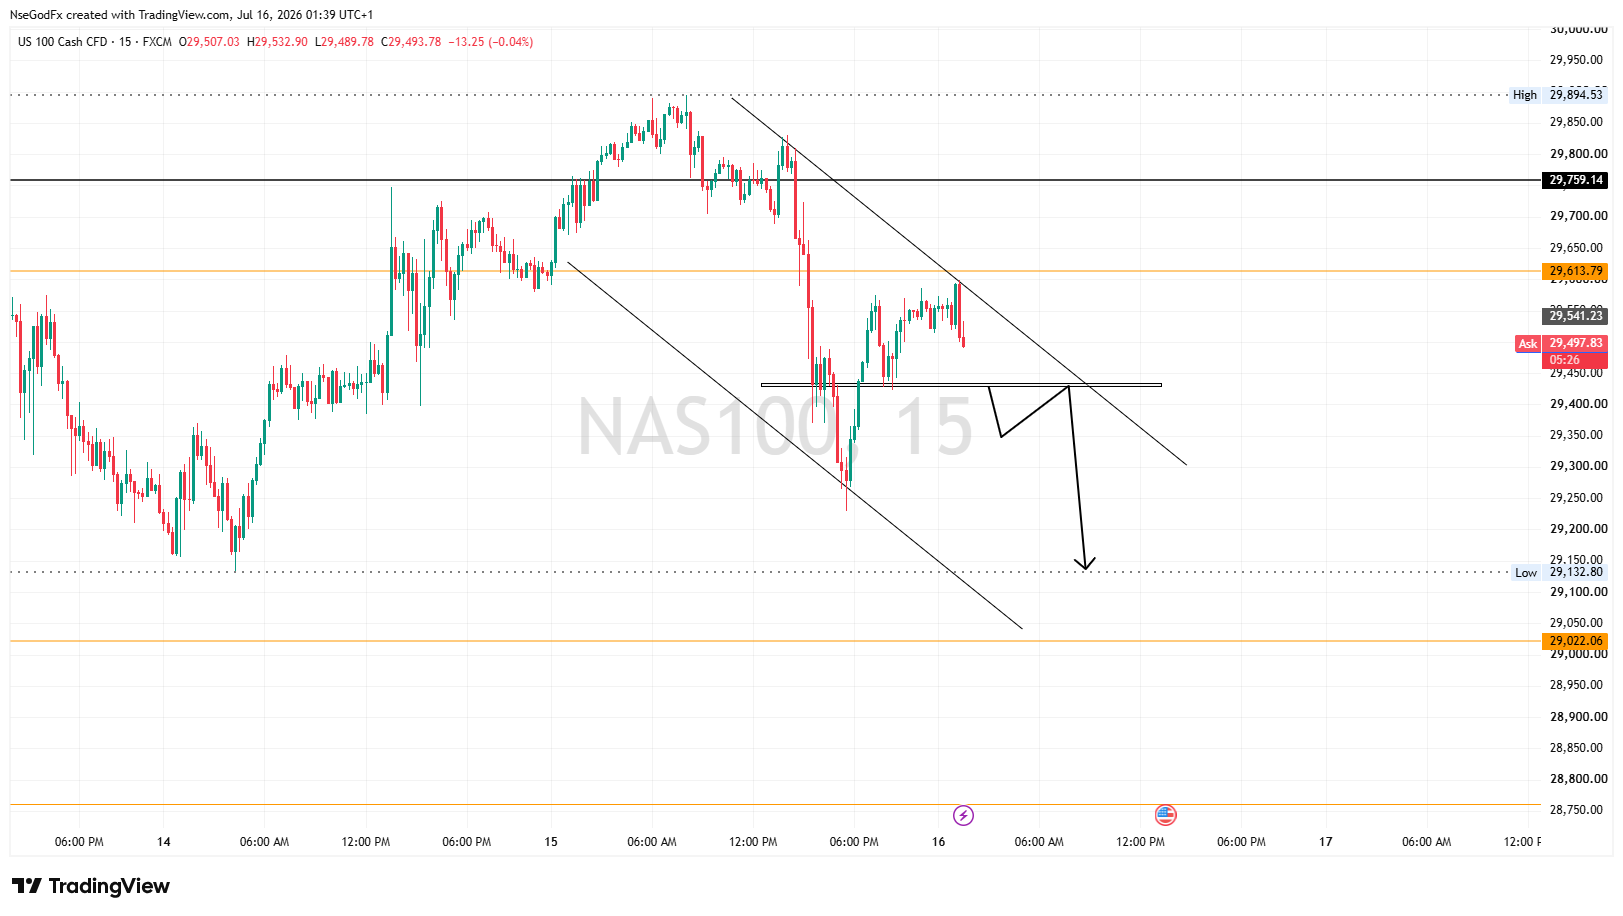
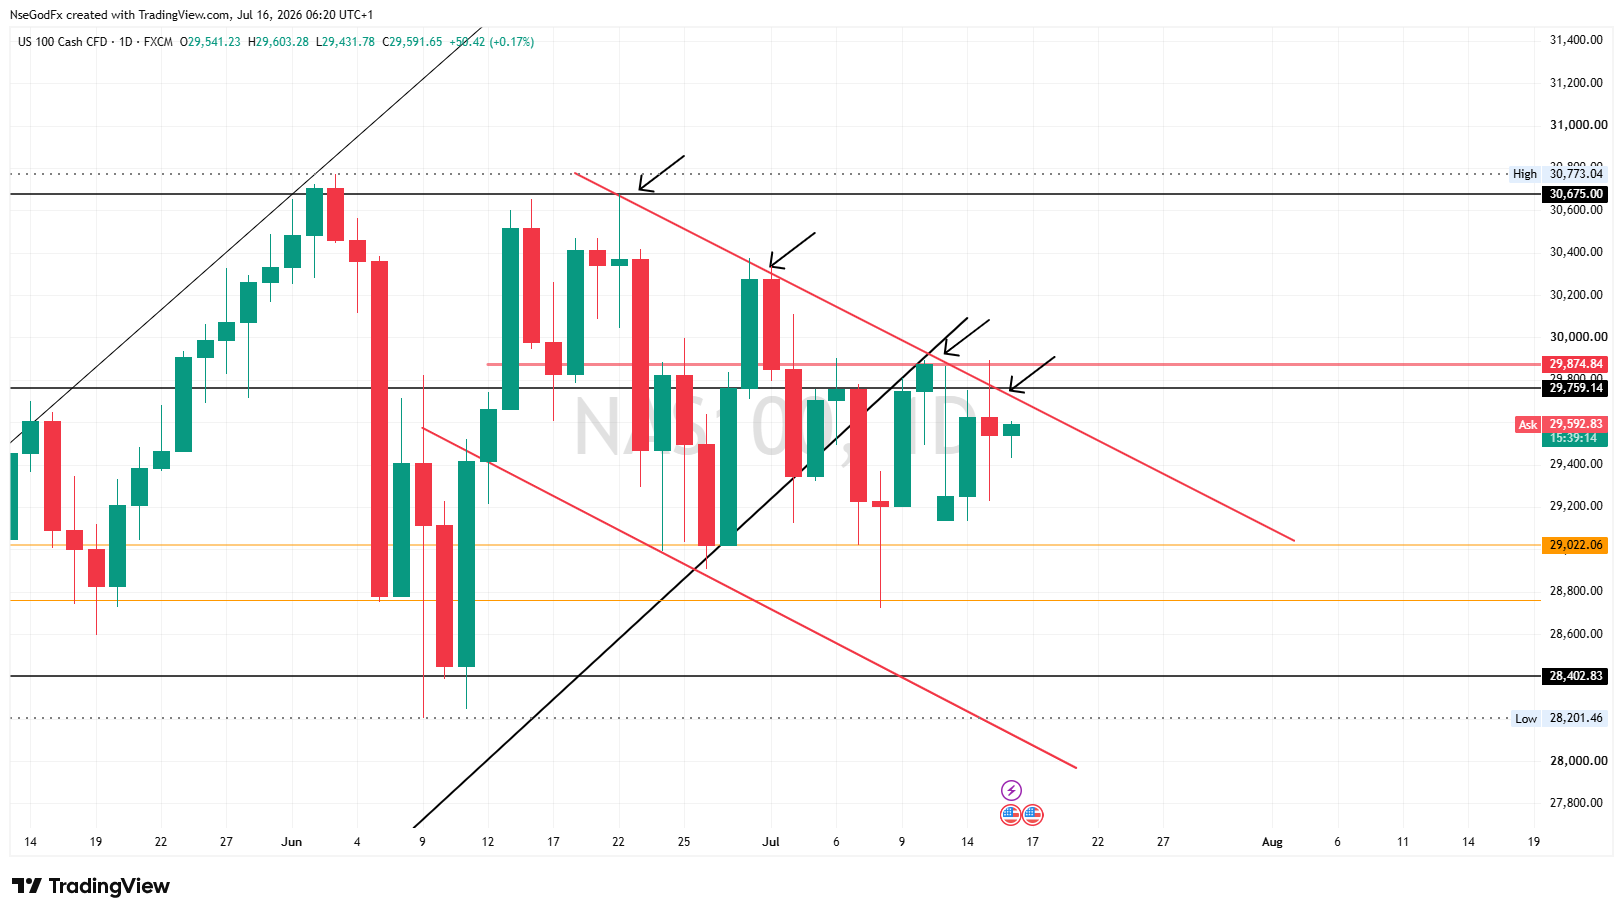
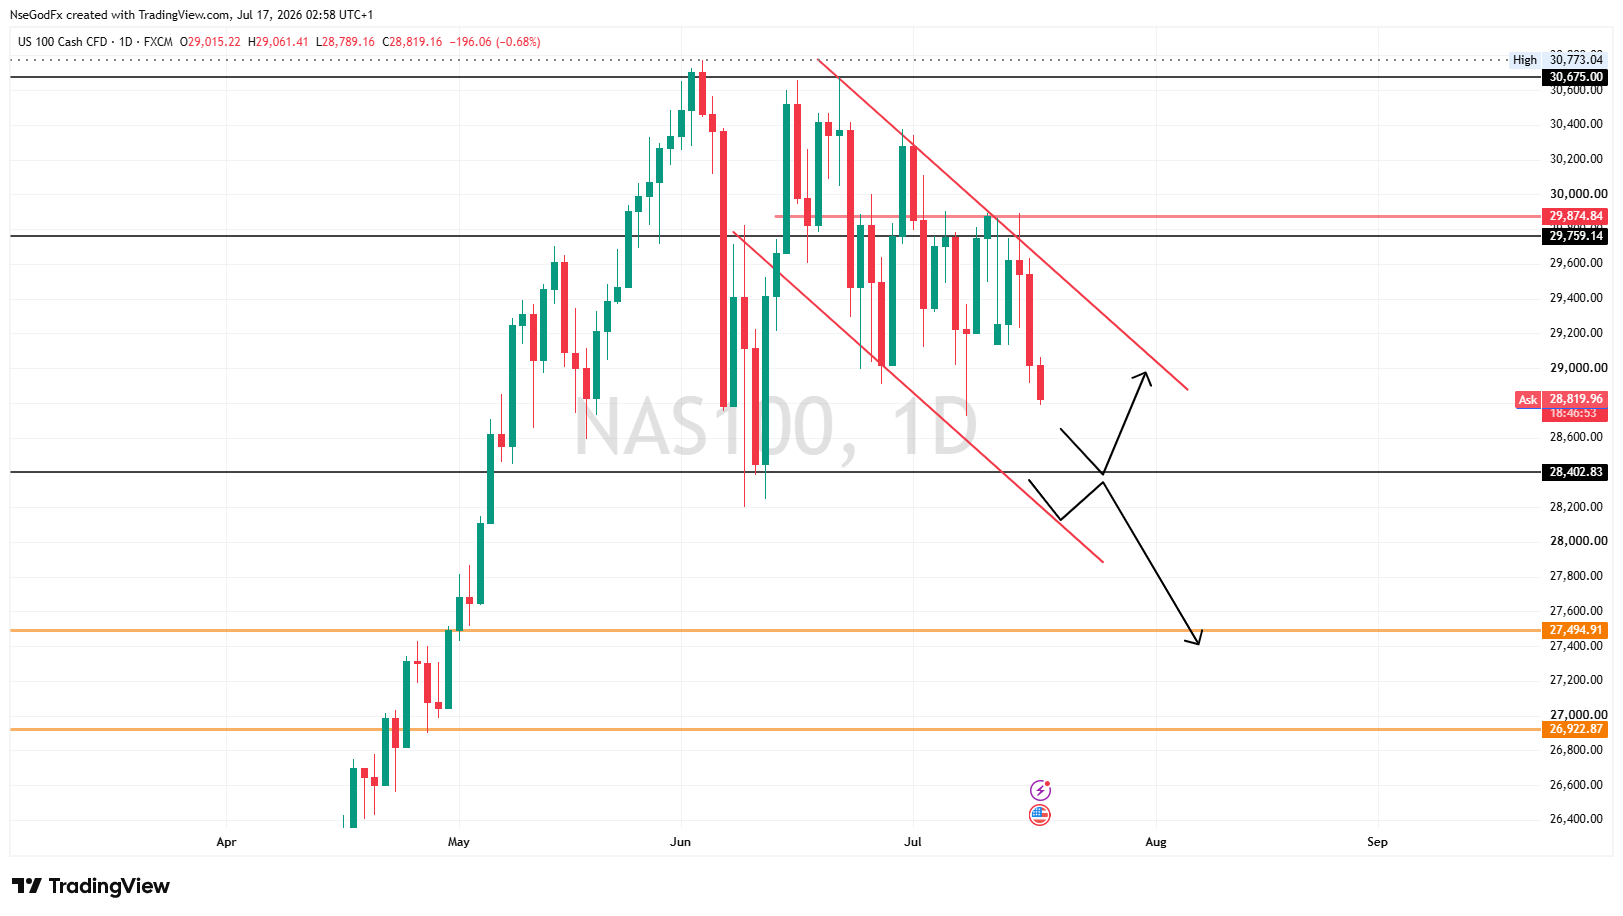
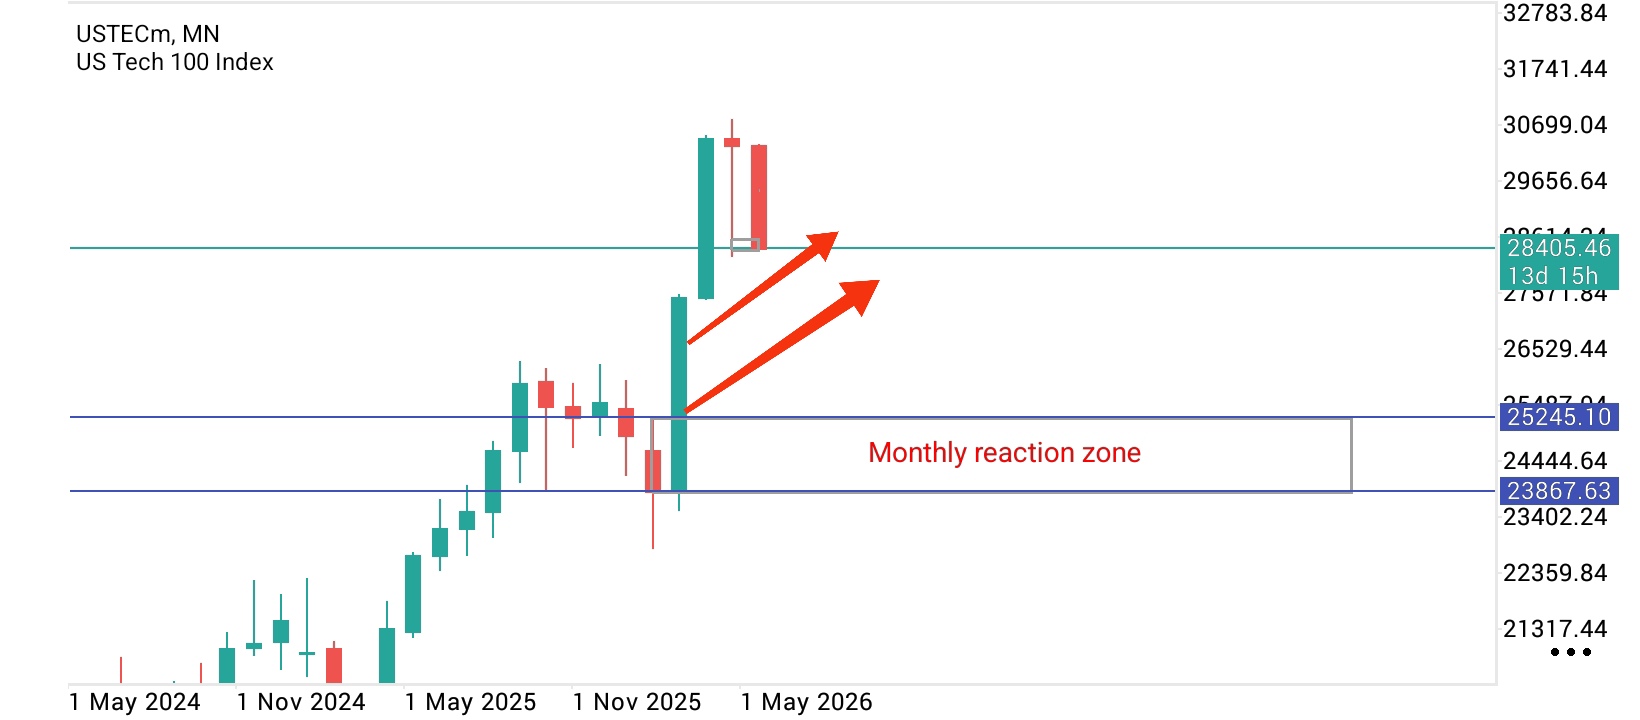
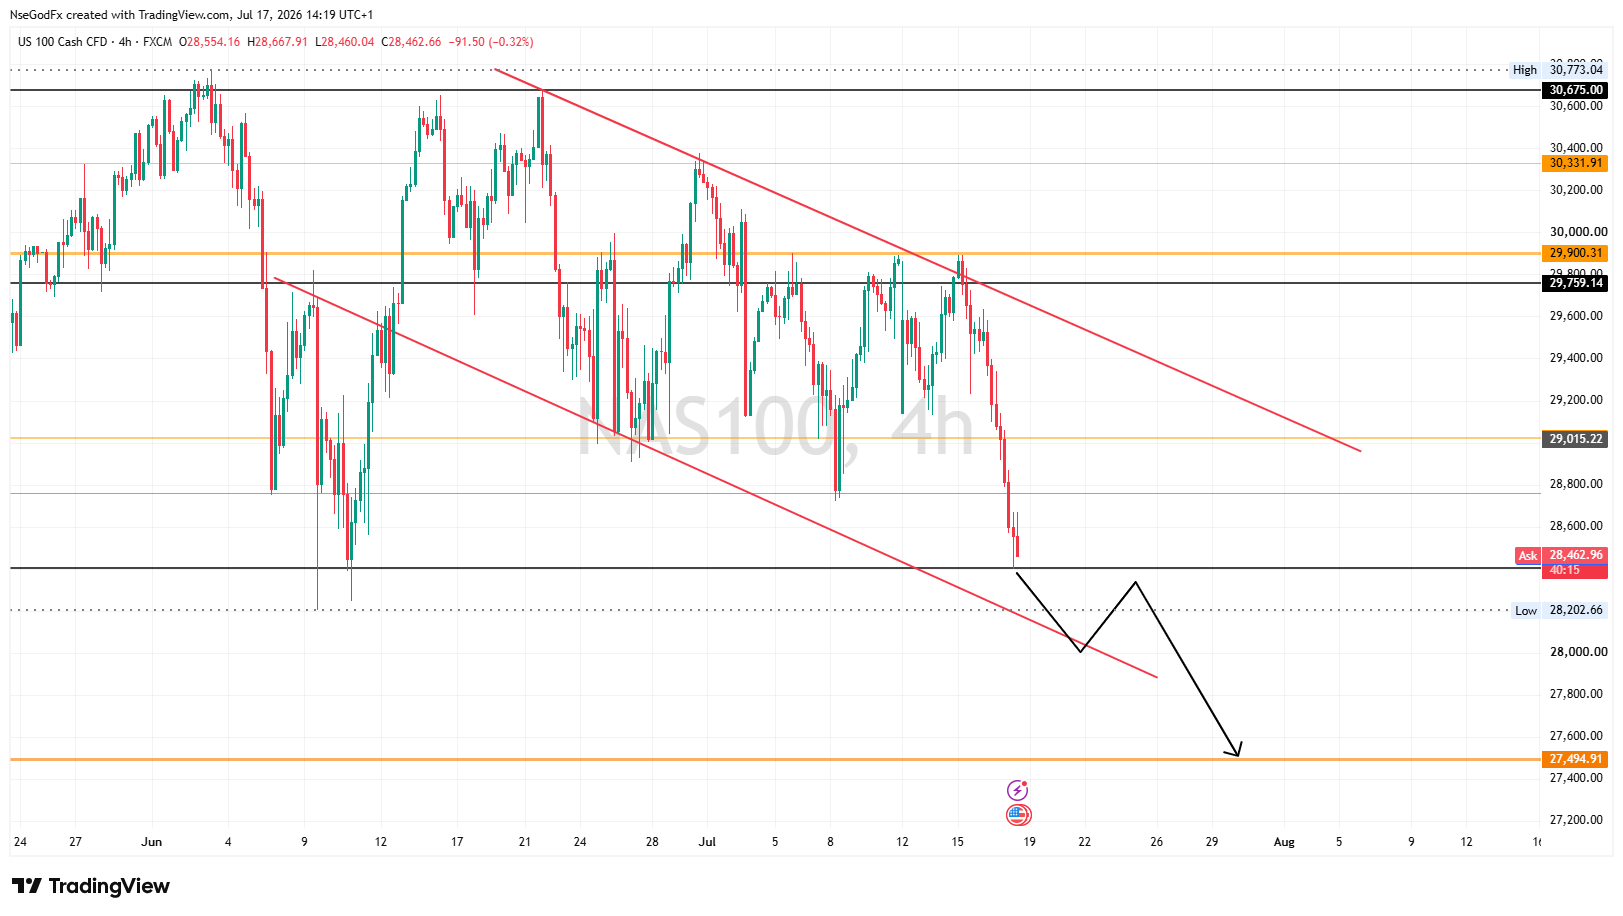
Although the prevailing breakout in a descending triangle is often bearish (downside breaoukout ), On trending assets like Nas 100, a break above the downward sloping trendline should be anticipated as well as this will signify buyers over powered sellers and aims to drive price higher.
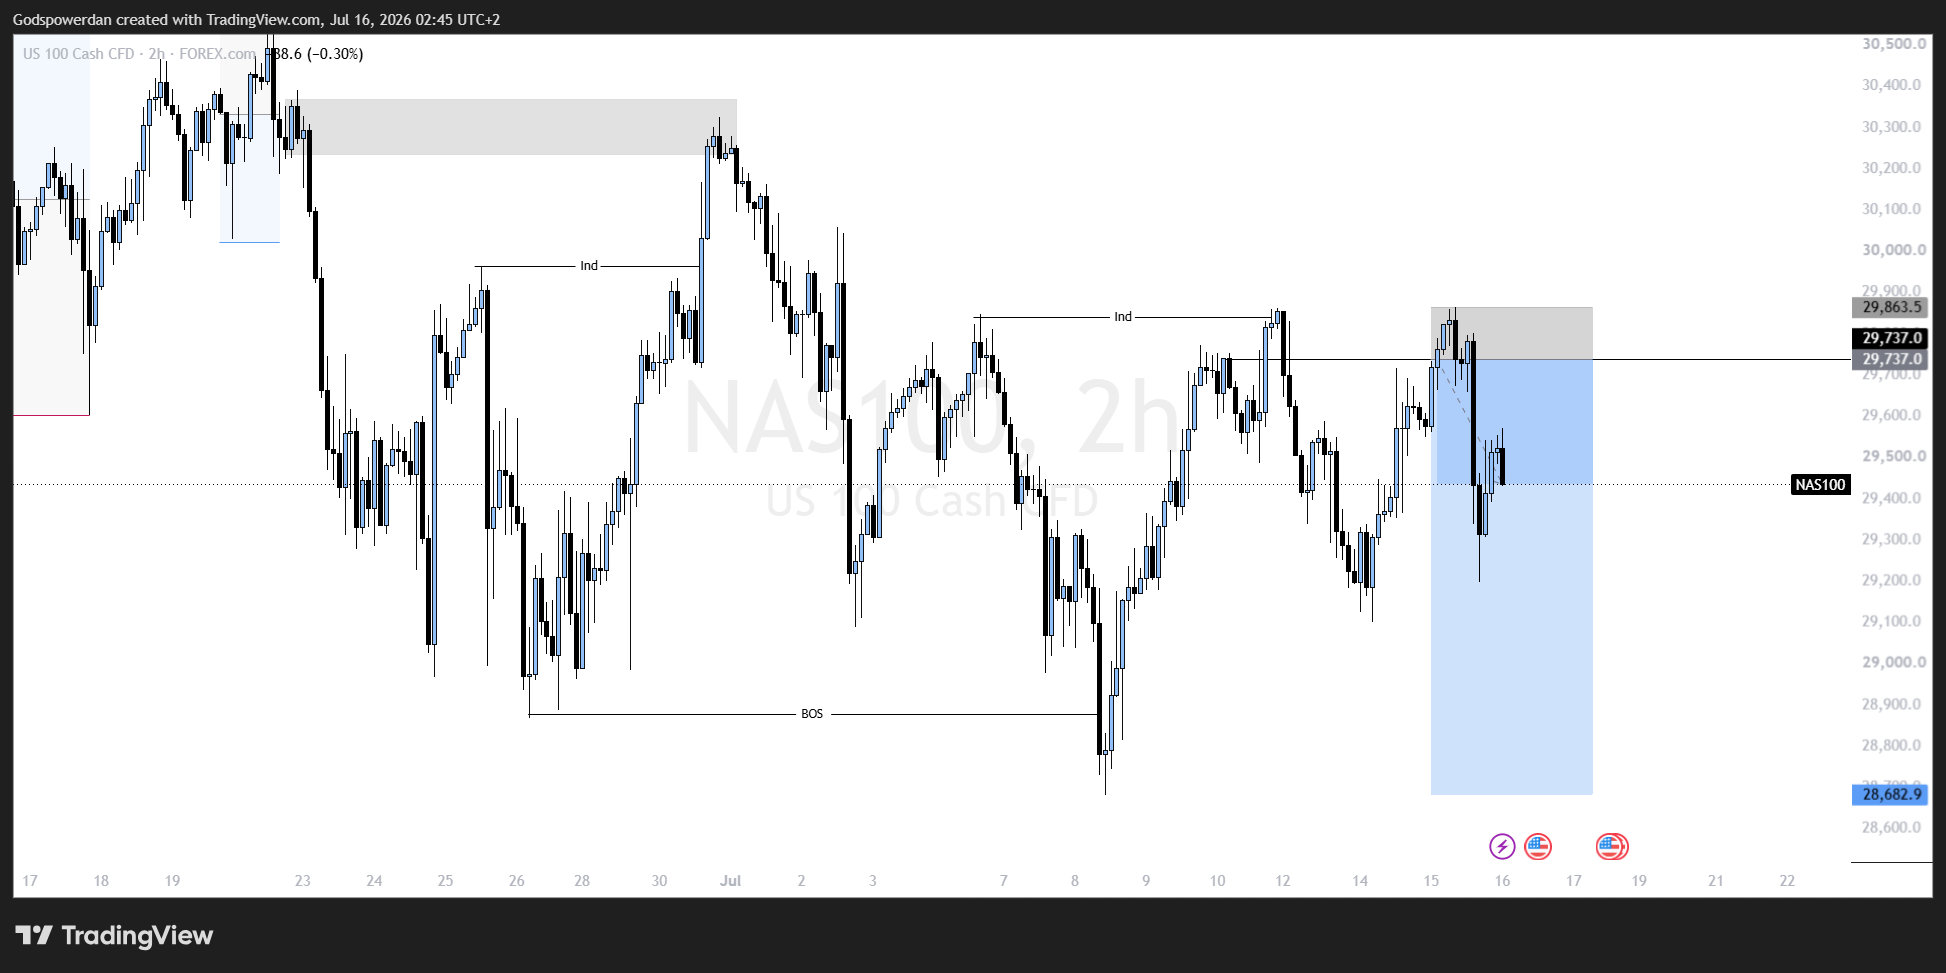
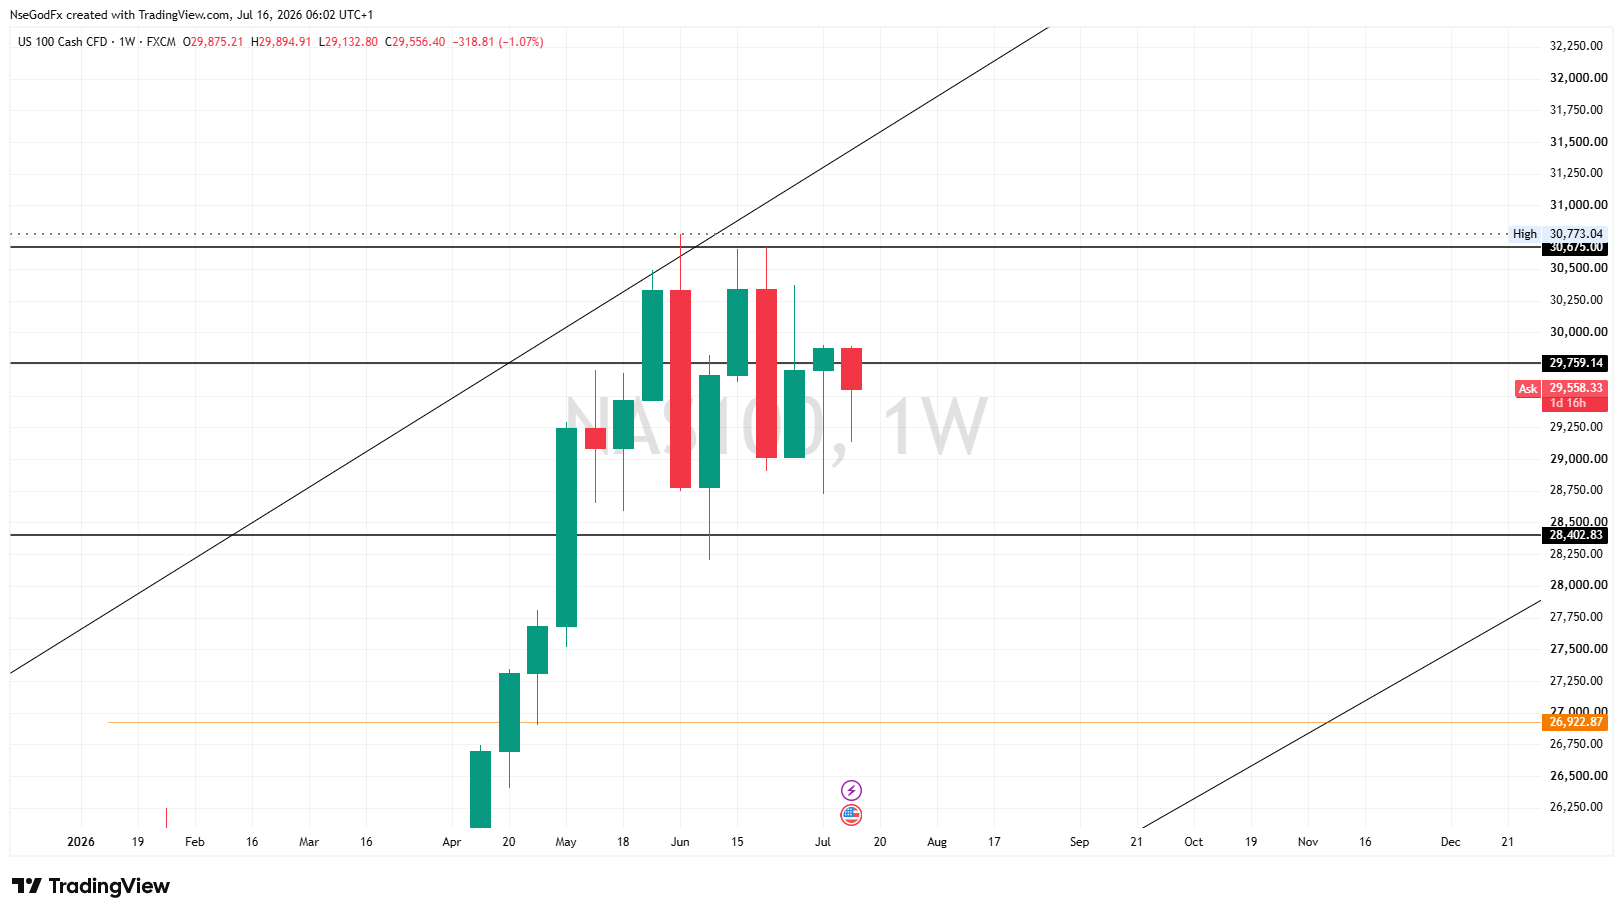
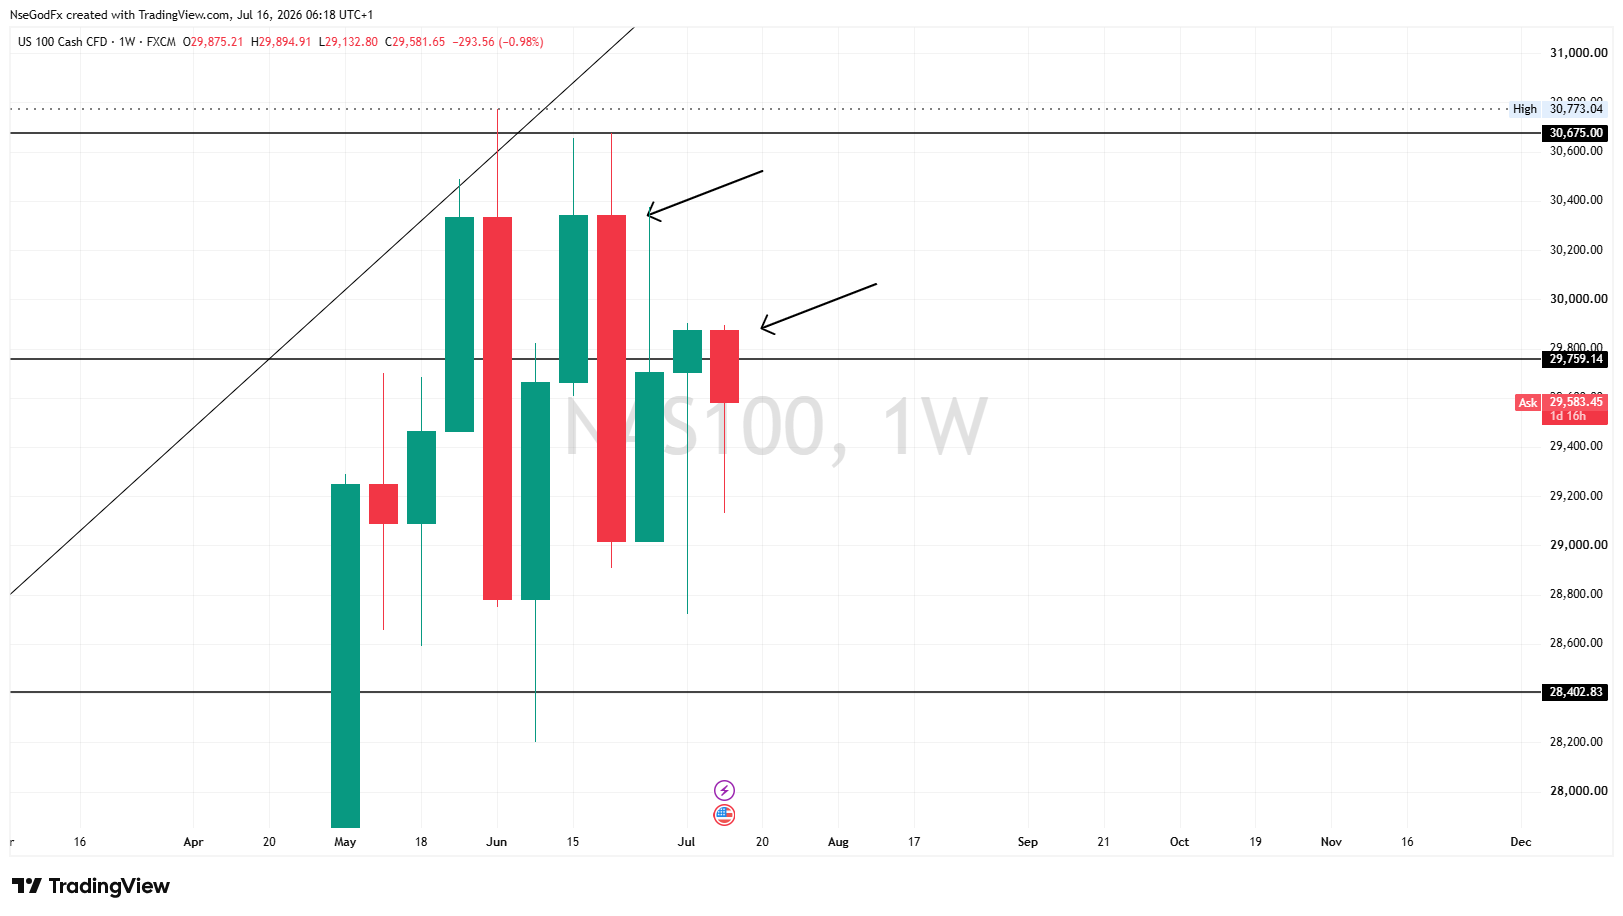
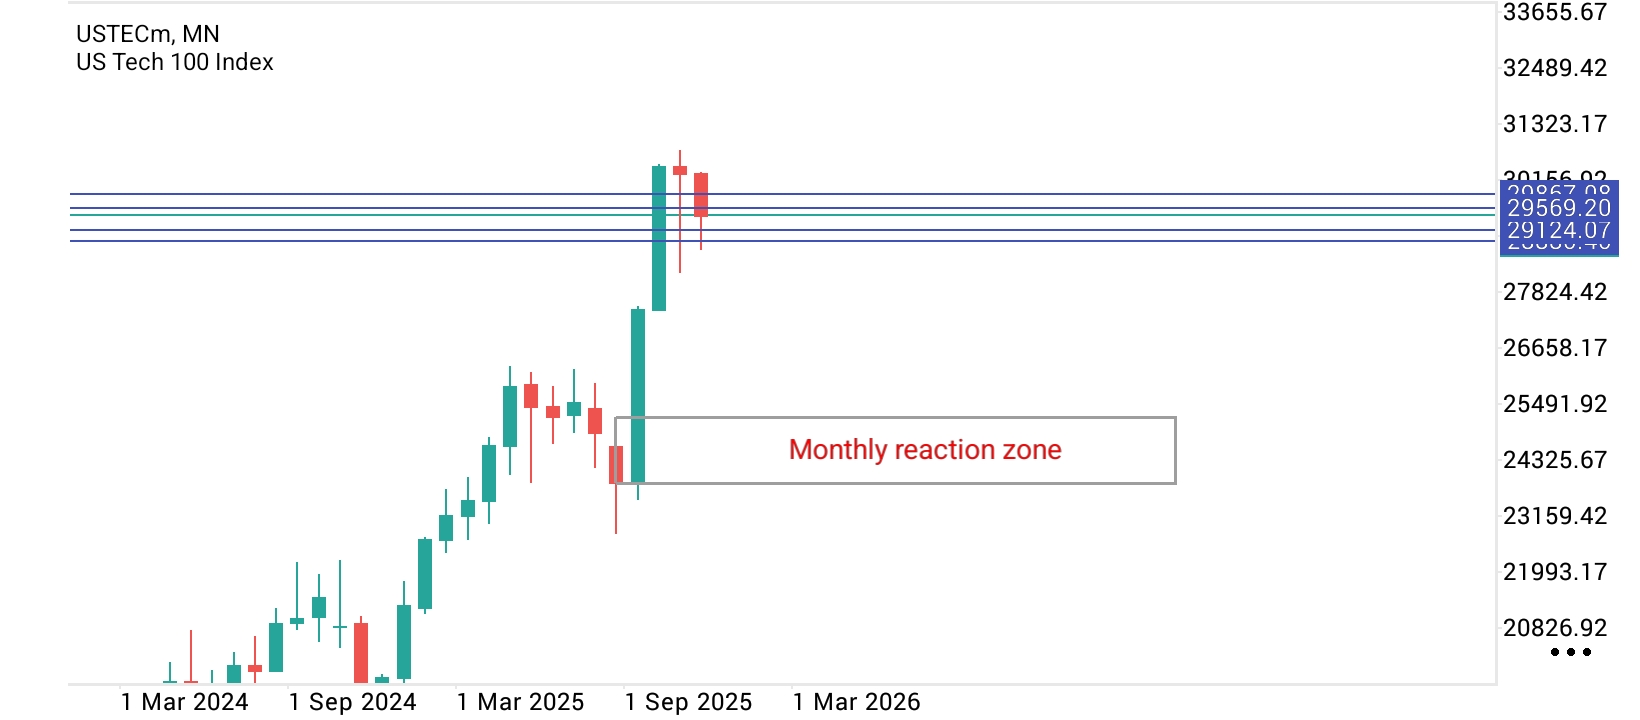
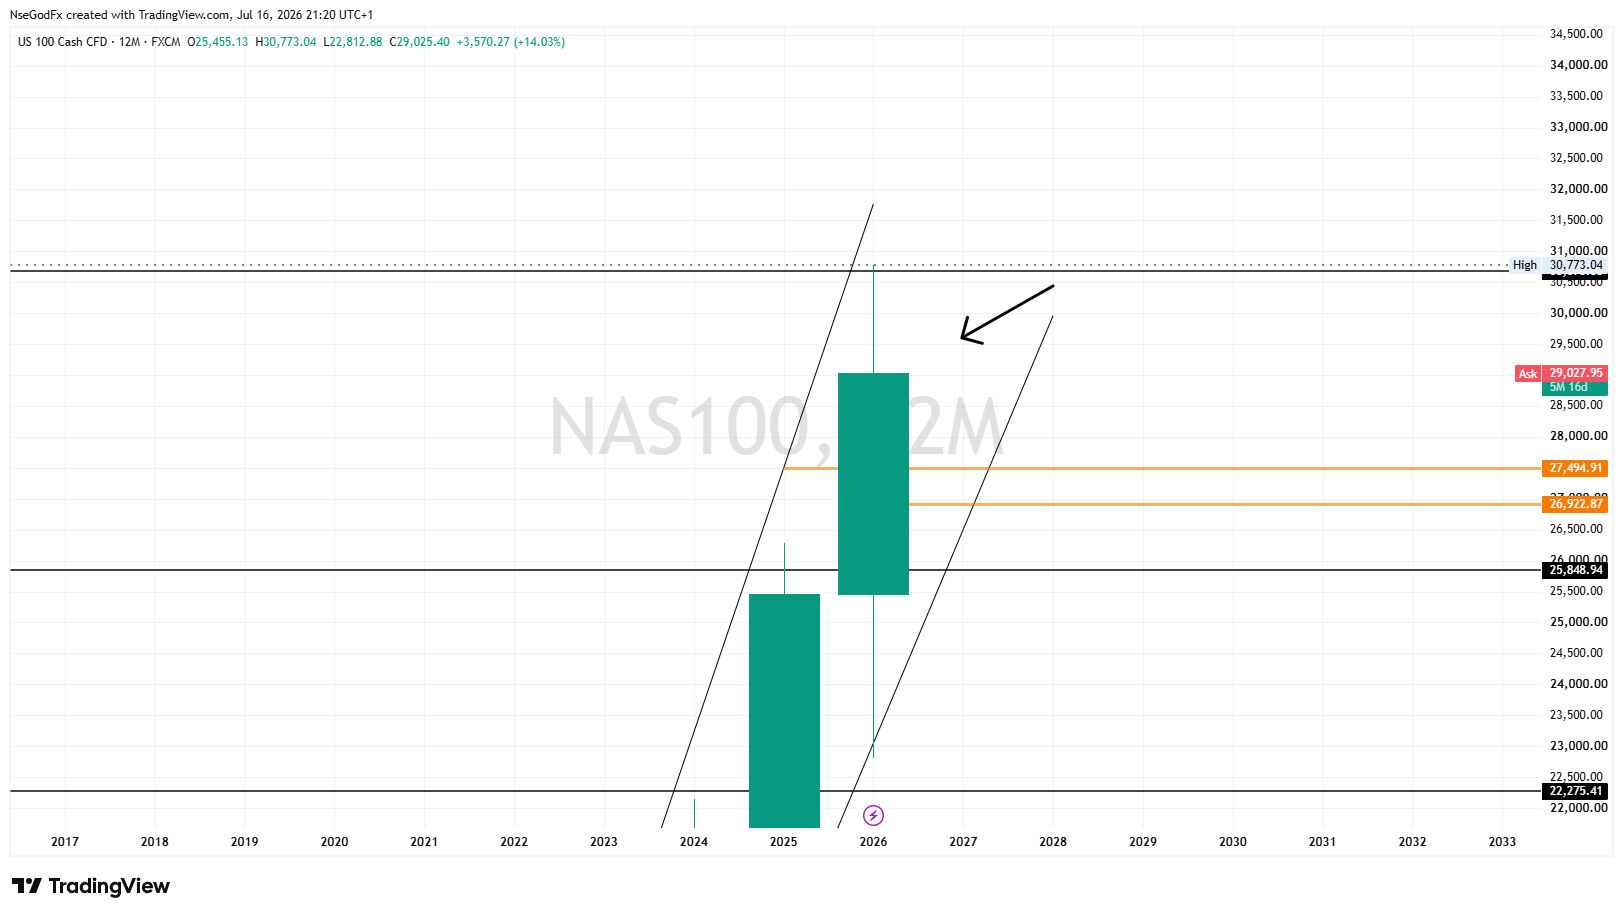
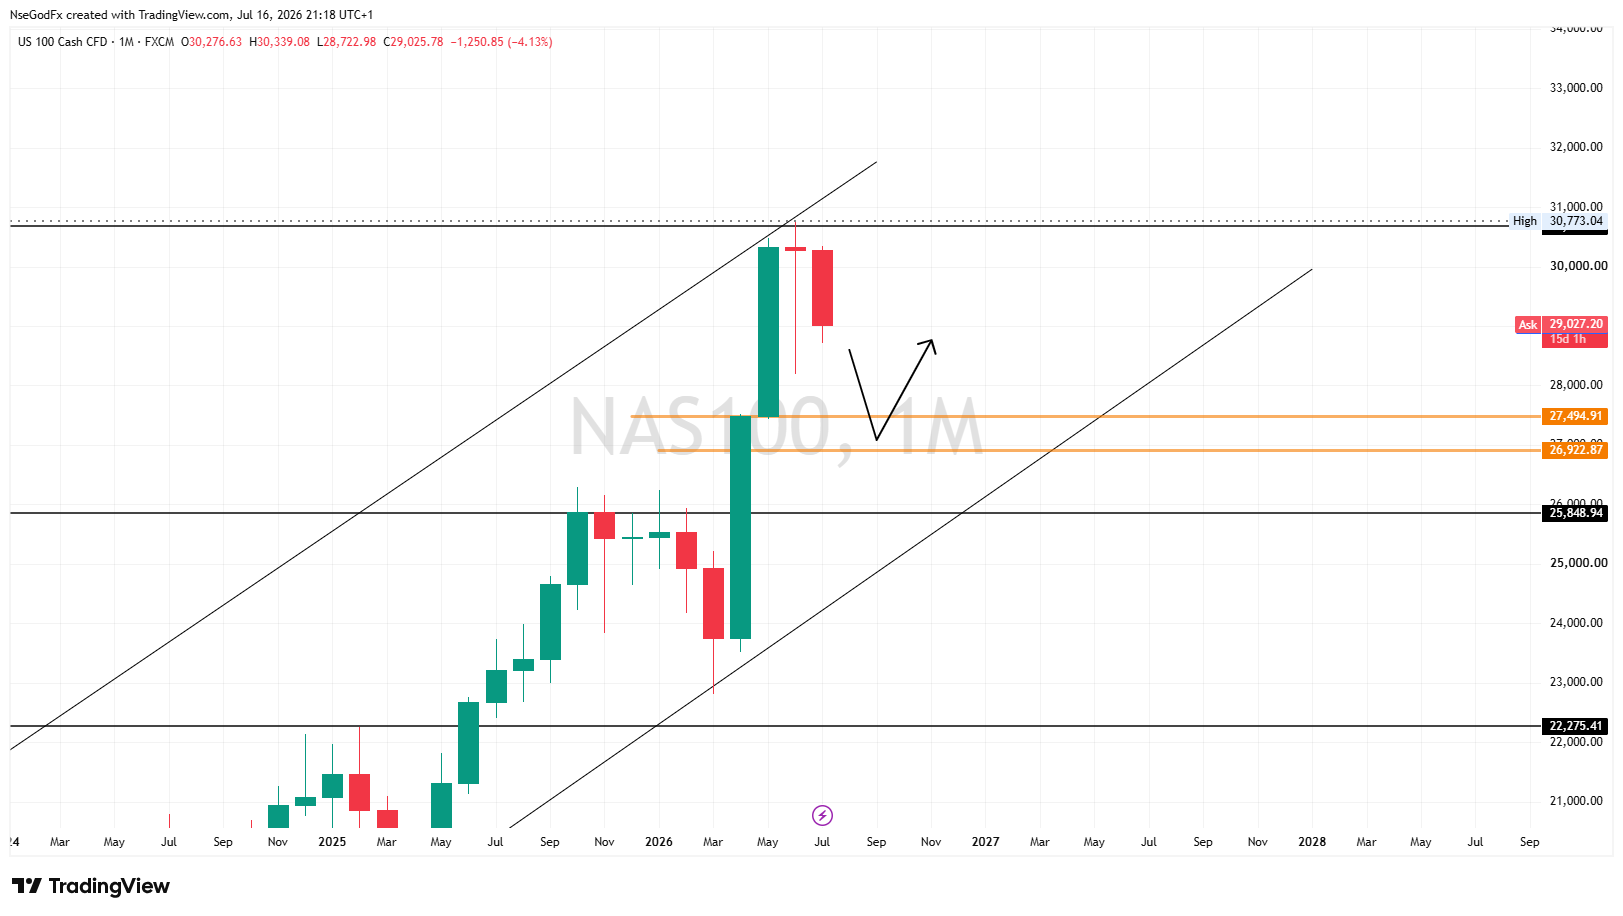
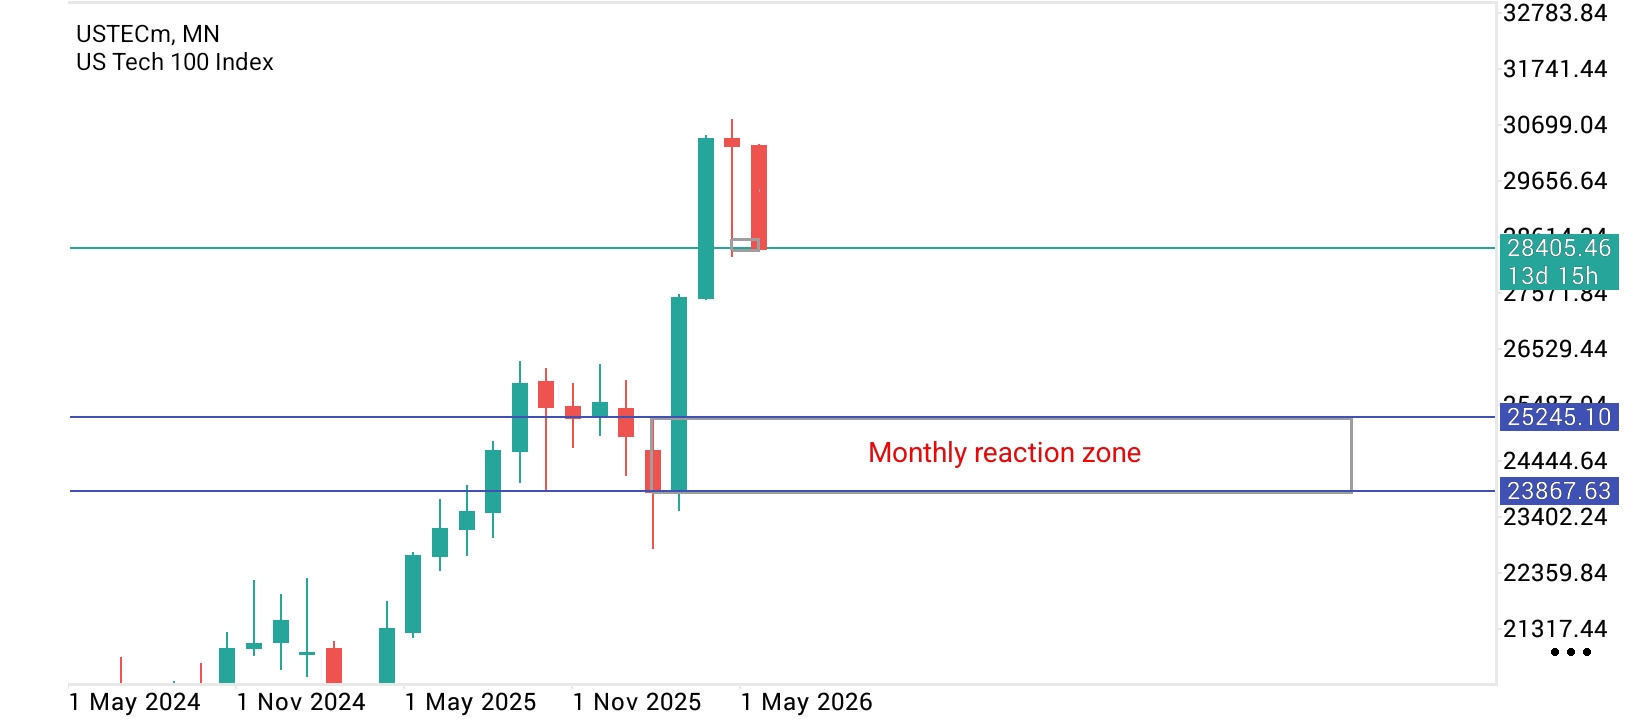
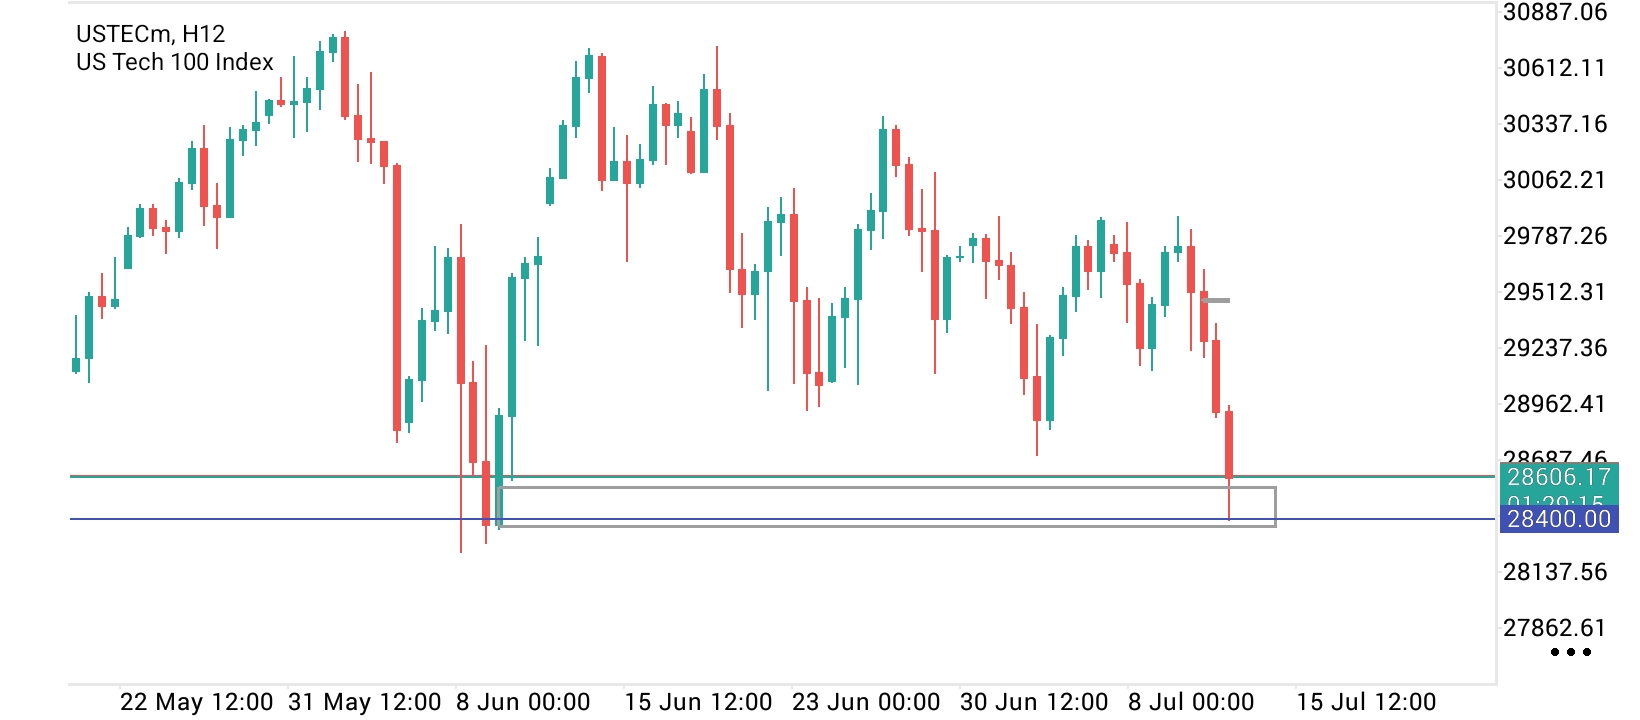
But since currently on Nas 100, the descending triangle is formed at a major resistance level, which confluences with a retest of an invalidated trend support and a bearish candlesticks pattern on Daily and weekly, this becomes an added confluence that the bearish pressure is becoming intimidating for buyers.