NASDAQ weekly Projections

A
@asuquokelvin - 1 month ago
Quoted - godspowerdan

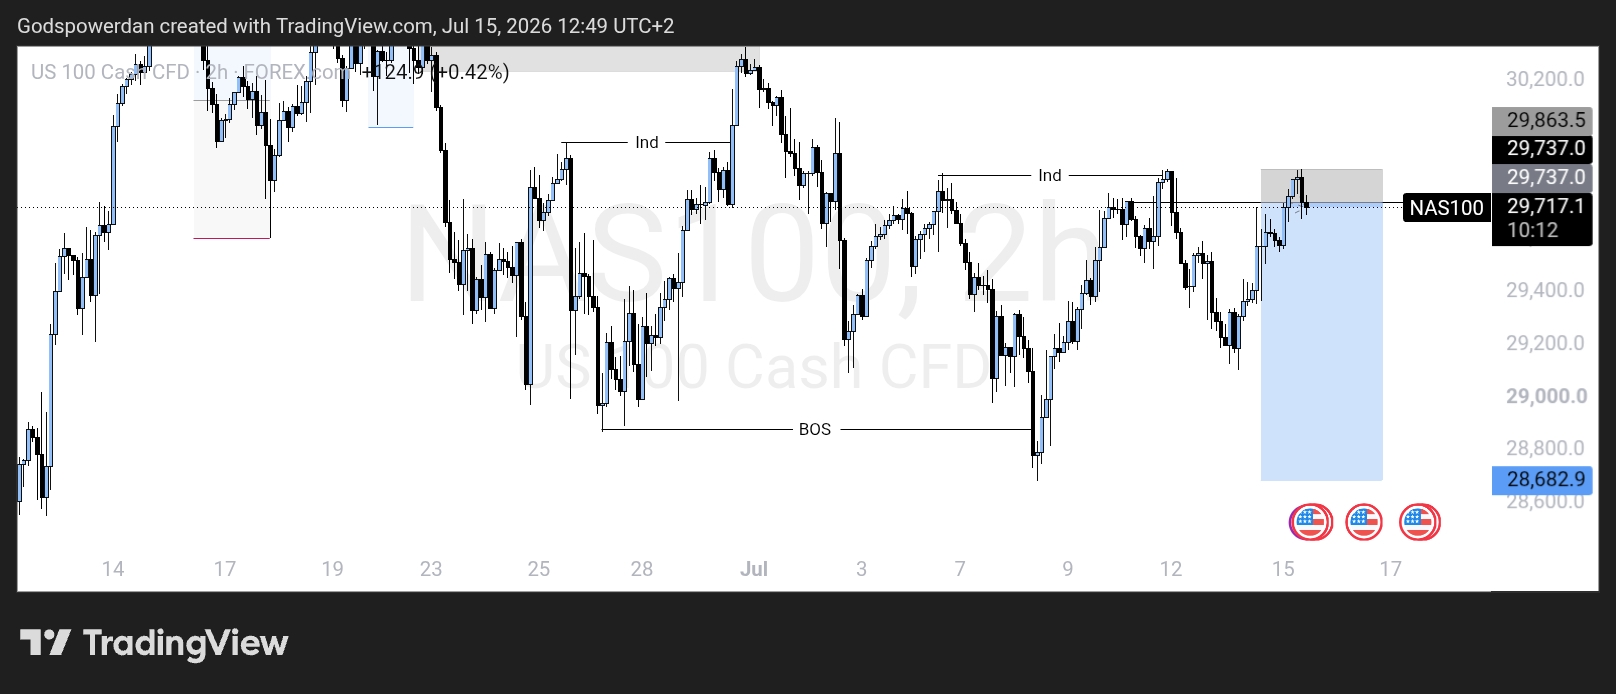
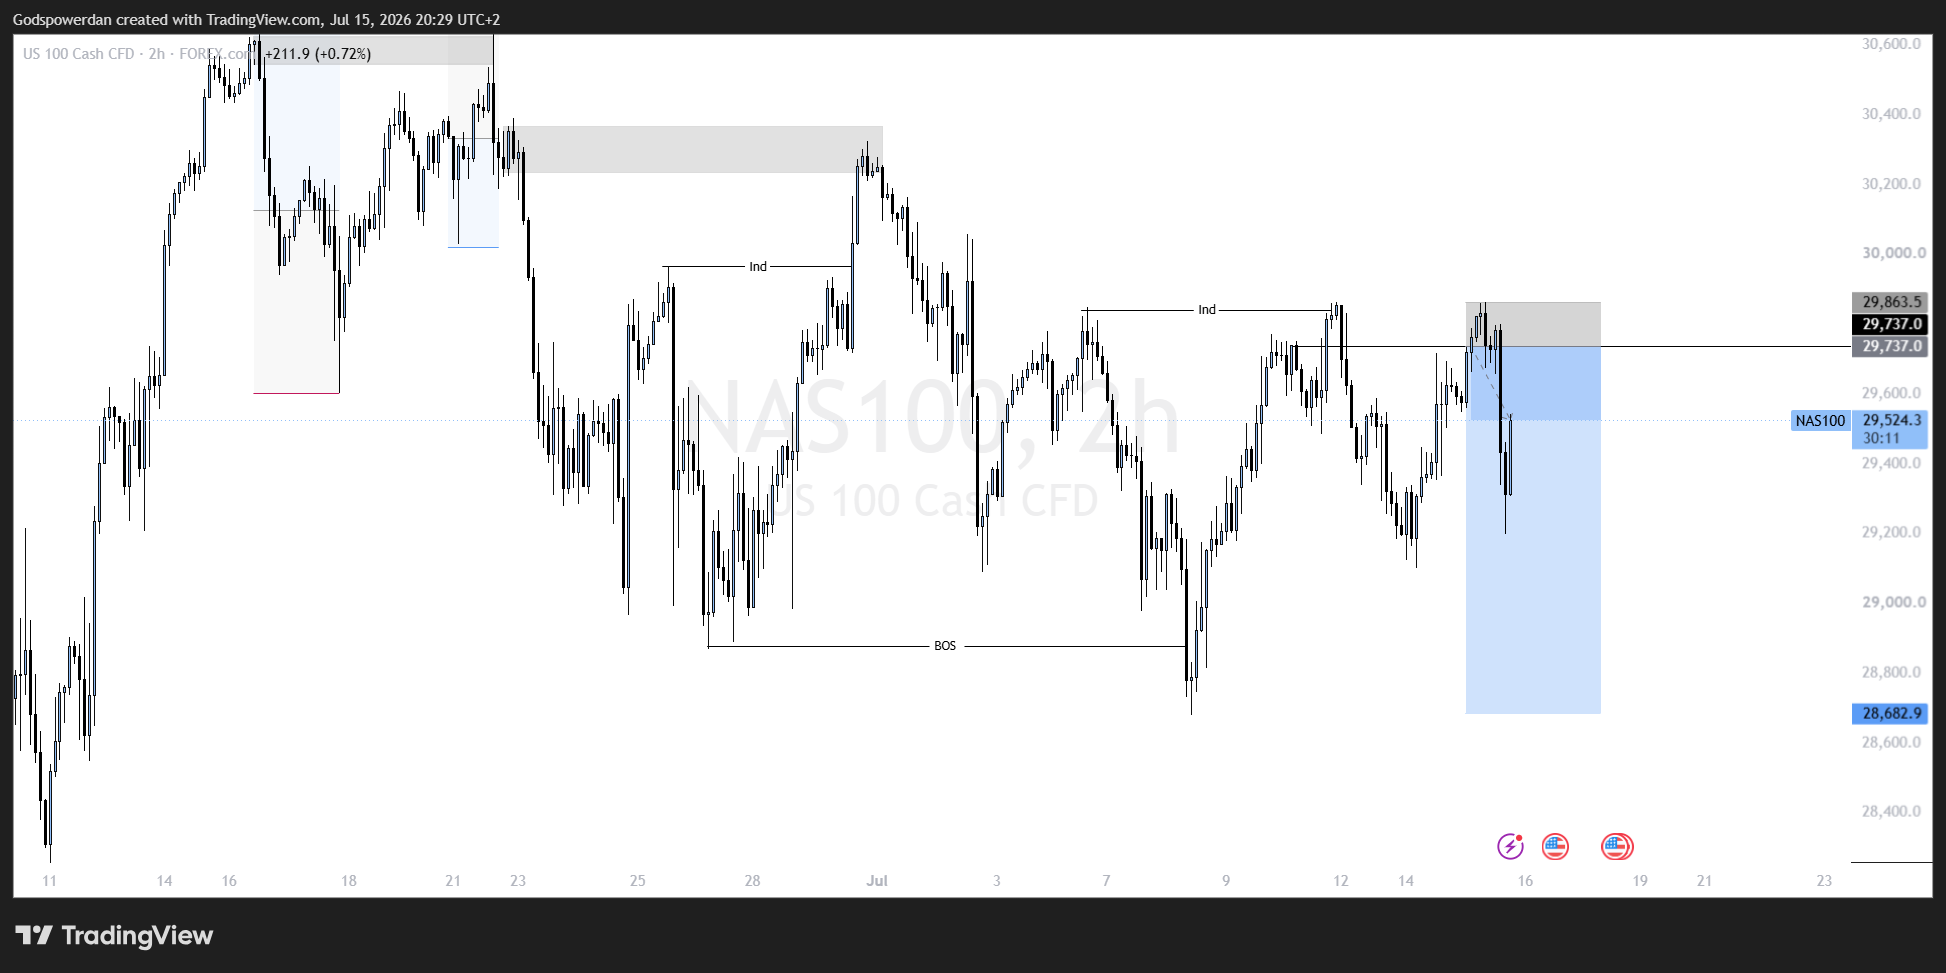
Price has finally triggered and my sl was almost hit. That was close

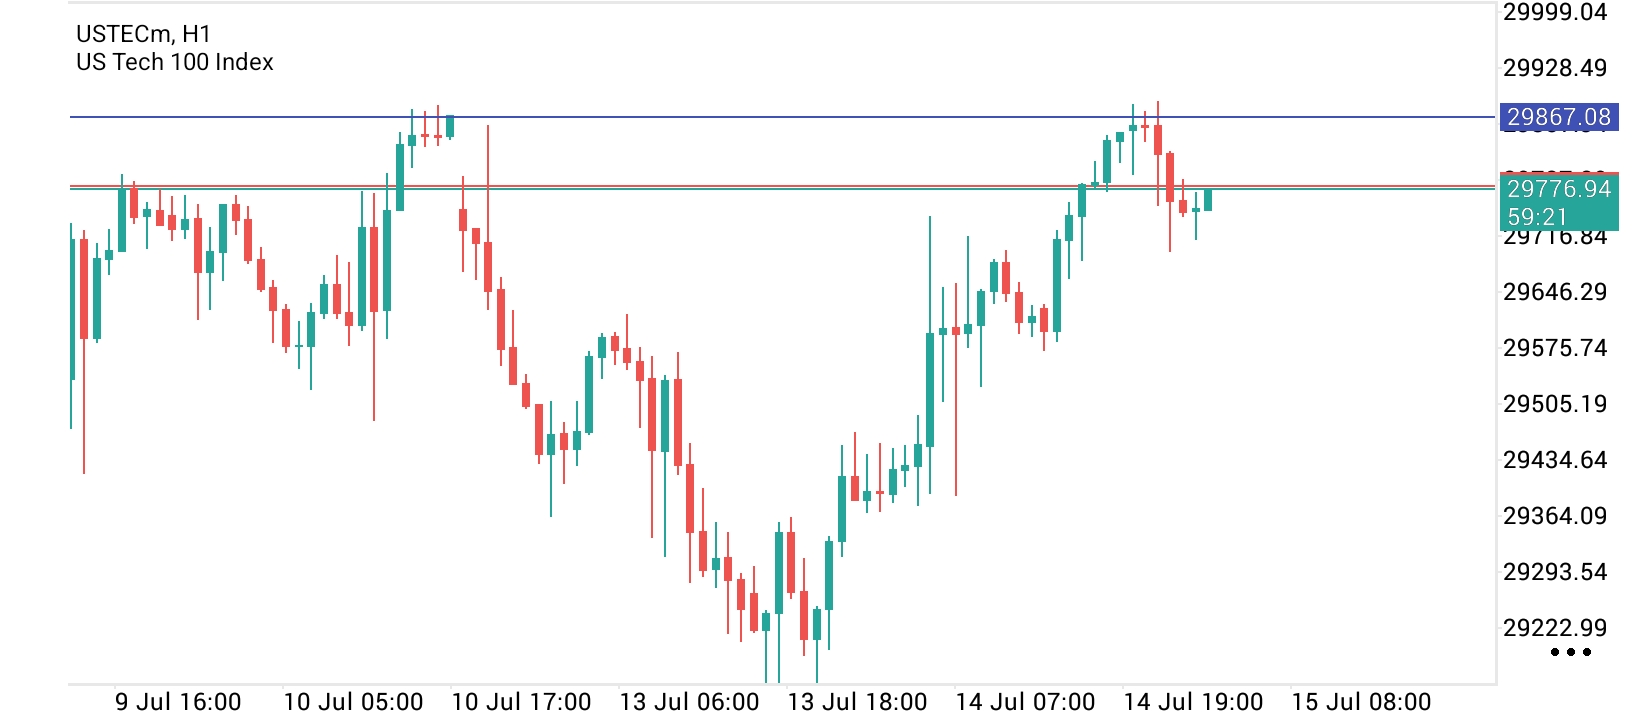
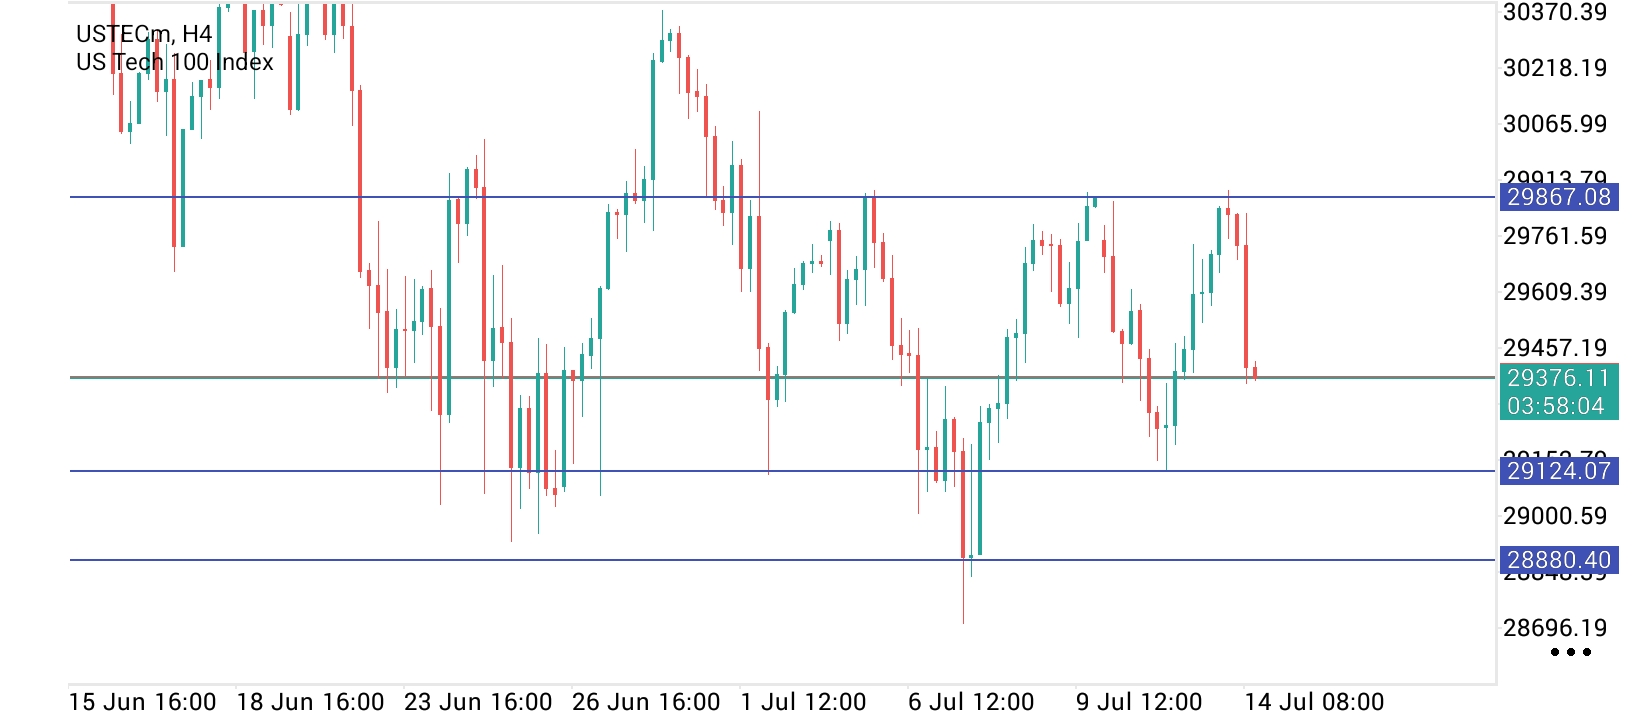
This is the reason why I said don't trust a local support or resistance to just put your entry base on confirmation, you have your confirmation wait for reactions let you entry level not be a reaction zone, it drains psychologically, price still reacting from that level, not even sure of the zone if price will break up or it will continue down and it reduces confidence, Nas100 may break above 2986.08 although it is still going up and down

A
@asuquokelvin - 1 month ago
Quoted - godspowerdan

Price is just messing with my mind right now.

But I'll hold it regardless

Just hold with BE, if you get stopped out, just wait for another setup I mean a confirmed setup don't rush at all

N
@nsg_usd - 1 month ago

NASDAQ- Daily Analysis Update

BIAS: Bearish

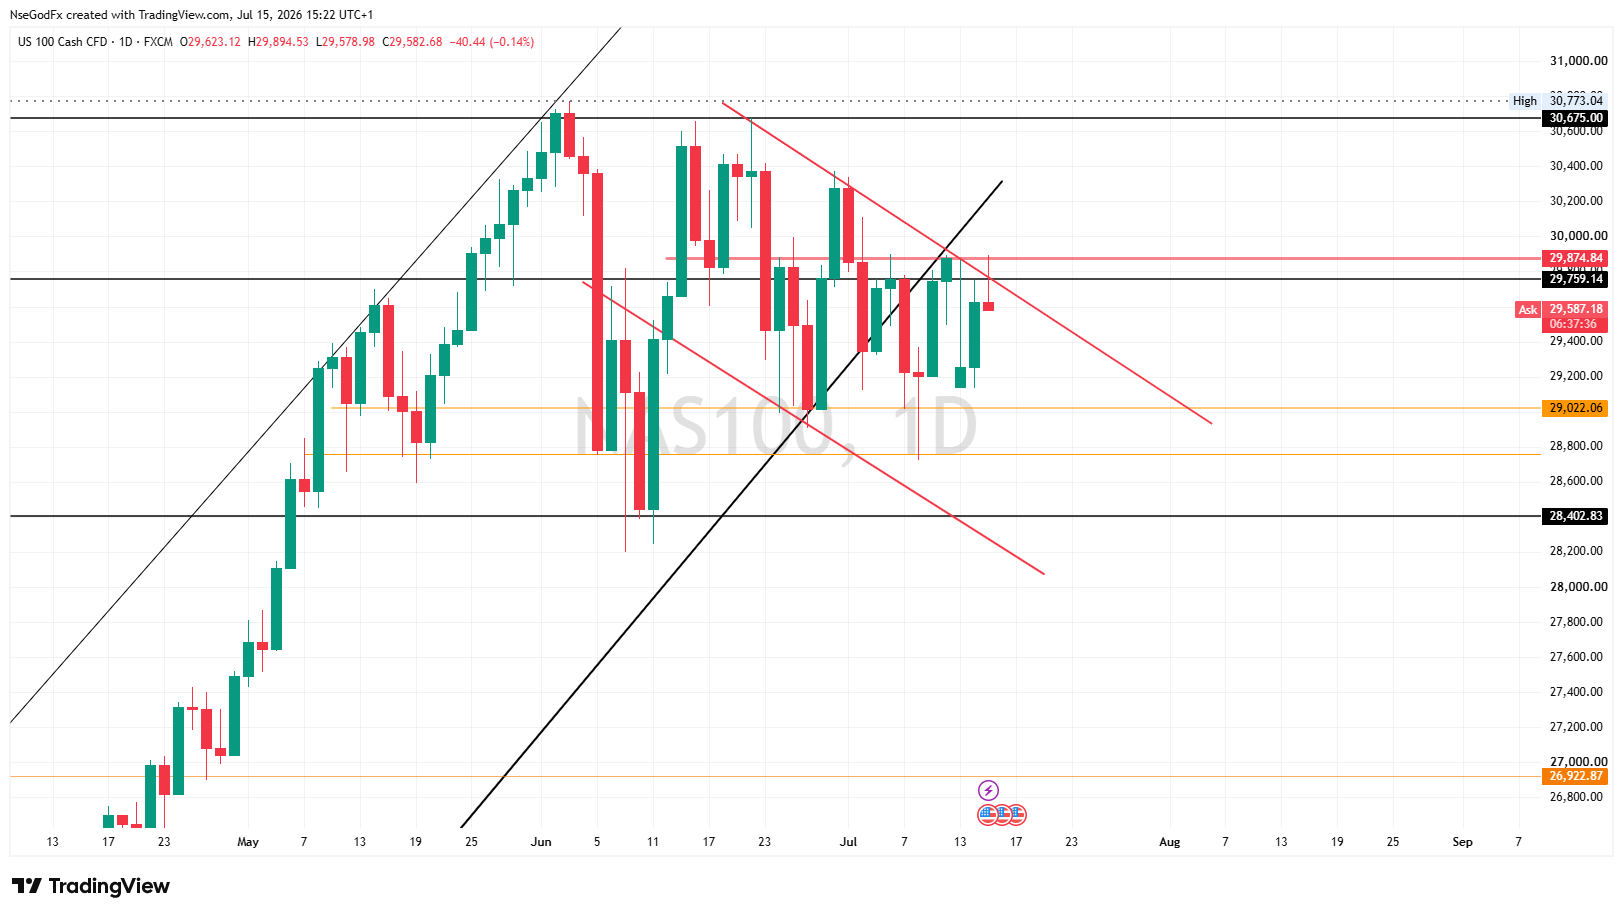
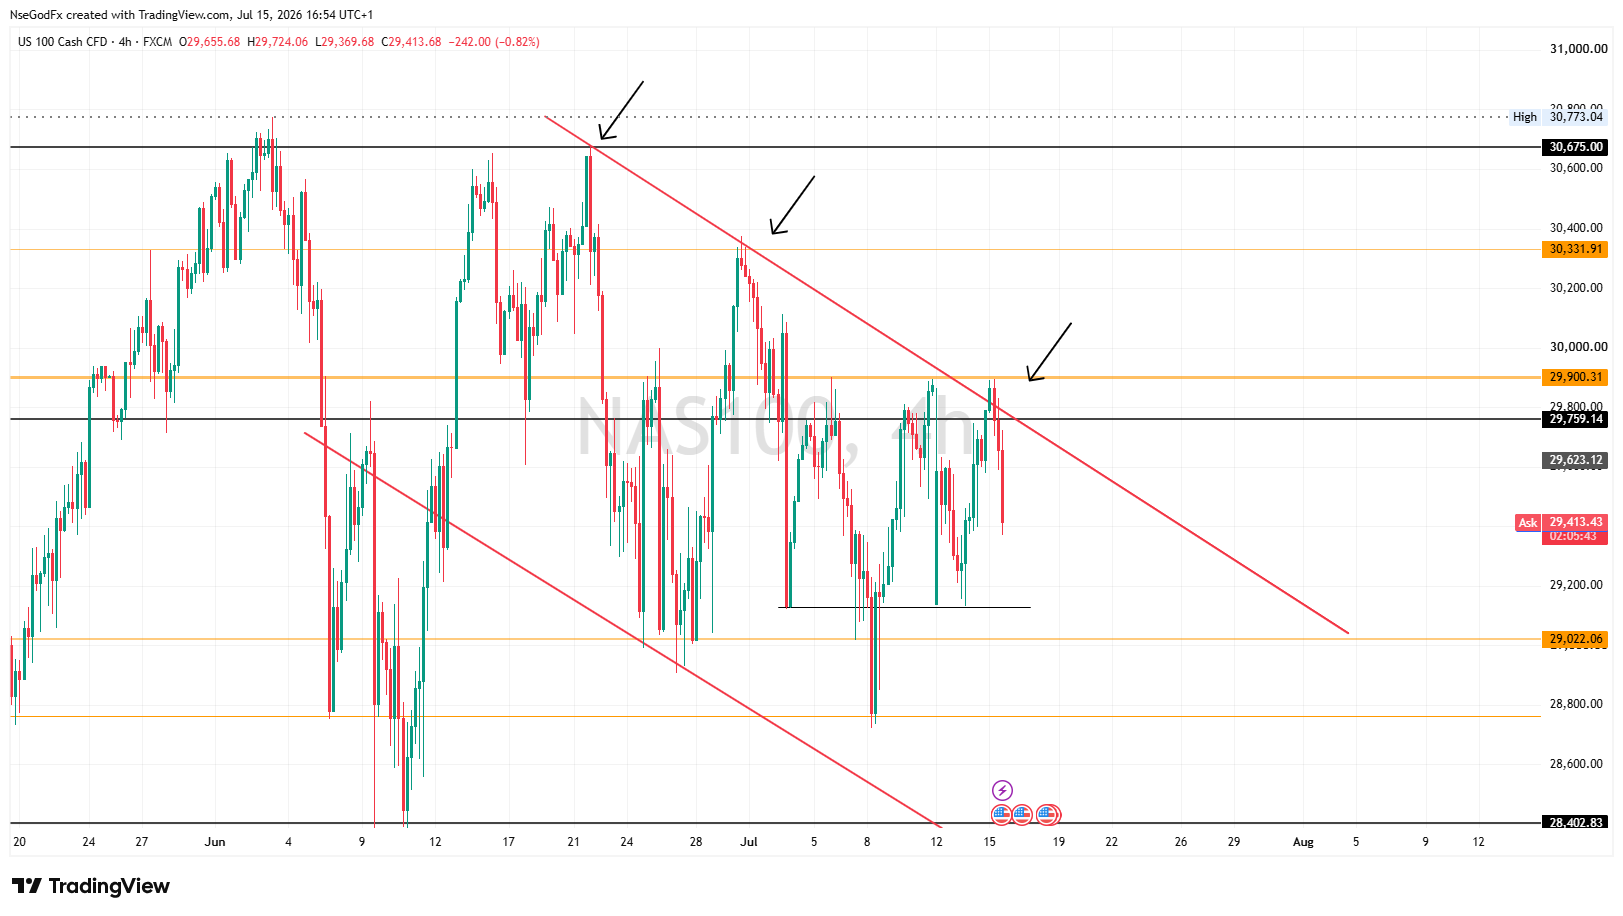
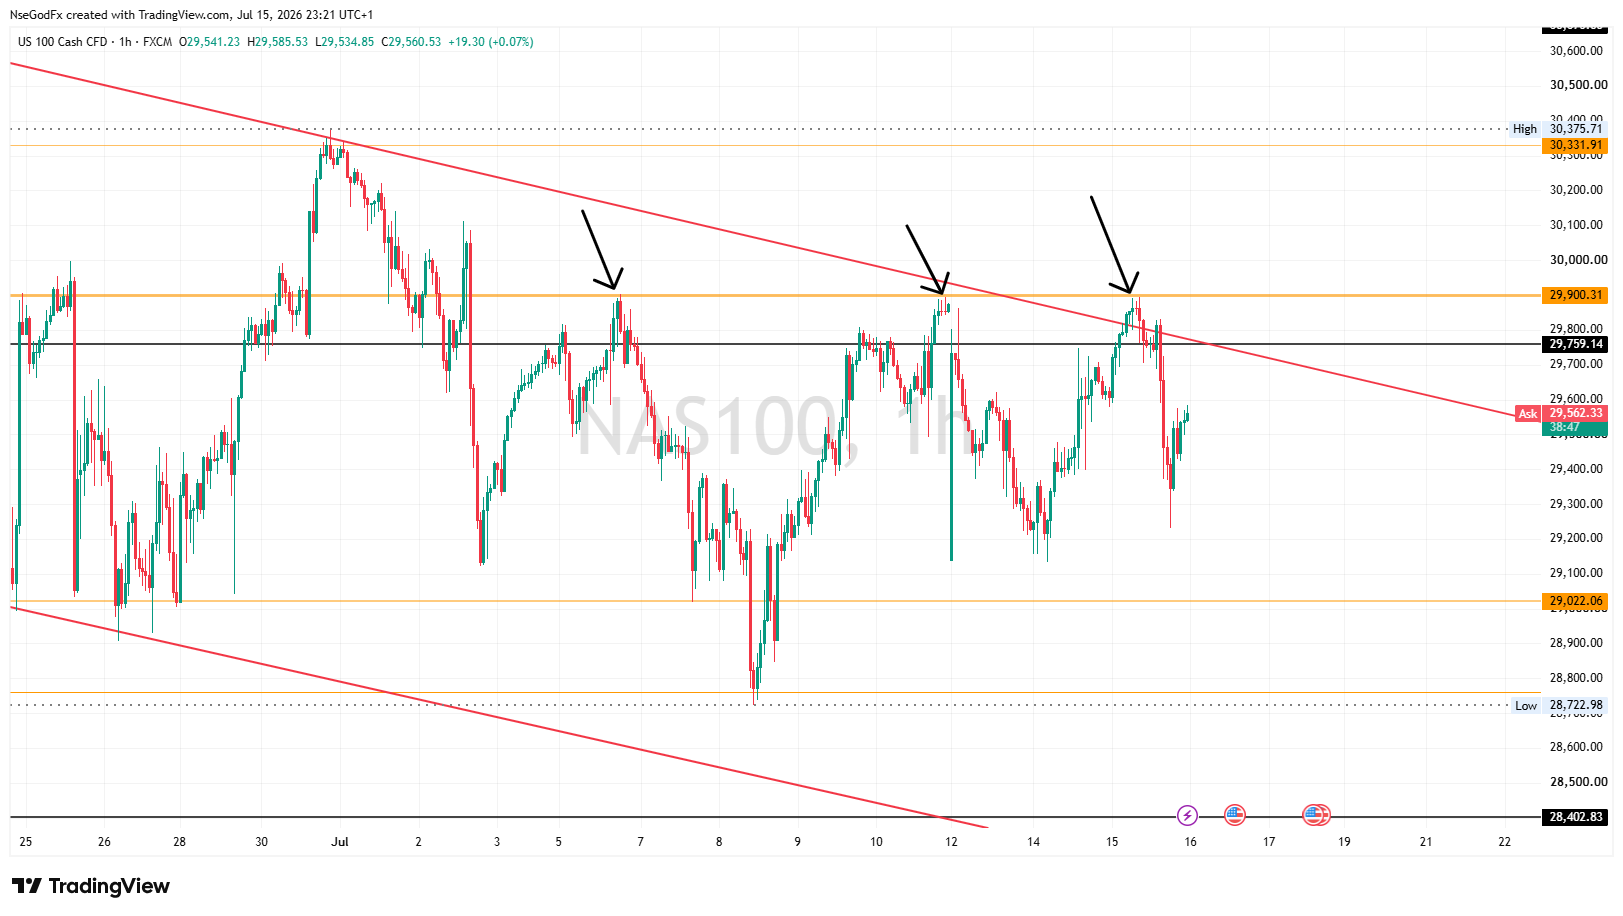
On the daily, Price revisited the Resistance level at 29875-29750, and rejected sharply signifying the bears are still actively present at the resistance zone, and the daily trendline is still very valid.

N
@nsg_usd - 1 month ago
Quoted - godspowerdan

Price has finally triggered and my sl was almost hit. That was close

Nice. How's the sells going? Price respected the Trendline which confluences with the key resistance level at 29900.

A
@asuquokelvin - 1 month ago
Quoted - nsg_usd

Nas 100-With a bearish candle close on the daily today, expect sell continuations tomorrow.

It is very clear that nas100 is ranging it goes from resistance to support and from support to resistance

N
@nsg_usd - 1 month ago

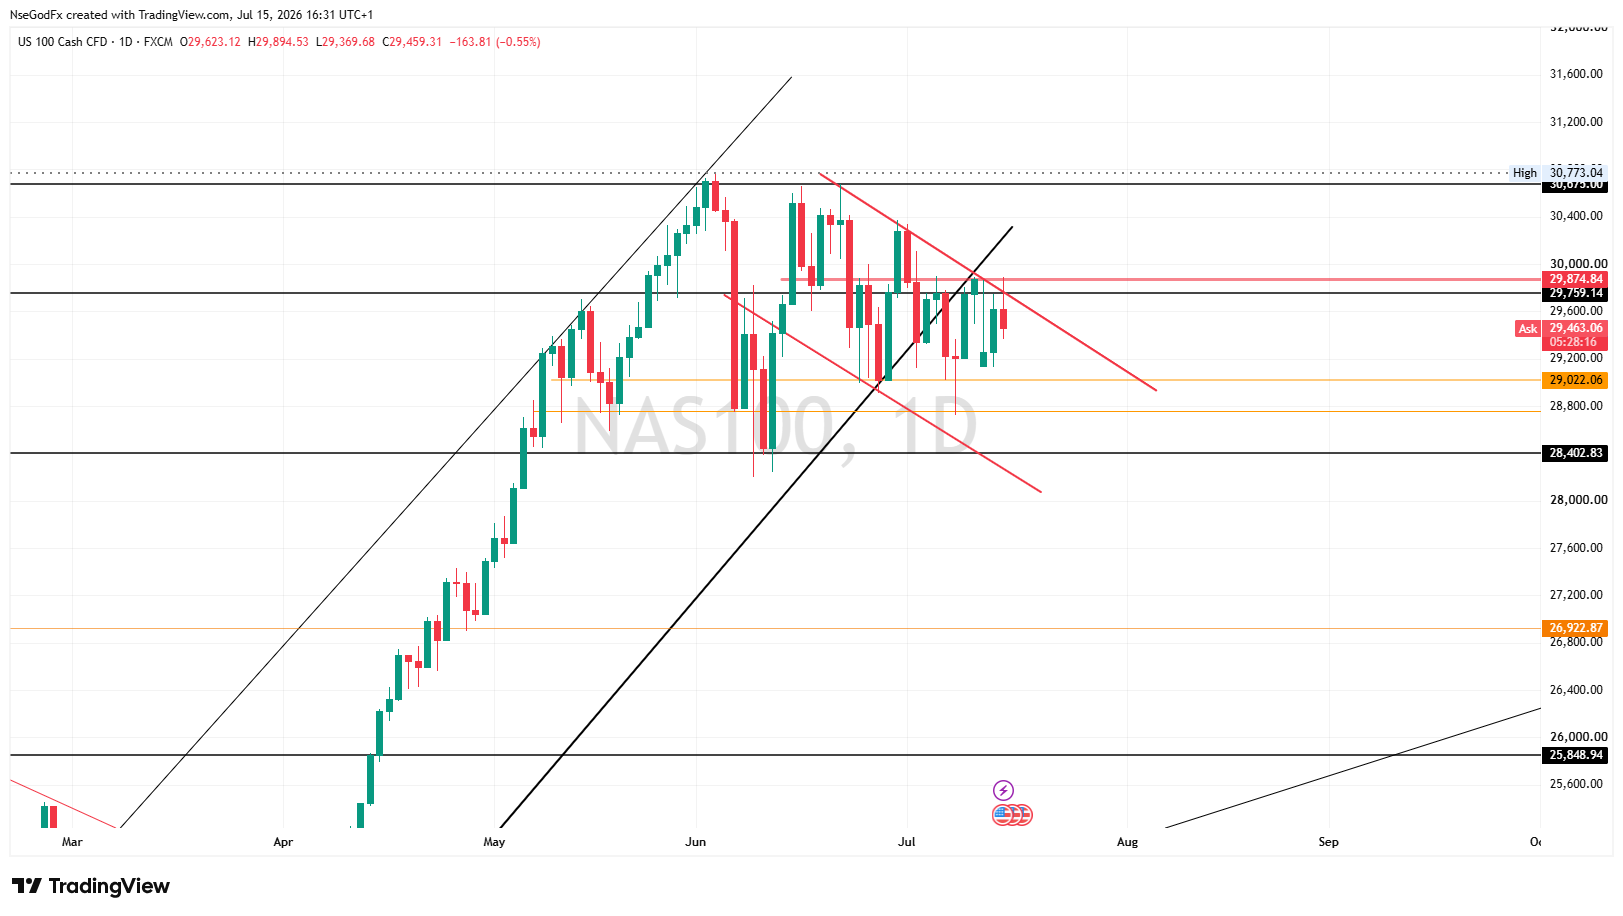
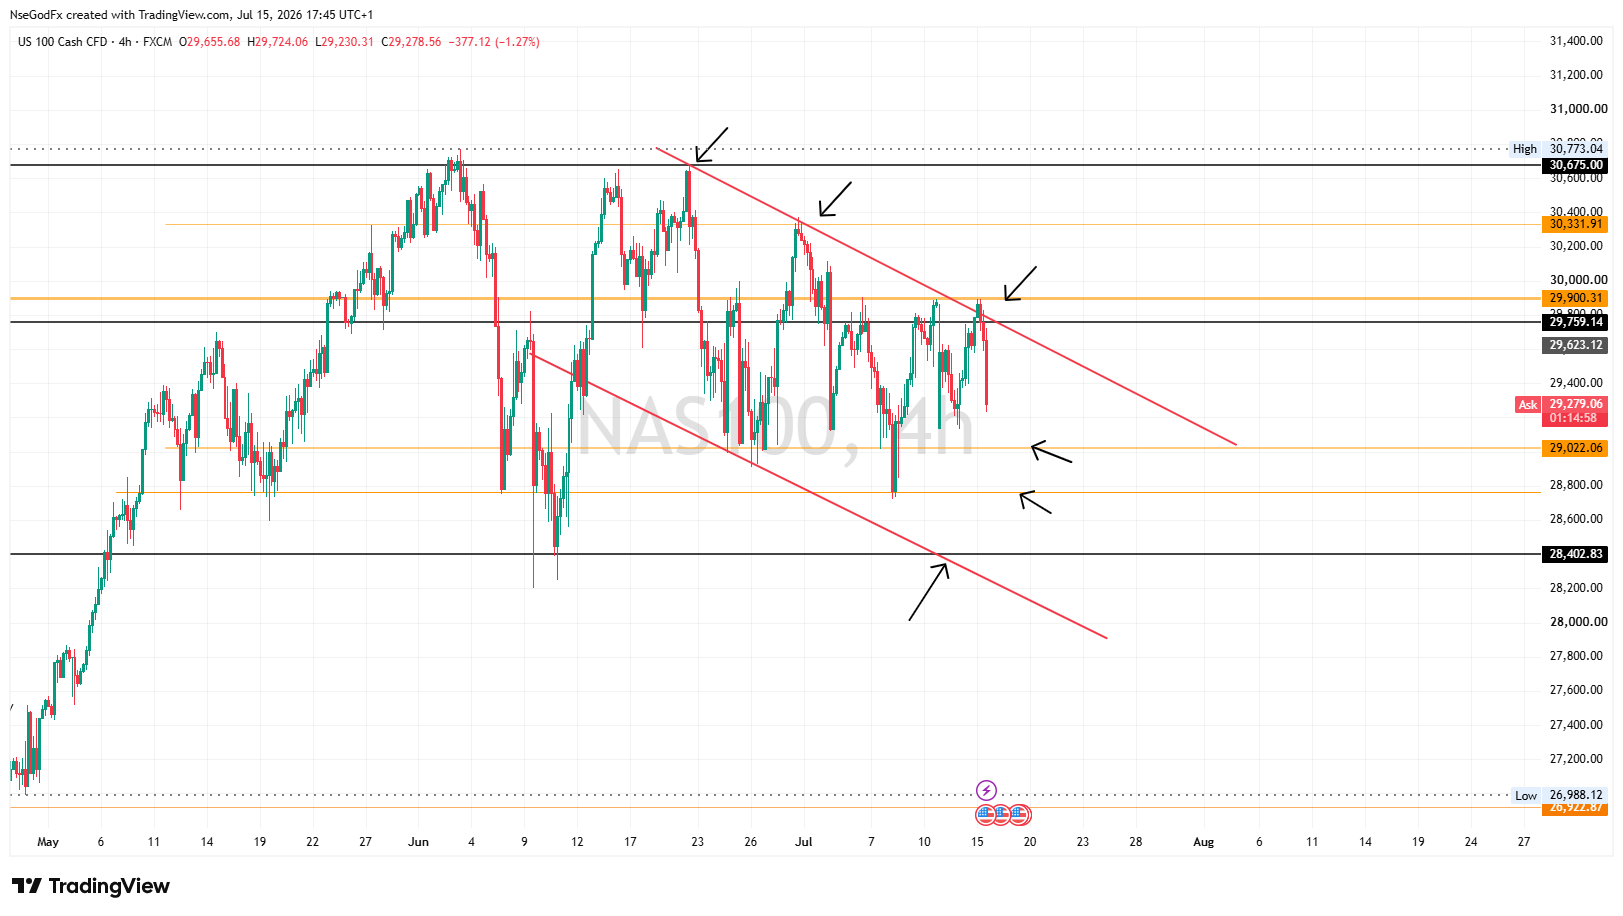
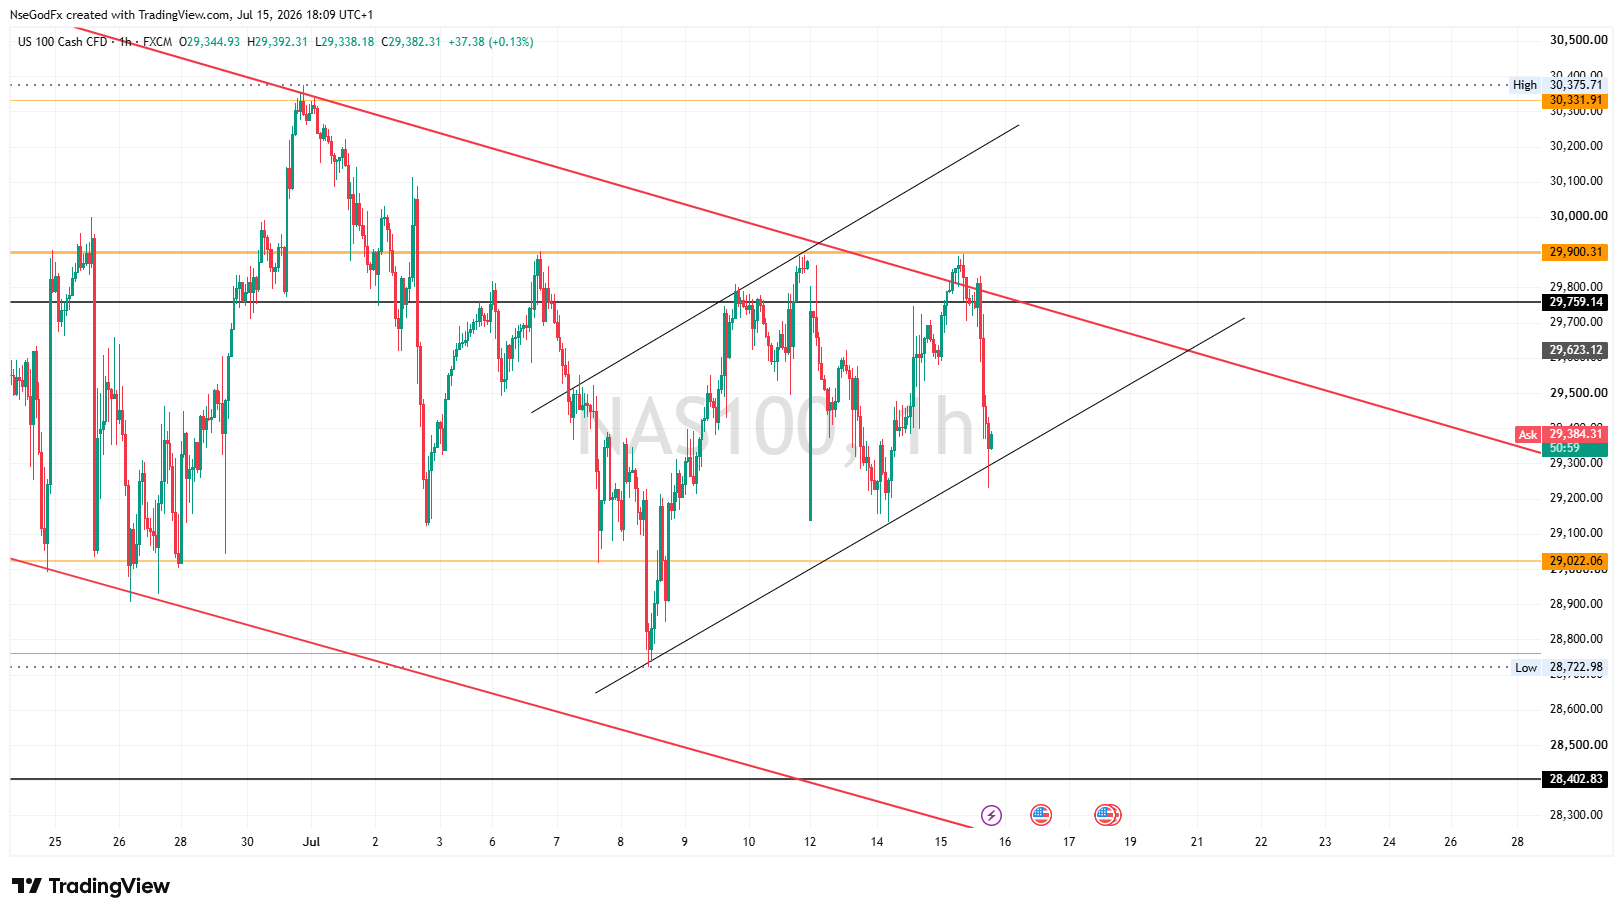
NAS 100 4hr- Expecting the heavy bearish decline to drop down to 28402, which confluences with lower boundaries of the Bearish channel but with minor bullish reactions at 29022, and 28800 internal support regions.

N
@nsg_usd - 1 month ago

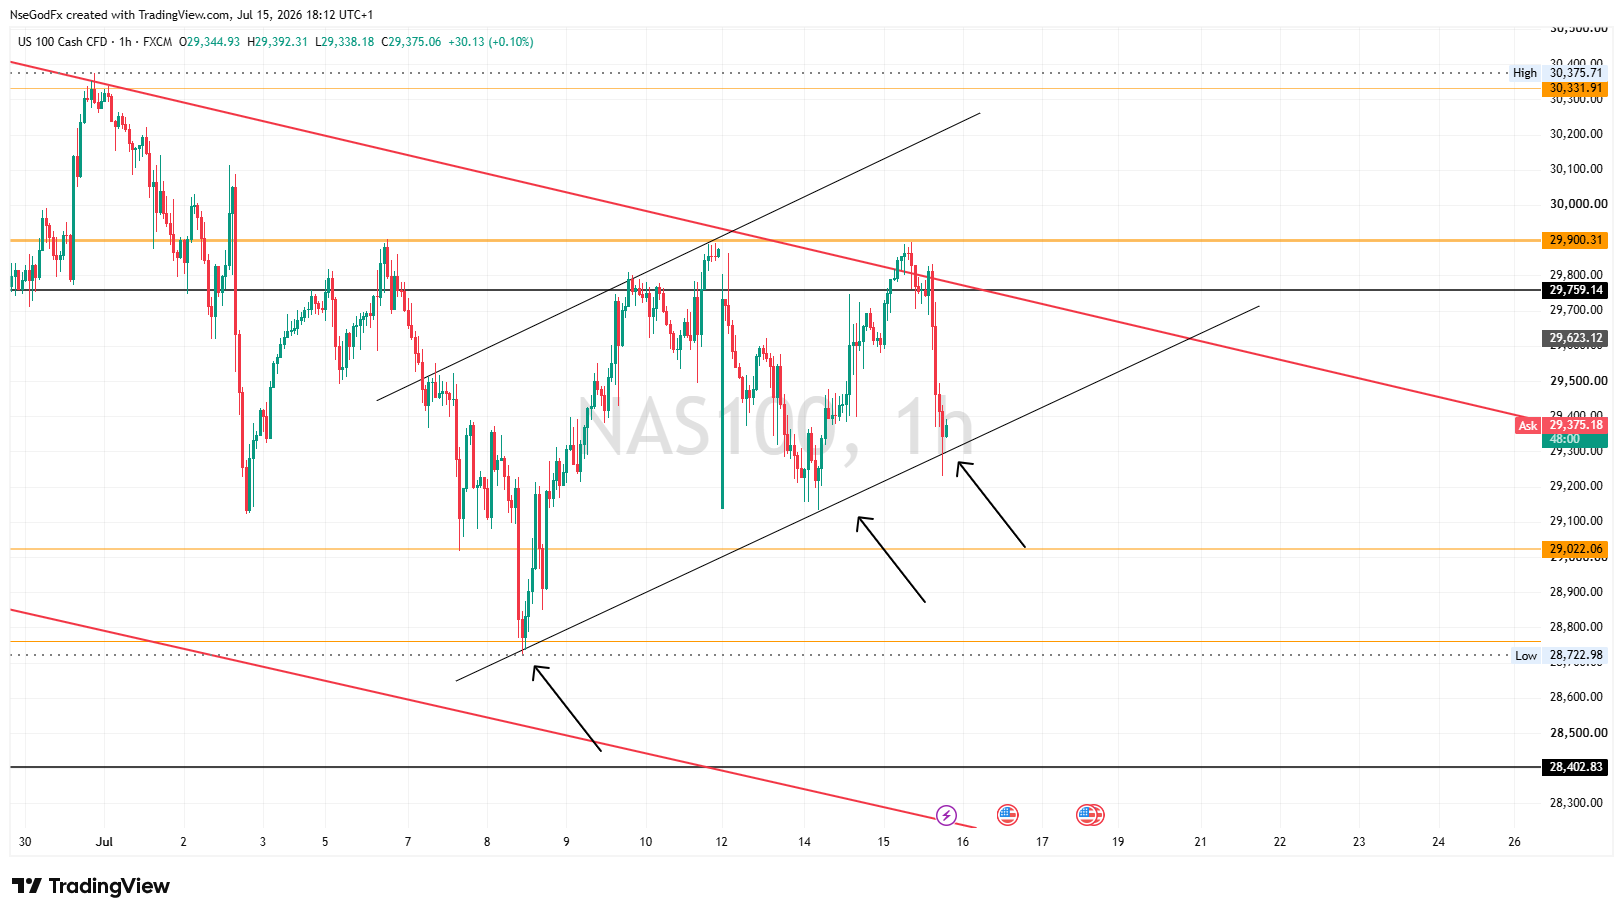
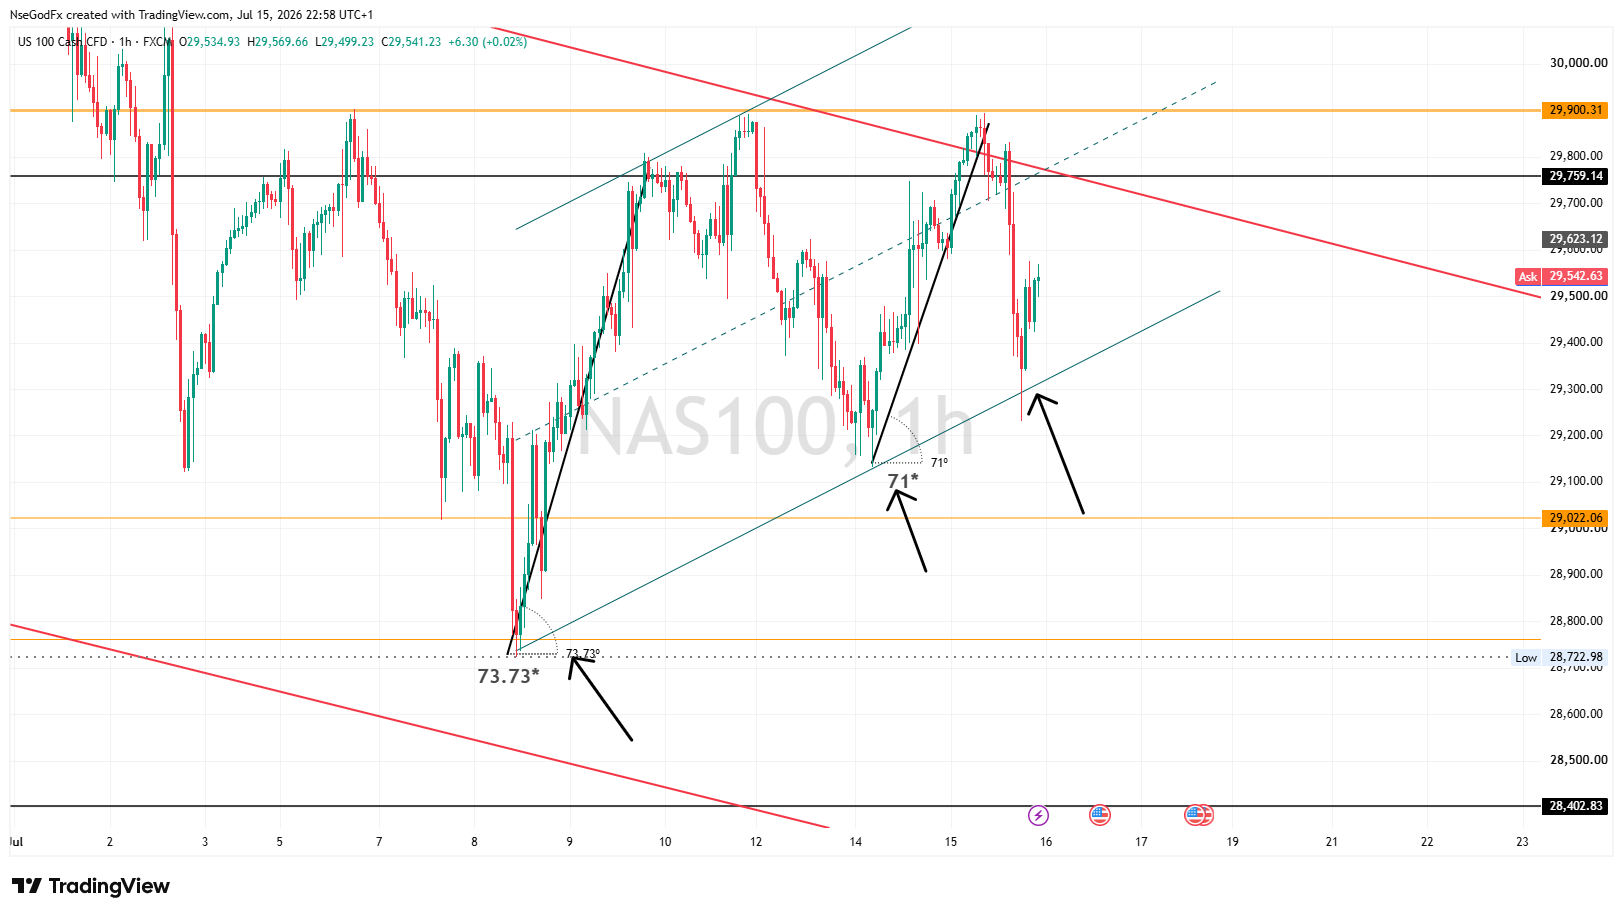
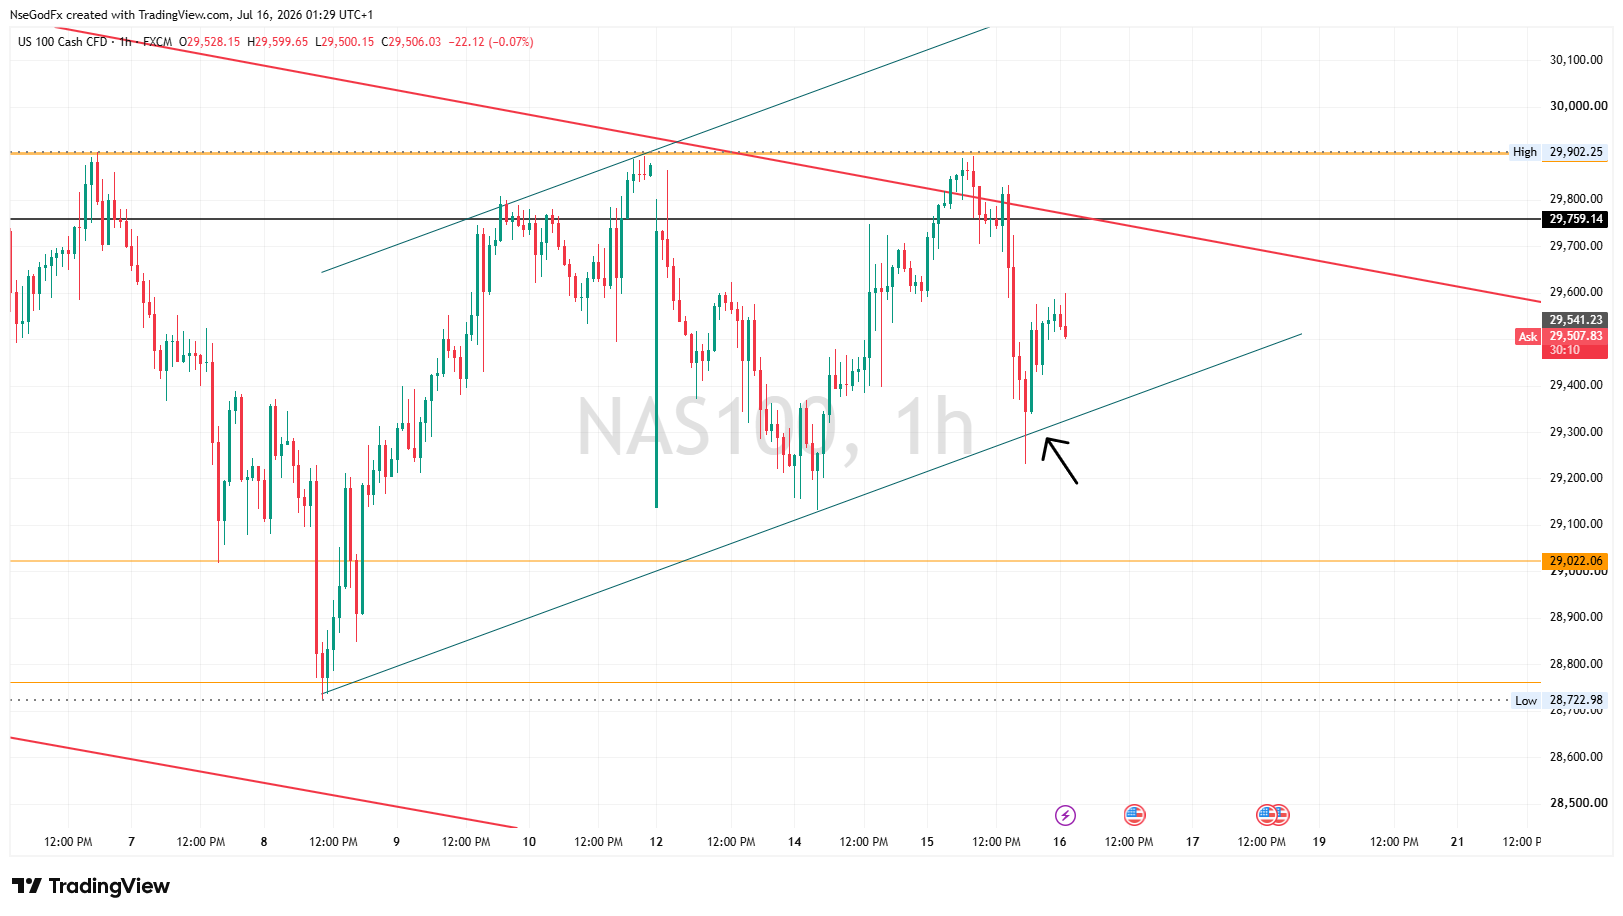
Nas 100- there's a 1hr internal trend support that can challenge the bearish decline of Nas100 down to the next major support, as we see current price reactions on the lower boundaries of the 1hr trendline.

N
@nsg_usd - 1 month ago
Quoted - nsg_usd

Nas 100- there's a 1hr internal trend support that can challenge the bearish decline of Nas100 down to the next major support, as we see current price reactions on the lower boundaries of the 1hr trendline.

From my personal observations, Internal trendline channels with wide angles are usually not sustainable for long, but on bullish assets like nasdaq, they can prove otherwise sometimes. we'll watch to see how long this particular one will last.

N
@nsg_usd - 1 month ago
Quoted - nsg_usd

From my personal observations, Internal trendline channels with wide angles are usually not sustainable for long, but on bullish assets like nasdaq, they can prove otherwise sometimes. we'll watch to see how long this particular one will last.

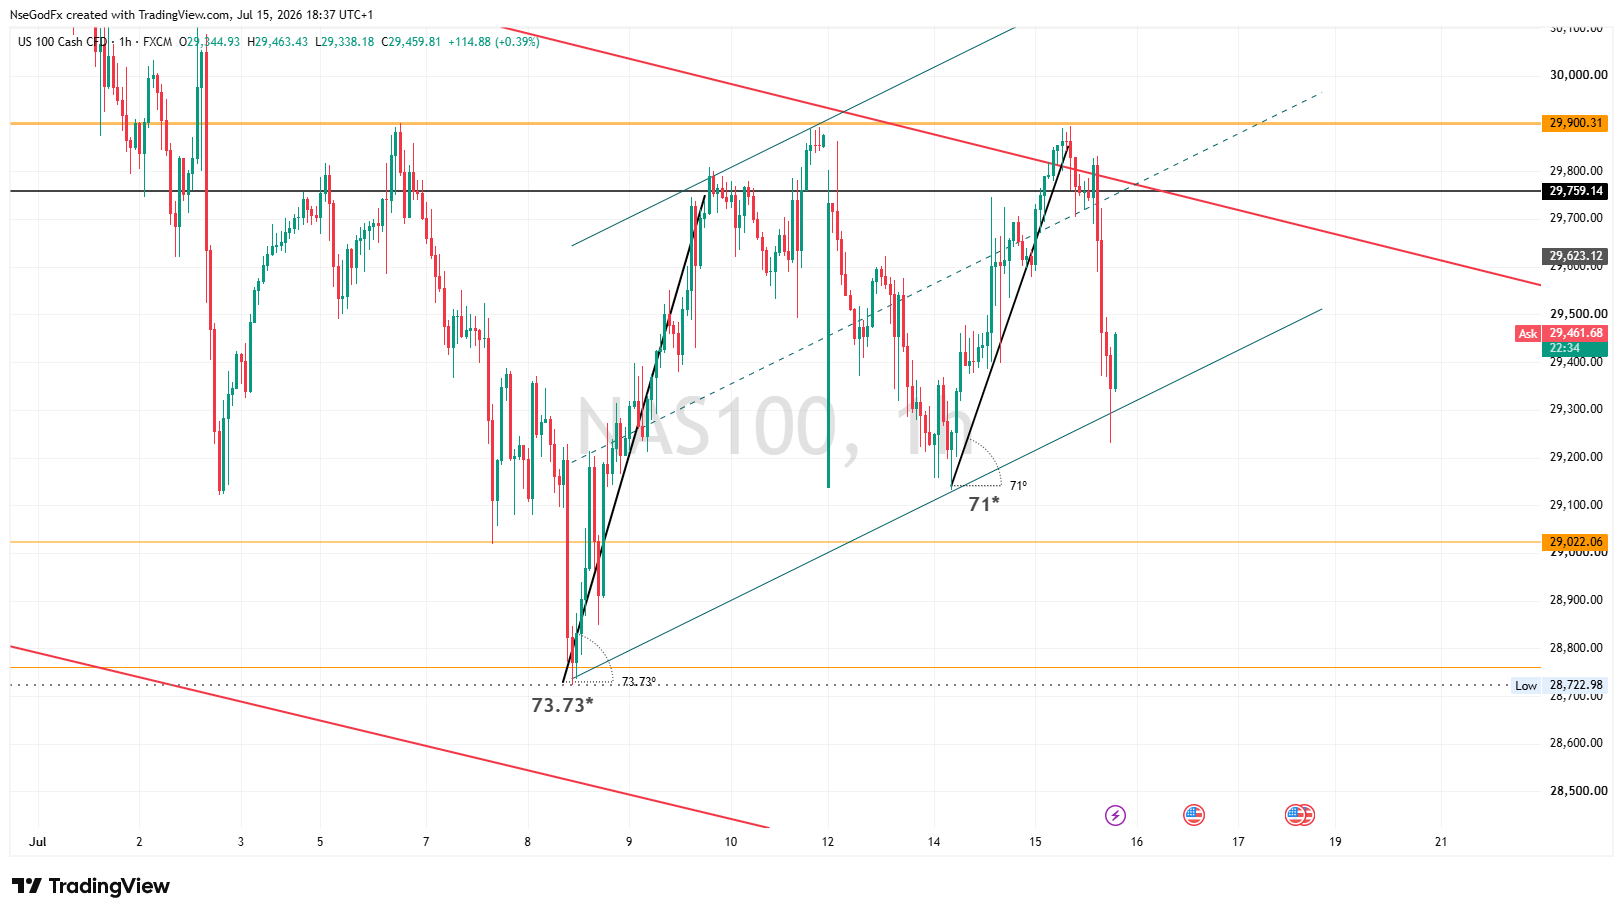
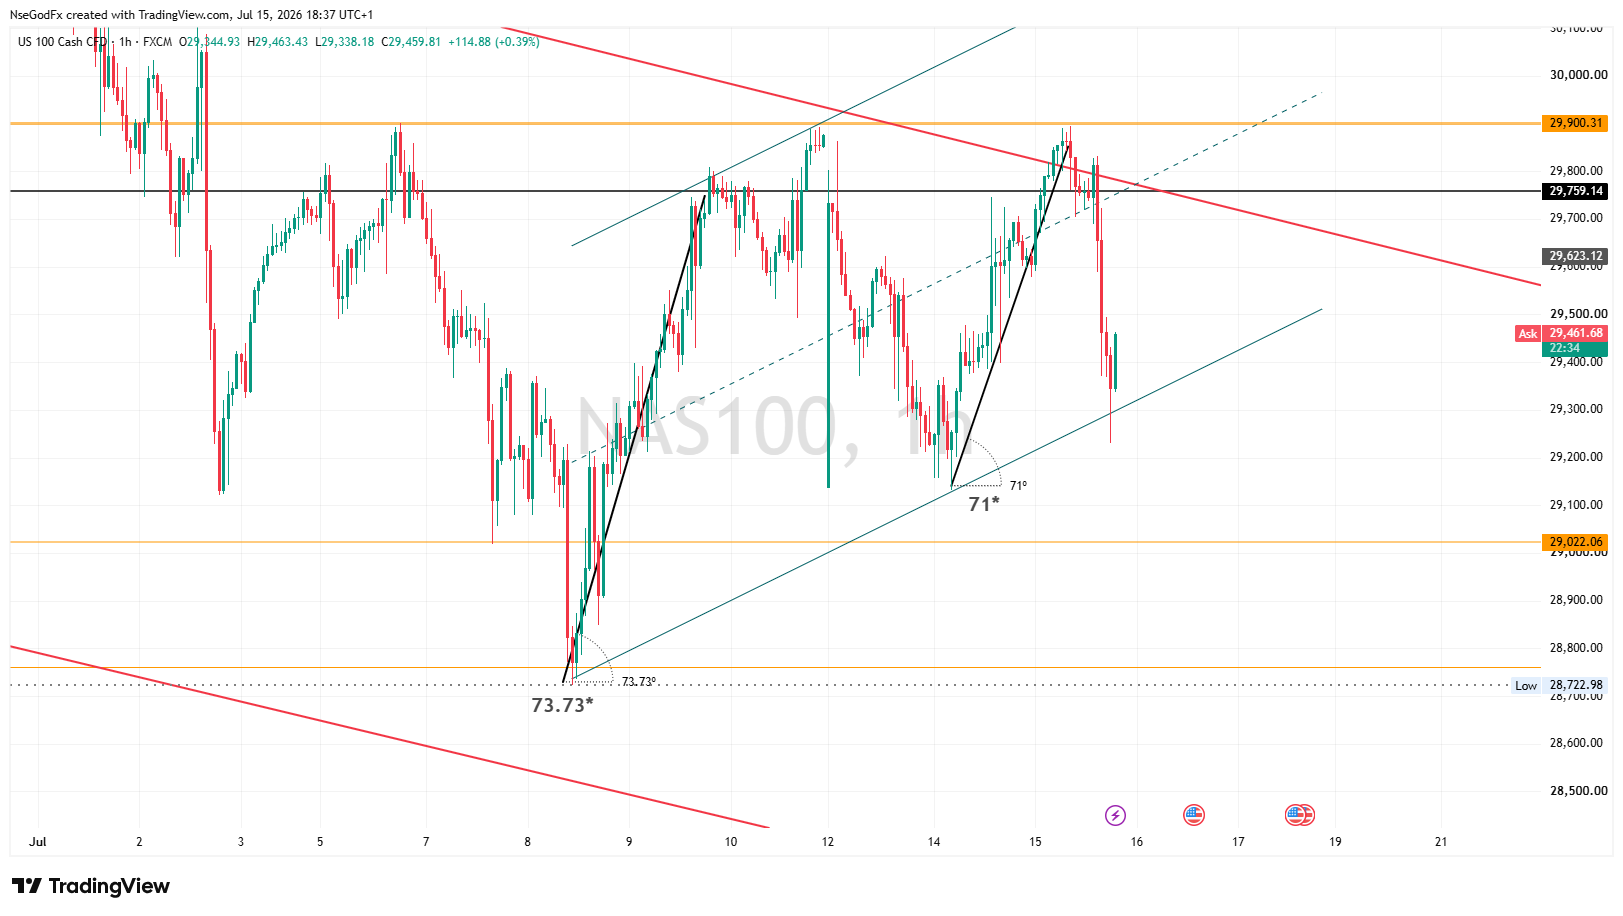
NAS 100- how to read Trend Angles (part 1)

Trend angle is a measurement tool that is used to measure impulse legs in a trending market.

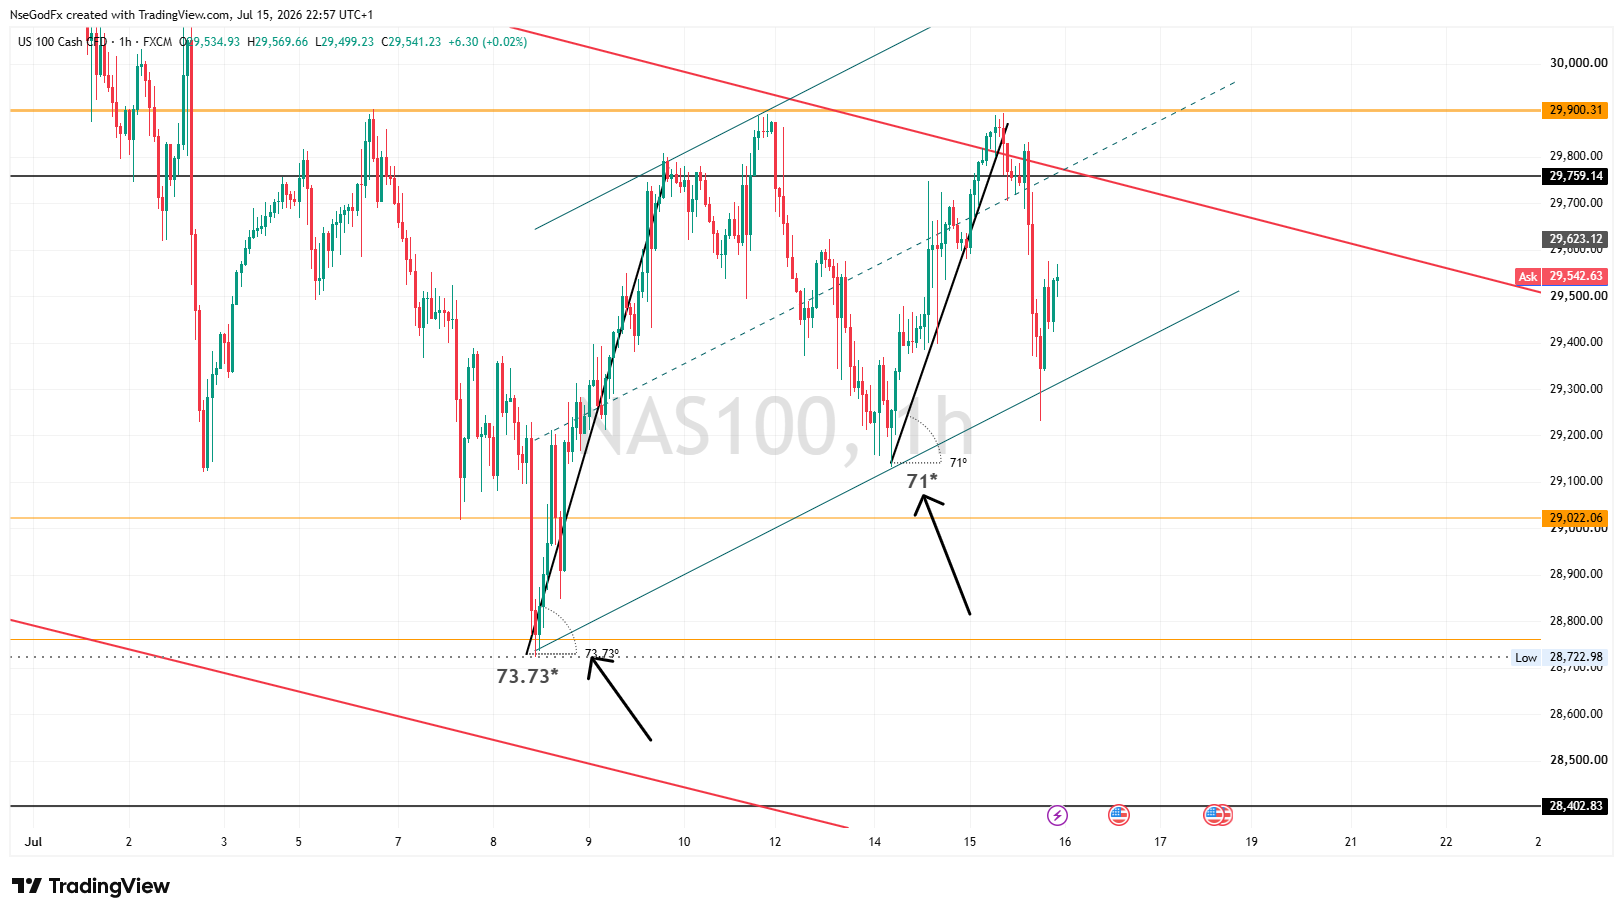
The angle represents the shallowness or steepness of each impulse leg. When 2 to 3 angles of impulse legs are compared, it gives a sequence which implies the trend momentum is increasing or decreasing. like the 73-71 sequence in the charts.

N
@nsg_usd - 1 month ago
Quoted - asuquokelvin

It is very clear that nas100 is ranging it goes from resistance to support and from support to resistance

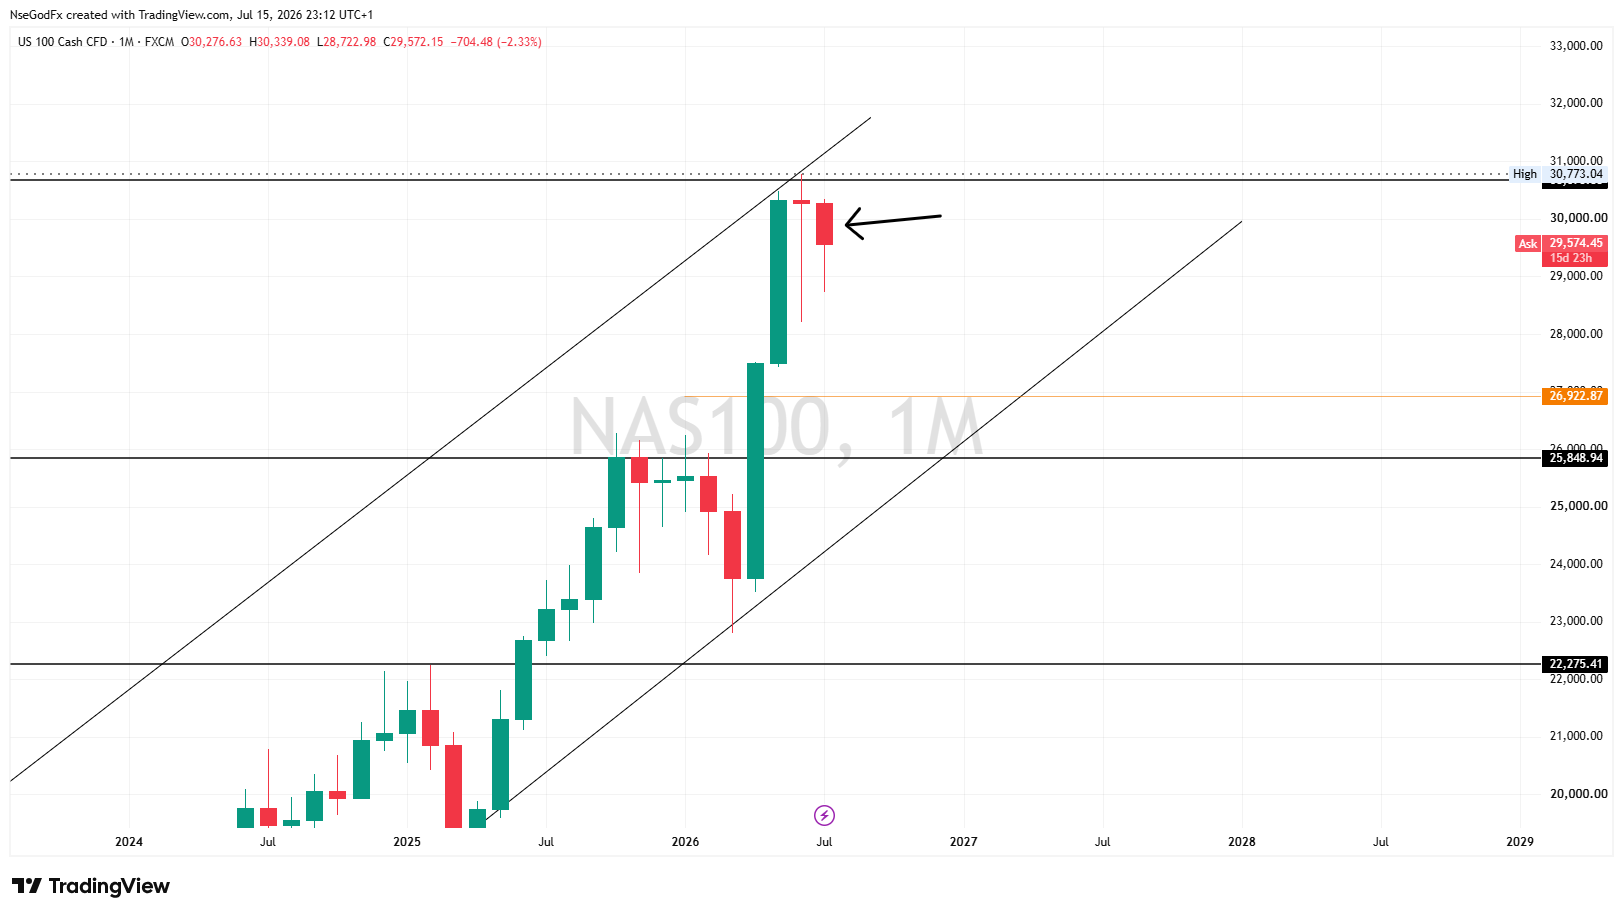
Yes. I stated that last week. and that can last until the month is over. The monthly candle is bearish, and stands a higher chance of closing bearish at month end.

N
@nsg_usd - 1 month ago
Quoted - nsg_usd

NAS 100- how to read Trend Angles (part 1)

Trend angle is a measurement tool that is used to measure impulse legs in a trending market.

The angle represents the shallowness or steepness of each impulse leg. When 2 to 3 angles of impulse legs are compared, it gives a sequence which implies the trend momentum is increasing or decreasing. like the 73-71 sequence in the charts.

Nas 100 - How to read Trend angles (part 2)

From the charts, the first impulse leg has trend angle of 73.73*, while the second impulse leg has a trend angle of 71*. From this measurement, the trend angle sequence is 73*-71 and this means the impulse leg is decreasing in momentum despite creating higher highs and higher lows.

The 3rd impulse leg is not yet completed and thus cannot be measured.

N
@nsg_usd - 1 month ago
Quoted - nsg_usd

Nas 100 - How to read Trend angles (part 2)

From the charts, the first impulse leg has trend angle of 73.73*, while the second impulse leg has a trend angle of 71*. From this measurement, the trend angle sequence is 73*-71 and this means the impulse leg is decreasing in momentum despite creating higher highs and higher lows.

The 3rd impulse leg is not yet completed and thus cannot be measured.

Nas 100 - How to read Trend angles (part 3)

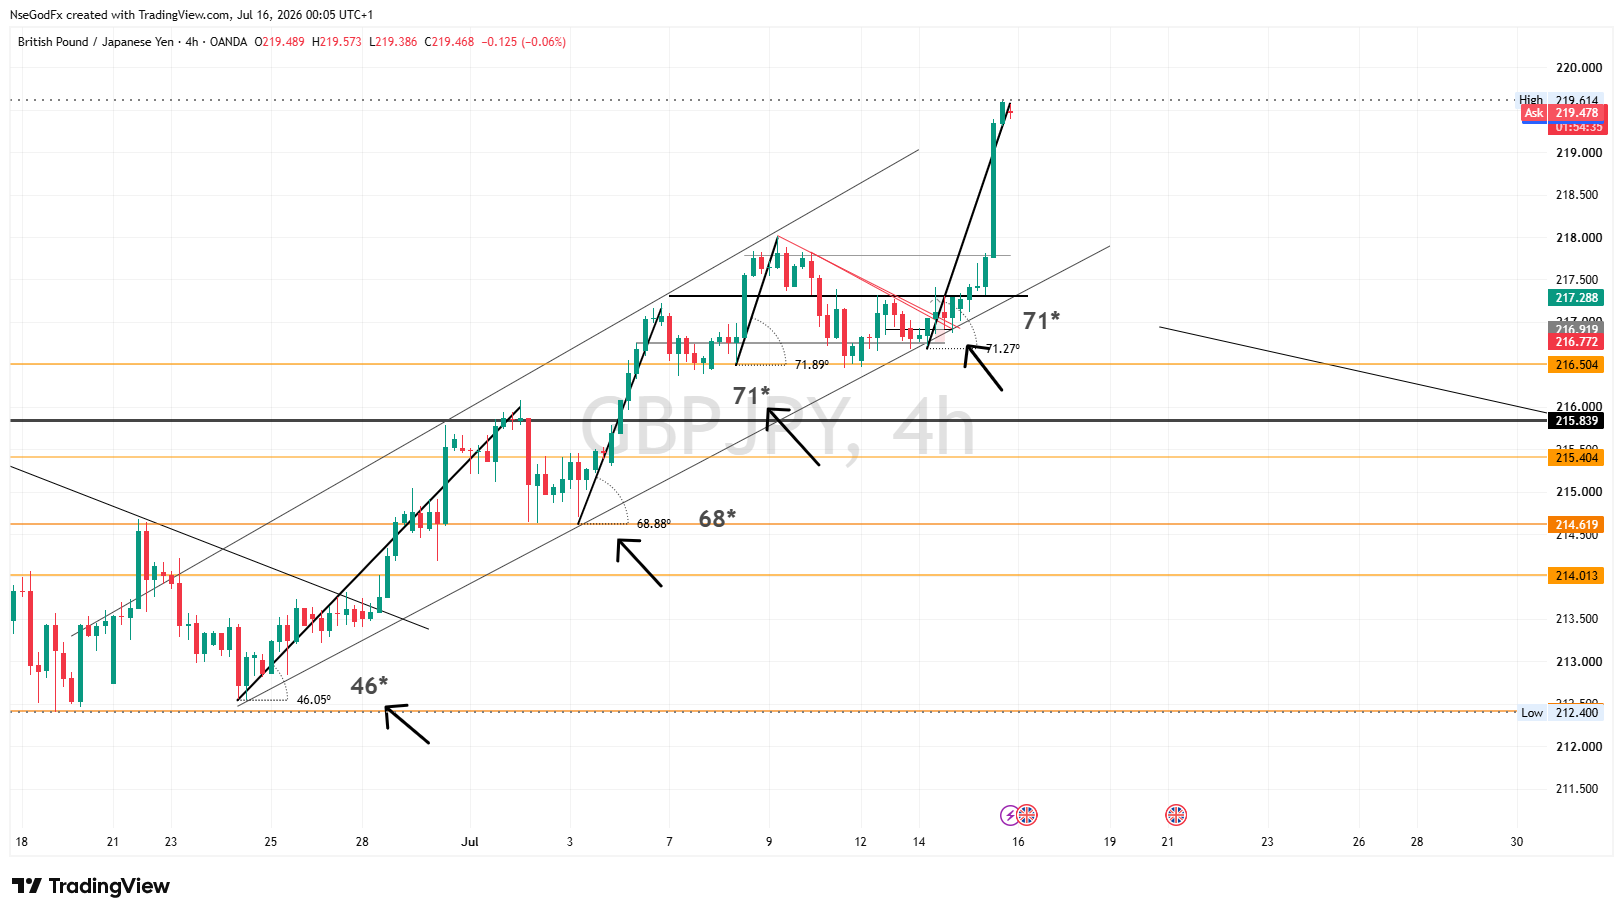
The 73* and 71* trend angles are both wide and wide angles shows steepness which implores that an impulse leg will be followed with sharp reversals.

shallow angles like 15*-20* are moderate and shows market is trending but not aggressively and price is advancing at a measured pace instead of accelerating.

healthy trend angles are between 35* to 55* and shows the trends are sustainable as shown in the GBPJPY charts (2nd picture).

Trend angles are not to be used single, but as added confluence or confirmation in technical analysis as it can guide one to understand when a trend has weakened and has a higher chance of reversal especially in steep trends.

N
@nsg_usd - 1 month ago
Quoted - godspowerdan

The sells is going well, but that retracement is scary sha

NAS 100- the retracement was sponsored by this trend support. but i don't trust it to hold for long. I'm expecting the sells to stil continue after the retracements.

Disclaimer:

At MyTradingLand.com, we connect you with forex brokers and provide a community for traders. While we offer valuable information and resources, please note that we are not financial advisors and cannot provide personalized financial advice. Always conduct your own research and invest responsibly.

Community Guidelines: The MyTradingLand.com community is designed as a resource for forex traders, promoting respectful and constructive discussions. We reserve the right to remove any content that is misleading, abusive, or violates our terms of service.

Broker Information: While we may receive commissions or advertising income from some of the brokers listed, this does not imply an endorsement of any broker, nor does it affect our review process. Our evaluations are based solely on objective criteria and user feedback.

Always verify the regulatory status of any broker with your local financial authority, along with their terms and privacy policies, before engaging with them. It is crucial to conduct thorough research to ensure that you are making informed decisions.

Risk Warning: At MyTradingLand.com, we strive to provide accurate information; however, the forex market is highly volatile and can change rapidly. It is essential to verify any information before making investment decisions.

Please be aware that trading in forex involves substantial risk, and it is possible to lose more than your trading equity/investment capital. 70-90% of retail CFD traders incur losses in their trading activities as per information from various brokers.

You are solely responsible for your use of MyTradingLand.com and any trading decisions you make. We encourage all users to educate themselves thoroughly about forex trading and to consider seeking advice from qualified financial professionals.

Advertising Disclosure: We may earn commissions from recommended brokers, but our reviews are independent (not influenced by potential earnings). Sponsored content is clearly marked and doesn't reflect our views.

©2026 ©2025 All rights reserved Mytradingland.com