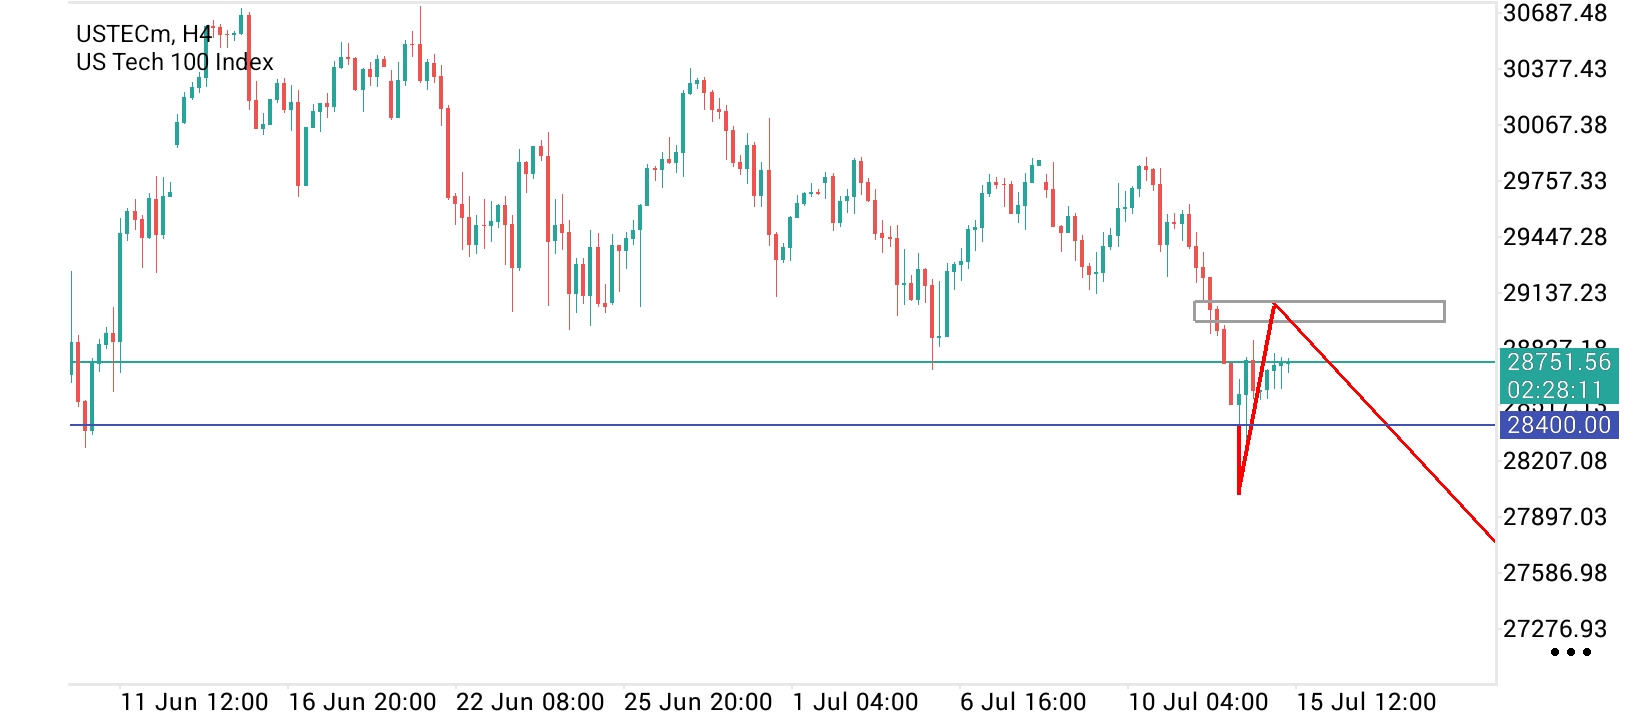
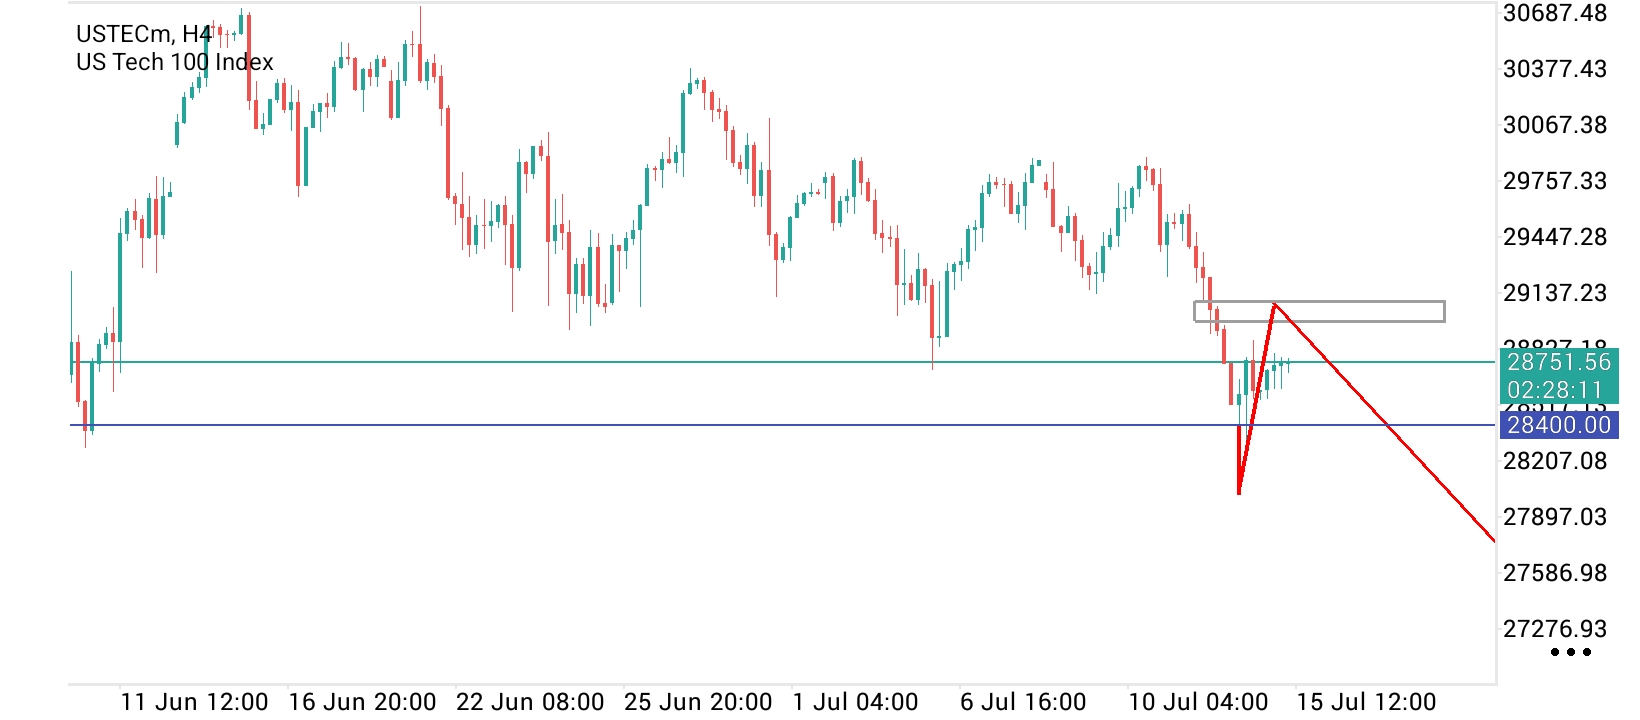
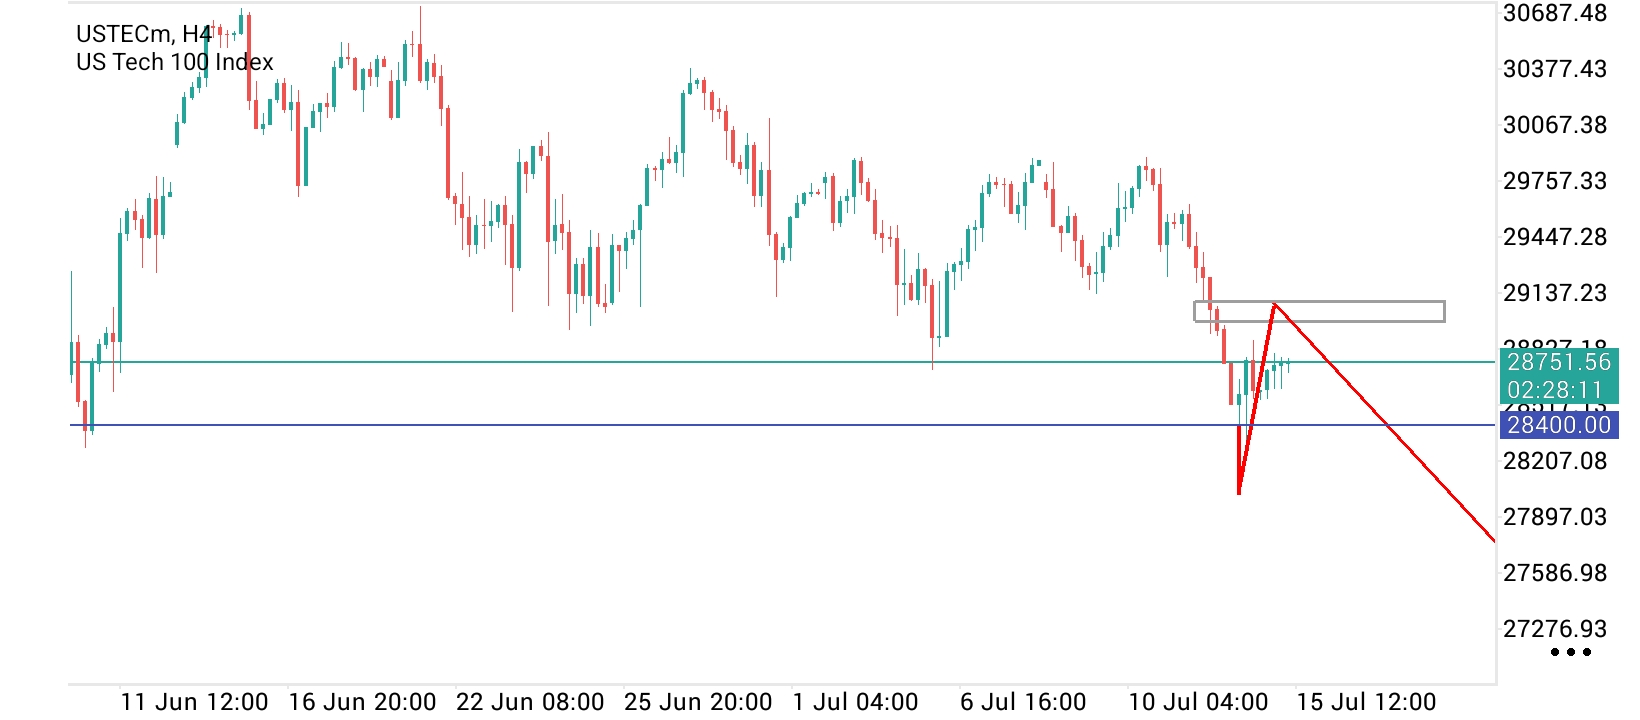
NASDAQ weekly Projections

N
@nsg_usd - 1 month ago
Quoted - asuquokelvin

Price has actually tested that level but without a solid break, till NY session let's see if that zone will get broken, but the last order block is very far

I'm only expecting reactions from that support level, I'm not expecting price to hold it for strong buys. Did you allow your pending order or you deleted it?

Except the weekly candle does not break through the support zone by market close today, then I'll expect next week to start with buys. otherwise, the sells will just continue as it as from next week, below the level.

A
@asuquokelvin - 1 month ago
Quoted - nsg_usd

I'm only expecting reactions from that support level, I'm not expecting price to hold it for strong buys. Did you allow your pending order or you deleted it?

Except the weekly candle does not break through the support zone by market close today, then I'll expect next week to start with buys. otherwise, the sells will just continue as it as from next week, below the level.

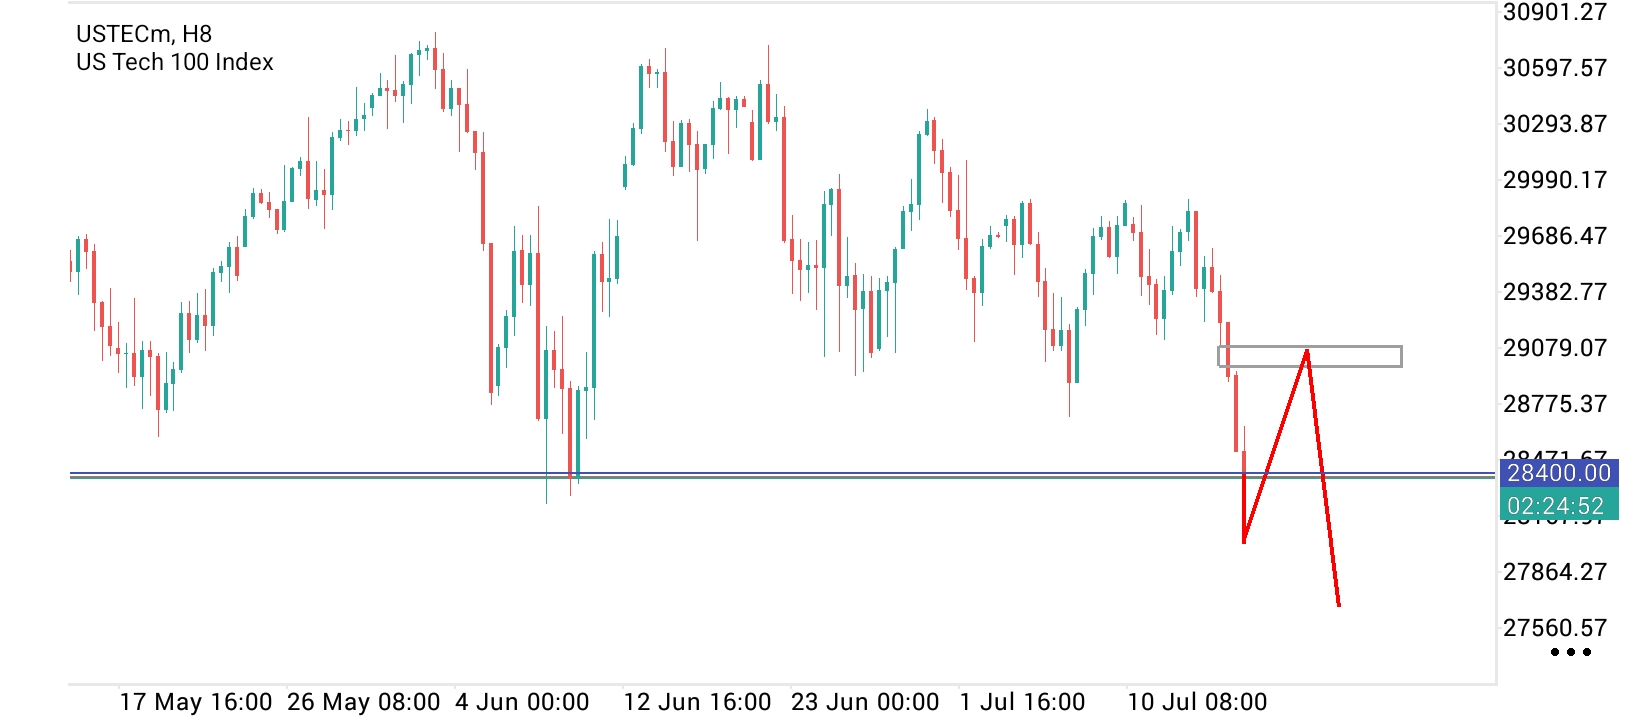
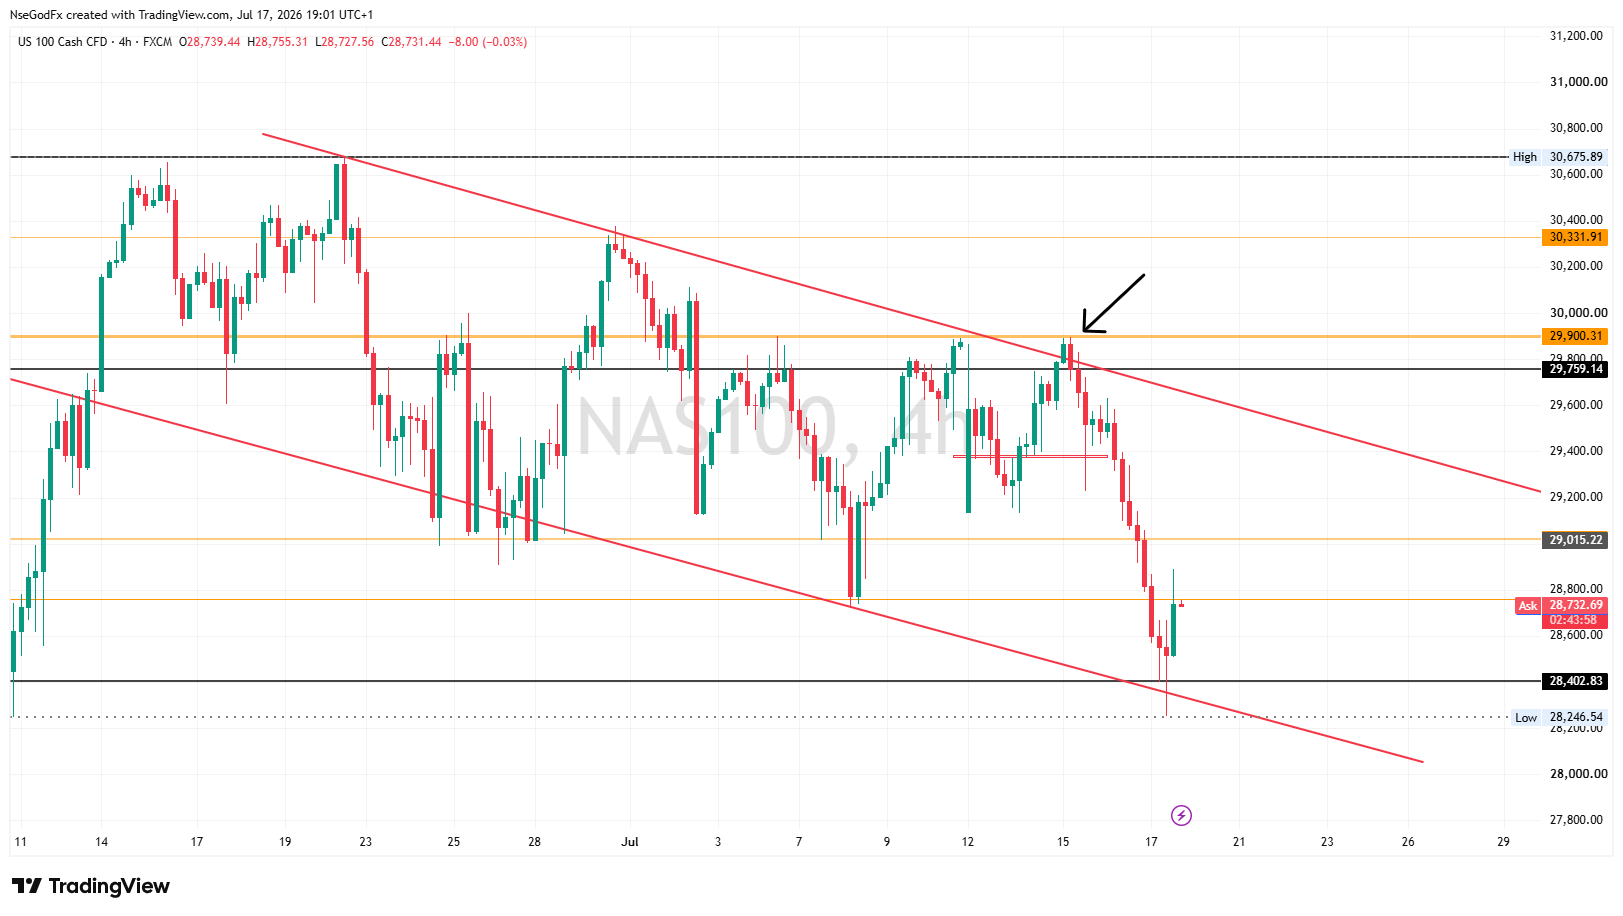
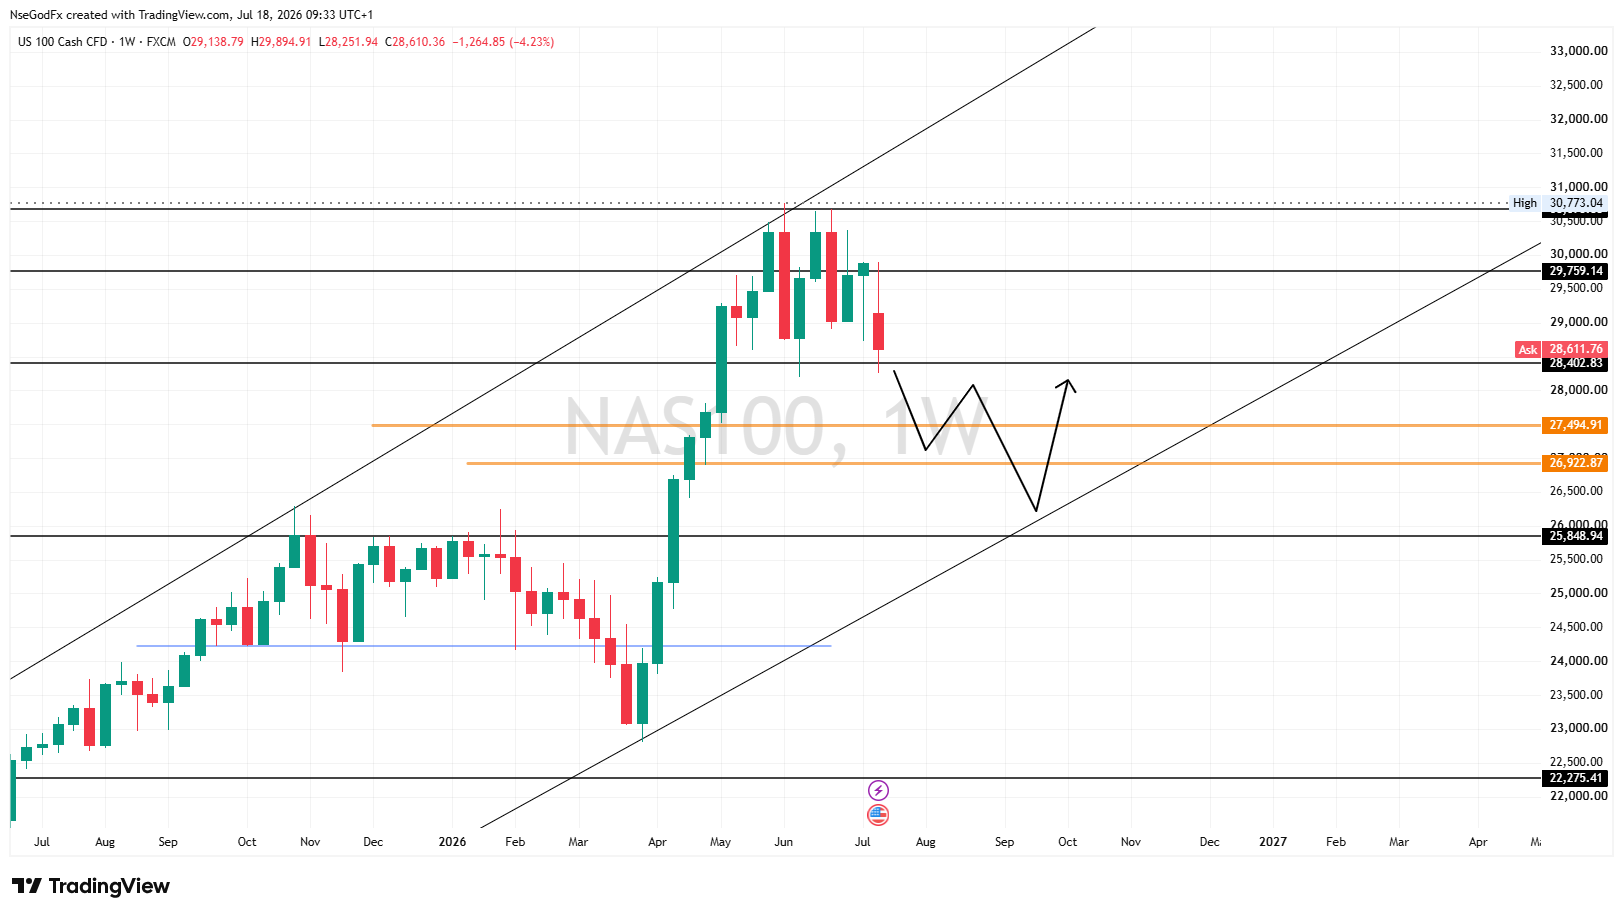
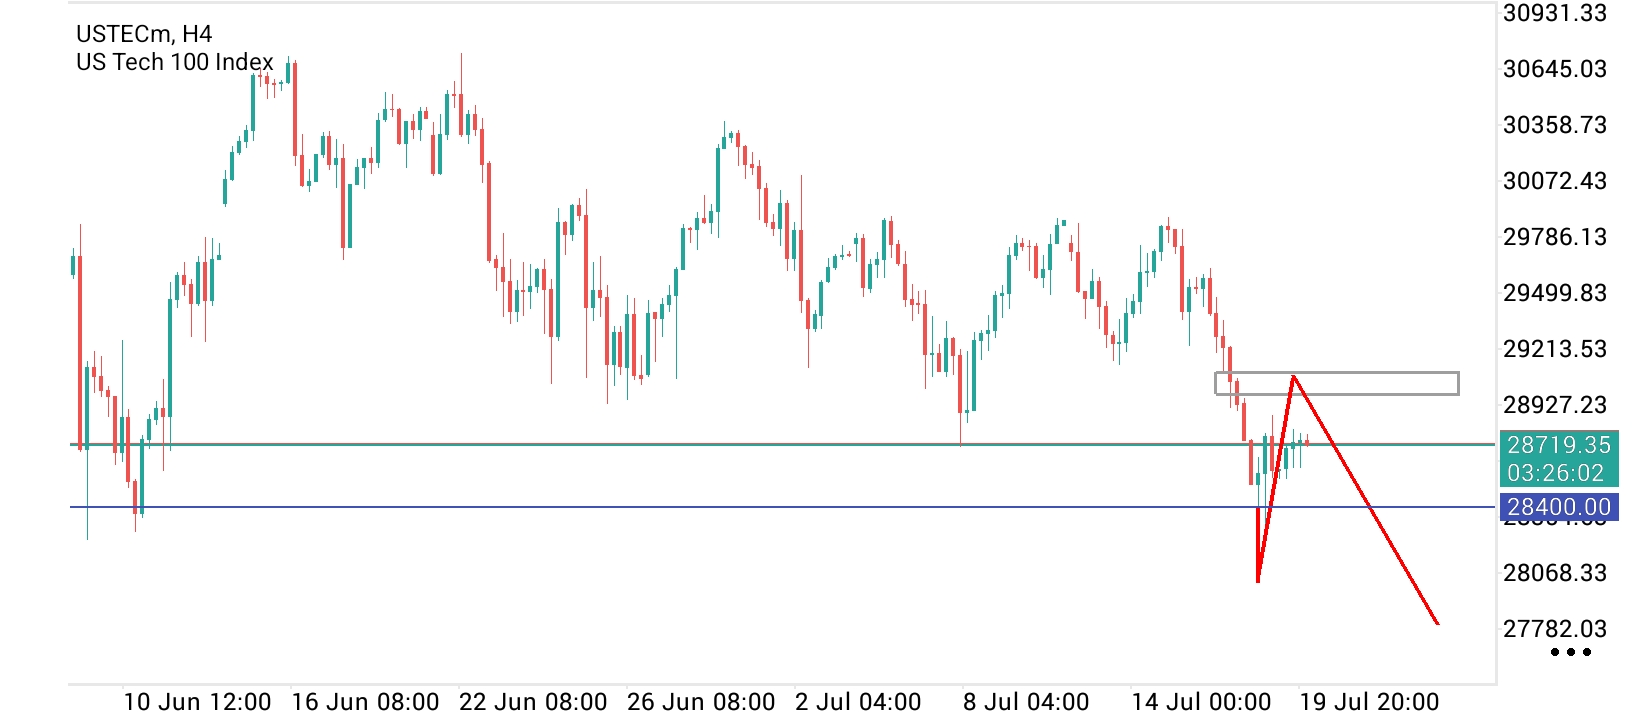
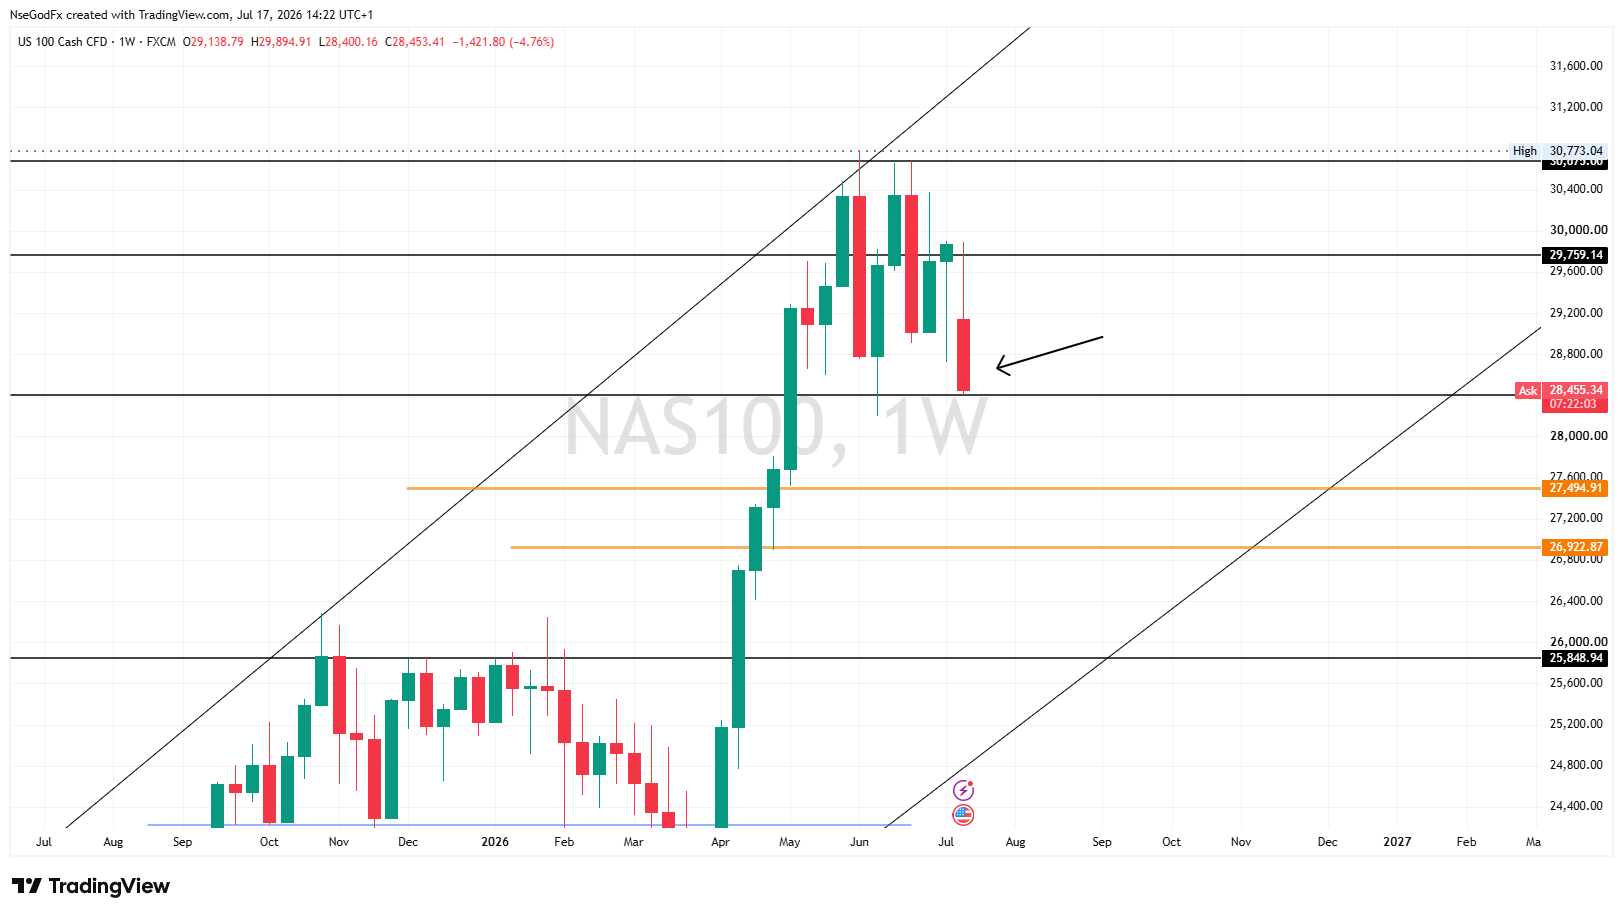
You are all mistaken am not buying anything, an just waiting for a break below 28400 so I can confirm that price will not get to that resistance again because it price sweeps just at that level it could get to that resistance level so that is just it, look at the chart image and see my marking what I want to see happen

N
@nsg_usd - 1 month ago
Quoted - godspowerdan

i took profit this morning

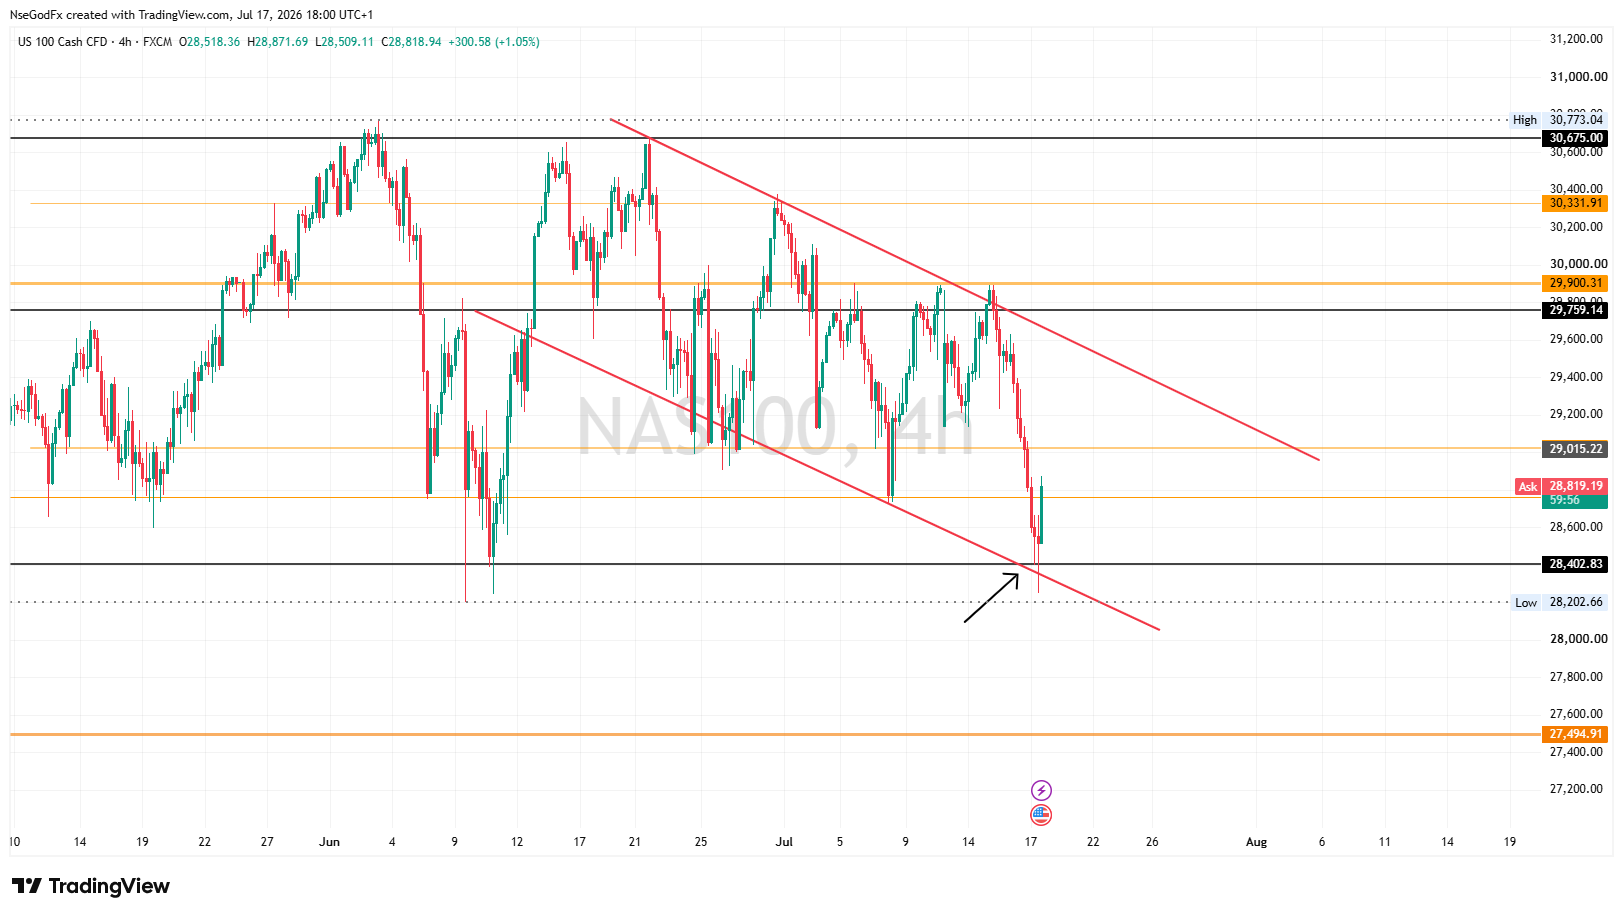
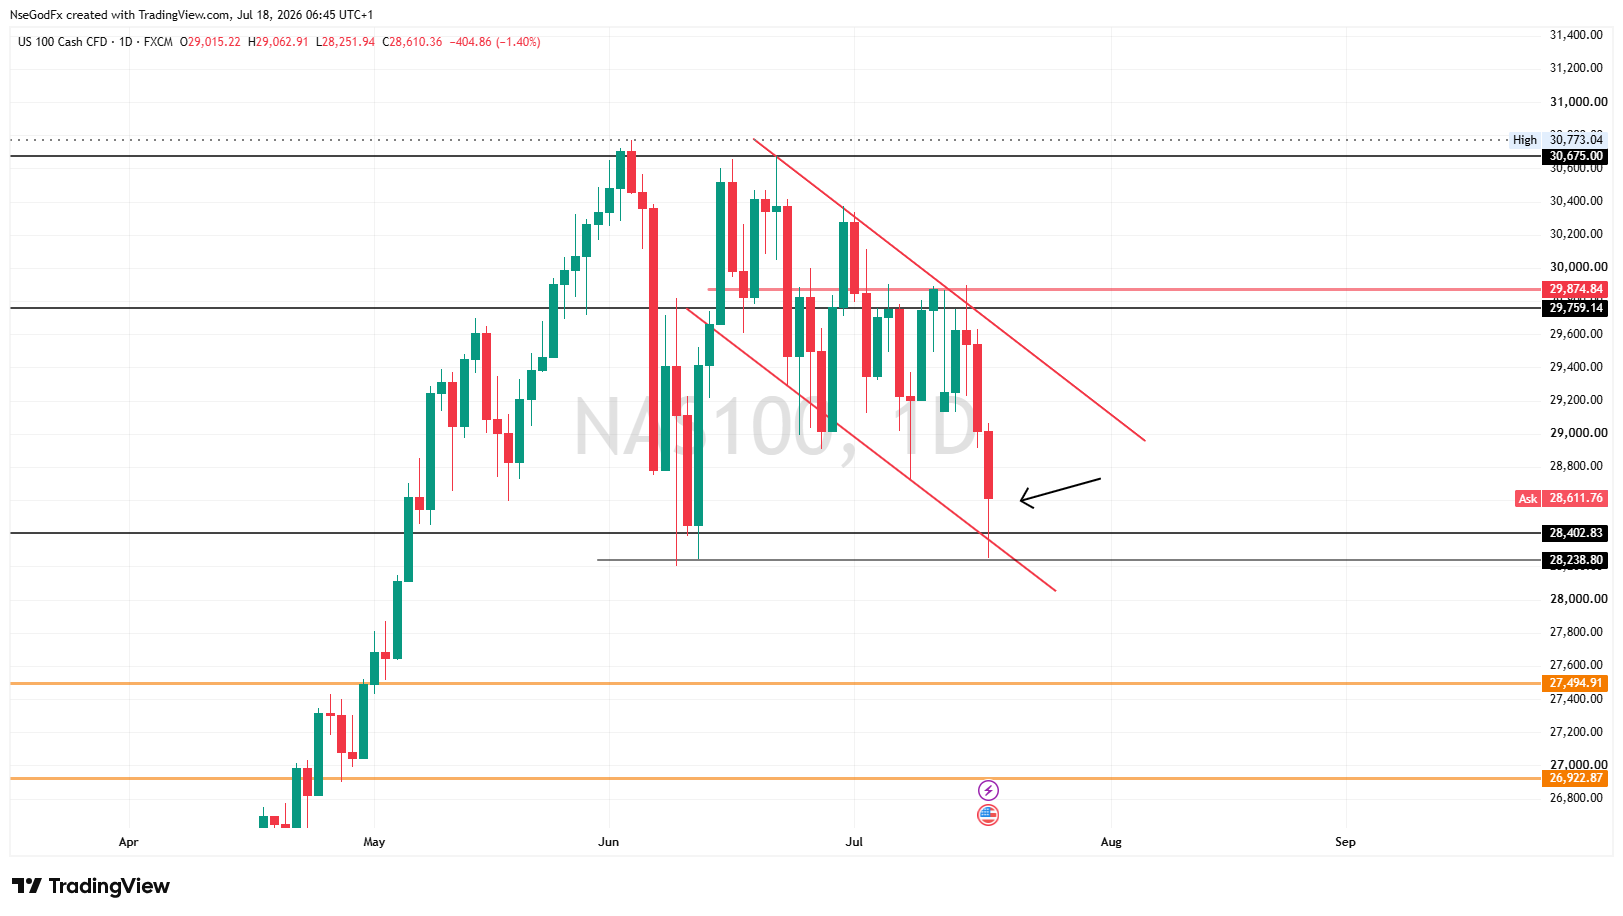
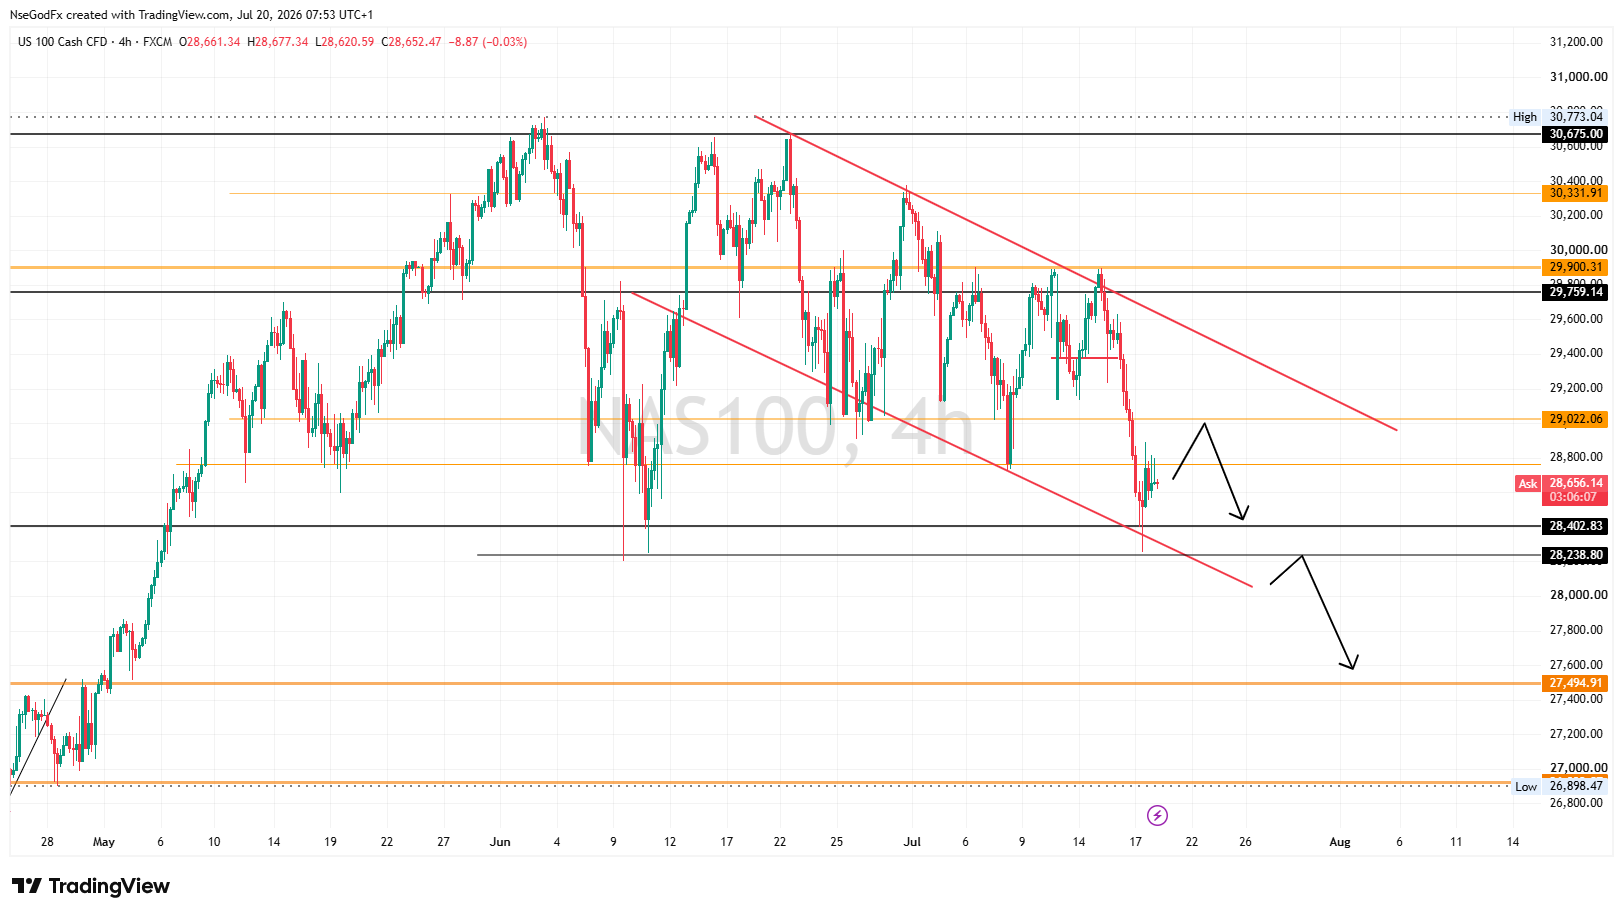
Alright cool. Nas 100 traded below 28400 but has not closed below it. Price is still confined to a bearish channel but has not broken the major support zone. The confluence of the lower boundaries of the bearish channel with the Key support zone hindered price from breaking below it. I'll still maintain my expectations within the trading range, until there's a full breakout to the downside, or a strong rally above the triple top resistance zone.

N
@nsg_usd - 1 month ago

NASDAQ Weekly Trade Summary and Recap (1)

As the Trading week will be drawing to a close by the end of today friday, we've witness heavy momentums on both sides of the market participants. However, I'll be having the bears crowned as winners of the weekly trading activities as the selloff on Nasdaq was more than the rally we earlier witness on the asset in the middle of the week.

N
@nsg_usd - 1 month ago
Quoted - nsg_usd

NASDAQ Weekly Trade Summary and Recap (1)

As the Trading week will be drawing to a close by the end of today friday, we've witness heavy momentums on both sides of the market participants. However, I'll be having the bears crowned as winners of the weekly trading activities as the selloff on Nasdaq was more than the rally we earlier witness on the asset in the middle of the week.

NASDAQ Weekly Trade Summary and Recap (2)

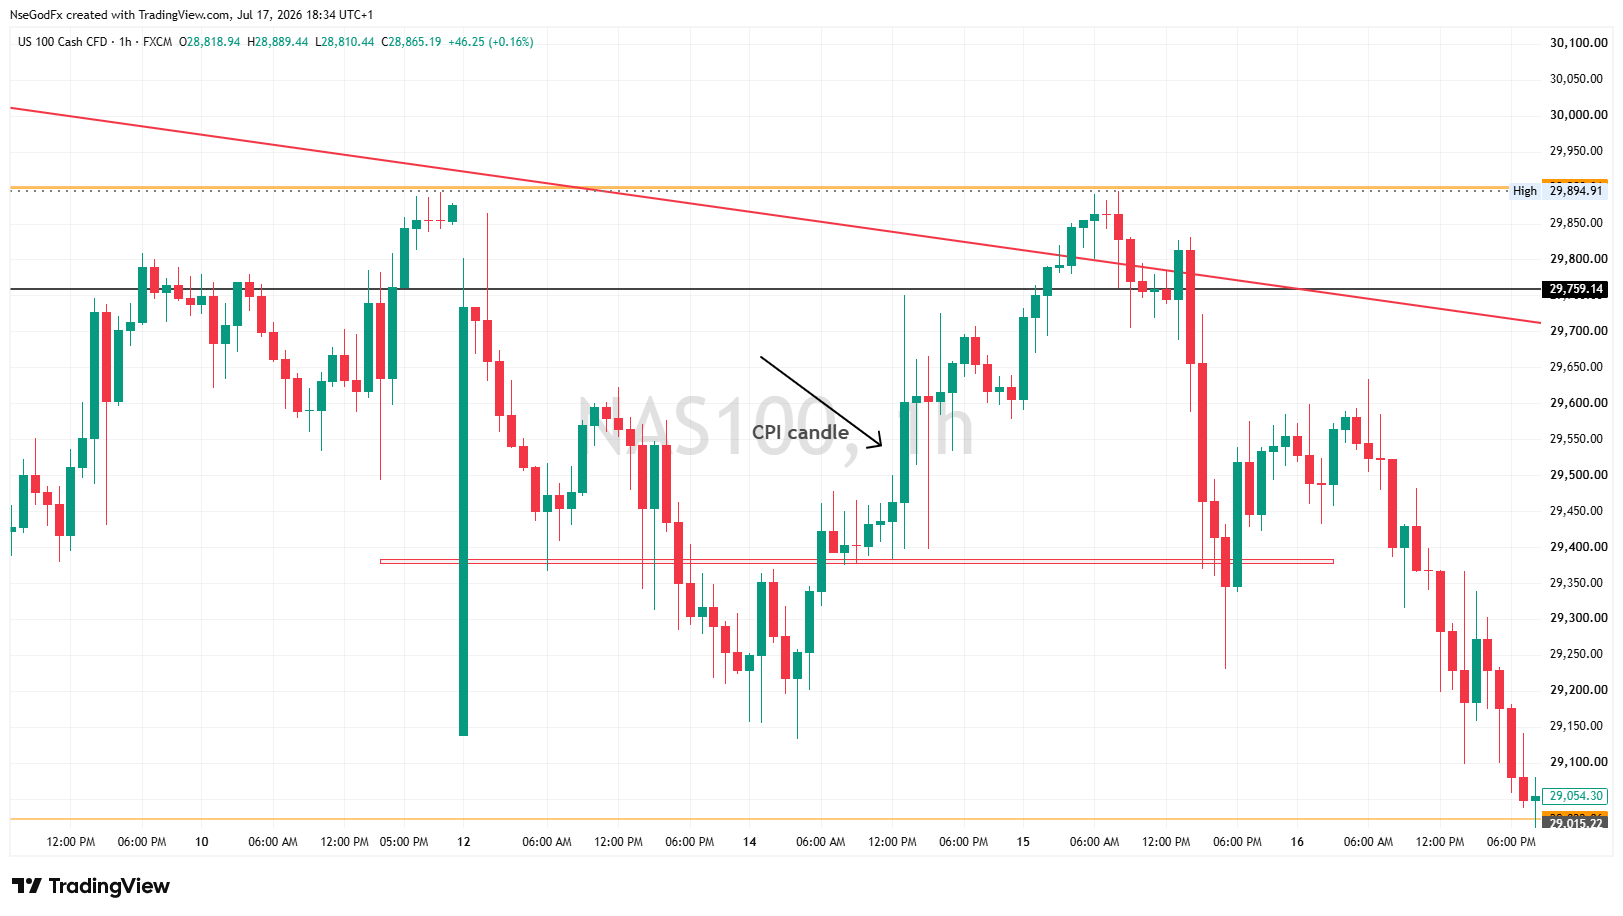
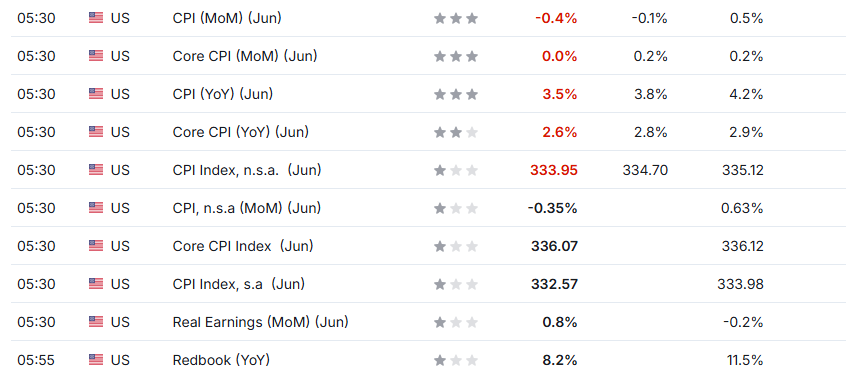
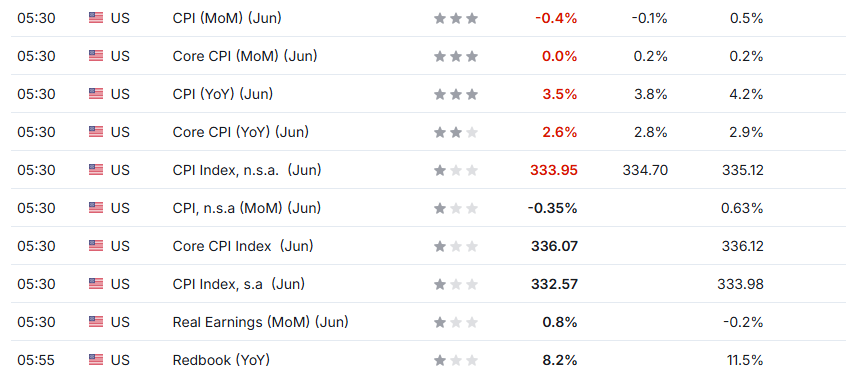
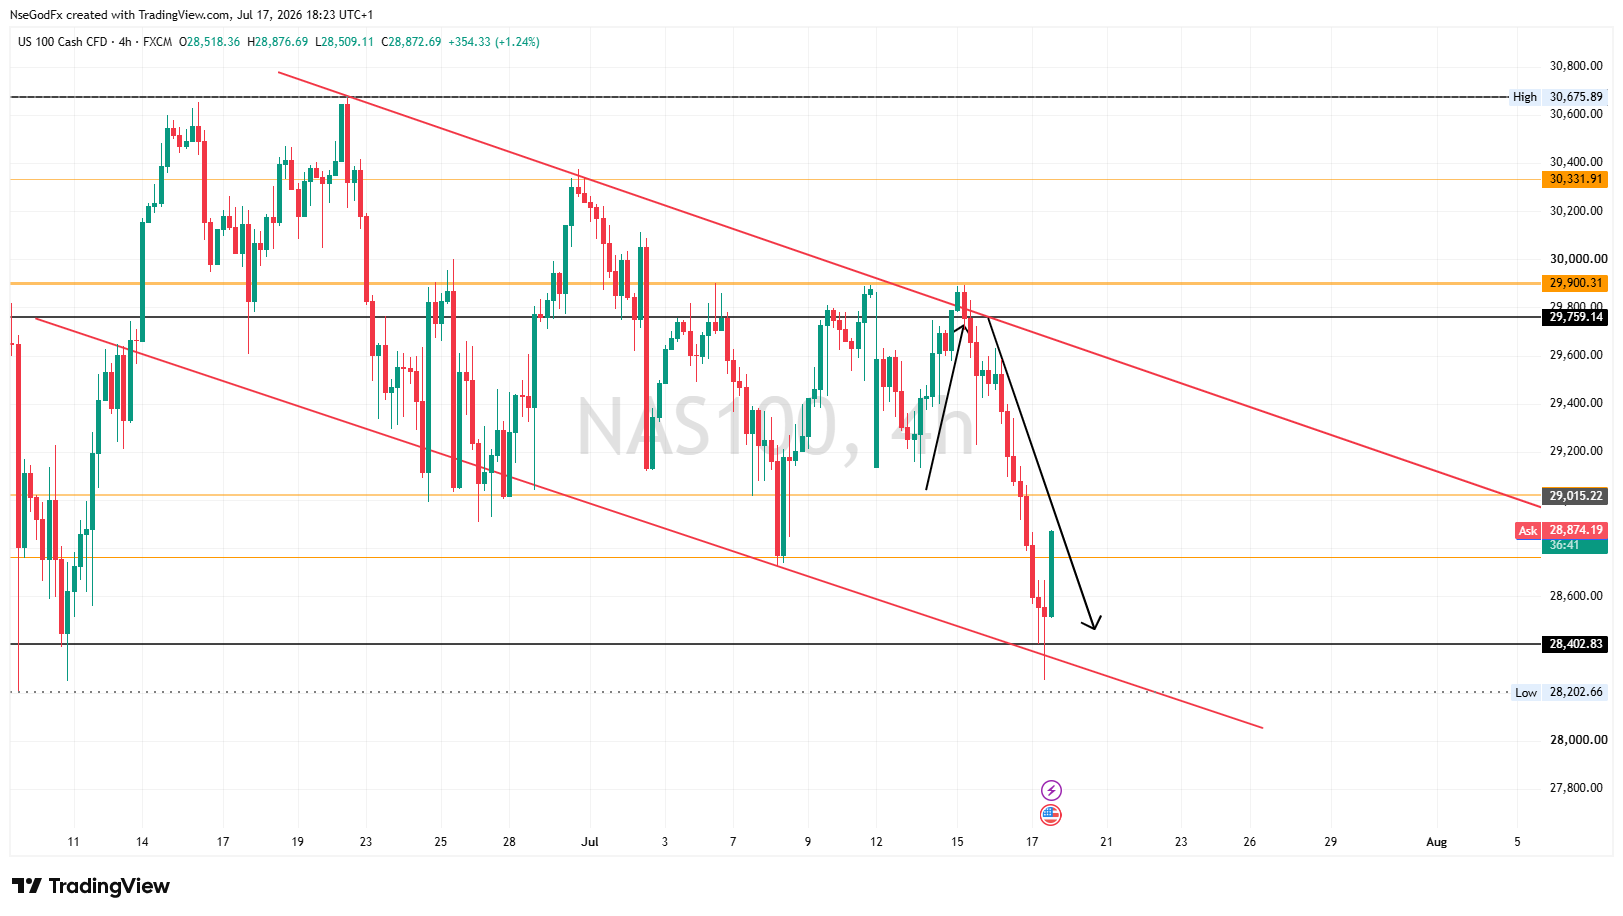
This week 4 CPI metrics was released, and all came in below expectations, signaling a softer inflation. This was bullish for Nasdaq as we witnessed a rally from the 29400 (support) -price region, to 29750 price level(resistance).

N
@nsg_usd - 1 month ago
Quoted - nsg_usd

NASDAQ Weekly Trade Summary and Recap (2)

This week 4 CPI metrics was released, and all came in below expectations, signaling a softer inflation. This was bullish for Nasdaq as we witnessed a rally from the 29400 (support) -price region, to 29750 price level(resistance).

NASDAQ Weekly Trade Summary and Recap (3)

The 4 CPI metrics data released is tabulated below. (Consumer Price Index)

CPI data Previous Forecast Actual
CPI (YoY) 4.2% 3.8% 3.5%
CPI (MoM) 0.5% -0.1% -0.4%
Core CPI (YoY) 2.9% 2.8-2.85% 2.6%
Core CPI (MoM) 0.2% 0.2% 0.0%

The weaker inflation data boosted Nasdaq as investors priced in a lower probability of Further Federal reserve tightening.

Lower expected interest rates generally boost the valuation of growth stocks, particularly technology companies that dominate the Nasdaq.

N
@nsg_usd - 1 month ago
Quoted - nsg_usd

NASDAQ Weekly Trade Summary and Recap (3)

The 4 CPI metrics data released is tabulated below. (Consumer Price Index)

CPI data Previous Forecast Actual
CPI (YoY) 4.2% 3.8% 3.5%
CPI (MoM) 0.5% -0.1% -0.4%
Core CPI (YoY) 2.9% 2.8-2.85% 2.6%
Core CPI (MoM) 0.2% 0.2% 0.0%

The weaker inflation data boosted Nasdaq as investors priced in a lower probability of Further Federal reserve tightening.

Lower expected interest rates generally boost the valuation of growth stocks, particularly technology companies that dominate the Nasdaq.

NASDAQ Weekly Trade Summary and Recap (4)

Despite the Favour from CPI on Nasdaq, the bullish moments were short-lived.
As the week progressed, sentiment shifted due to factors that was unrelated to CPI and not scheduled on Economic Calendar as well.

The Nasdaq later gave back gains, as profit-taking, weakness in AI and semiconductor stocks, and renewed Middle East Tensions shifter investor sentiment later in the week.

Technically, these factors also aligned with technical confluences on the chart, thus showing how price responds to economic factors by creating patterns and forming strong reaction candles at key/major Price levels (support and resistance, demand and supply)

N
@nsg_usd - 1 month ago
Quoted - nsg_usd

NASDAQ Weekly Trade Summary and Recap (4)

Despite the Favour from CPI on Nasdaq, the bullish moments were short-lived.
As the week progressed, sentiment shifted due to factors that was unrelated to CPI and not scheduled on Economic Calendar as well.

The Nasdaq later gave back gains, as profit-taking, weakness in AI and semiconductor stocks, and renewed Middle East Tensions shifter investor sentiment later in the week.

Technically, these factors also aligned with technical confluences on the chart, thus showing how price responds to economic factors by creating patterns and forming strong reaction candles at key/major Price levels (support and resistance, demand and supply)

NASDAQ Weekly Trade Summary and Recap (5-final)

With the following factors;

-Heavy selling in semi-conductor and AI-related stocks
-Profit-taking after the Nasdaq's strong rally
-Renewed US-Iran war and Airstrikes, which pushed oil prices higher and revived inflation concerns,

Investors rotated their capitals and investments from high-growth technology stocks into financials, energy, and defensive sectors, causing the Nasdaq to finish the week under pressure despite favorable inflation data.

Summary: Comparing the impact of economic calendar news data with geopolitical risks/tensions, we can safely conclude that bullish economic data release alone, does not guarantee a bullish market. Macro data may shape an underlying narrative, but lasting price direction is ultimately governed by institutional positioning, sector rotation, earnings expectations, price action dynamics, and evolving geopolitical risks.

N
@nsg_usd - 1 month ago
Quoted - godspowerdan

Let's see how price will close today

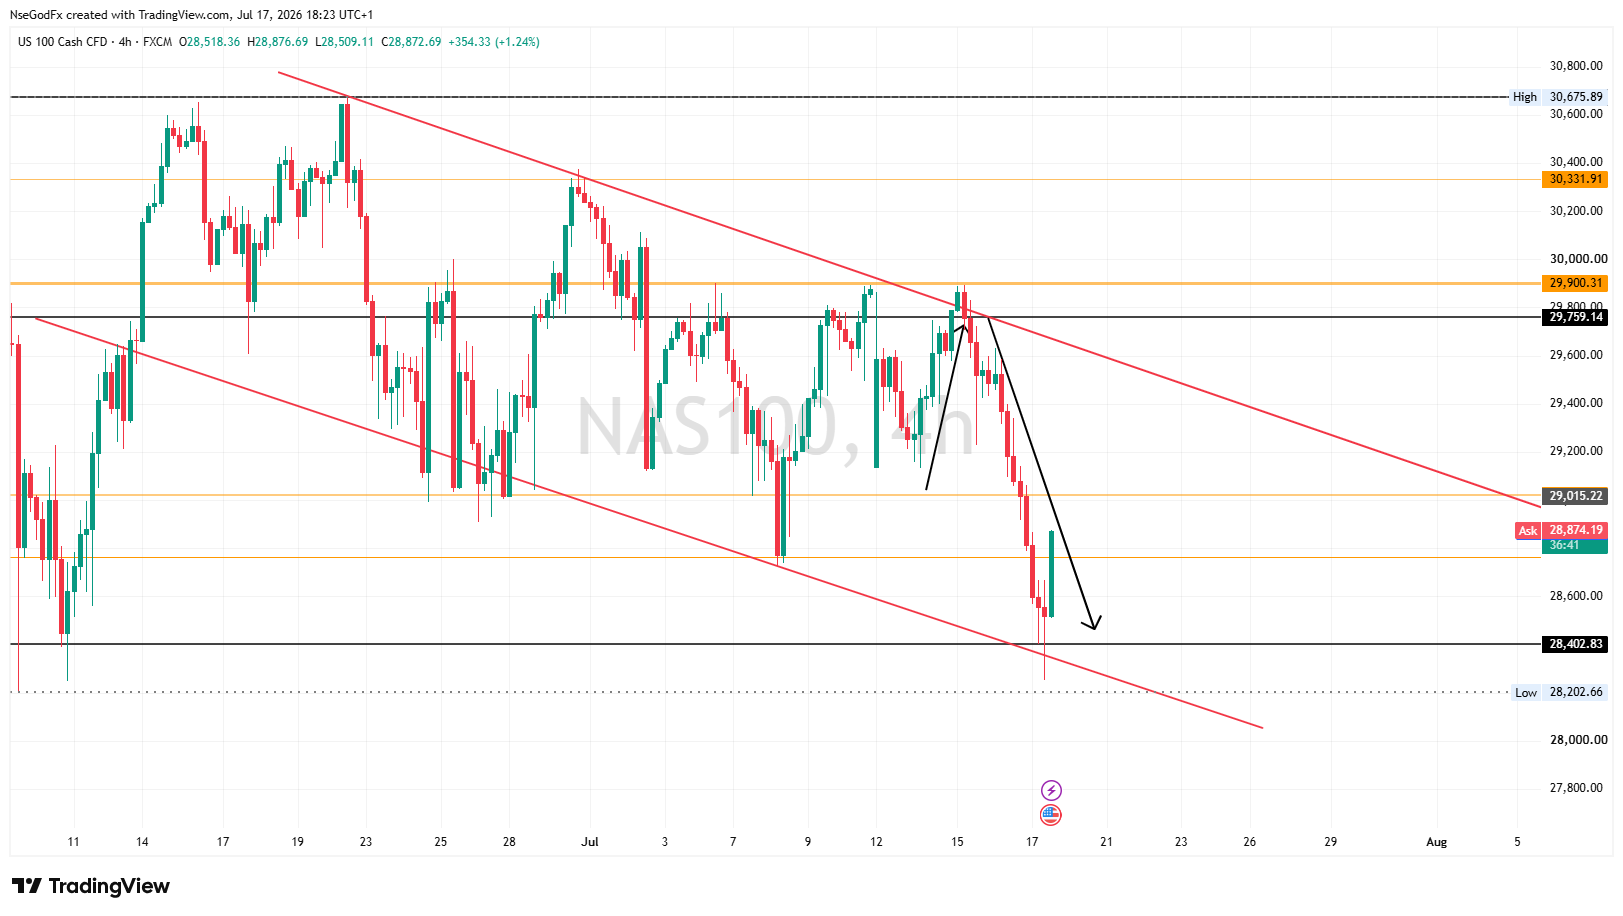
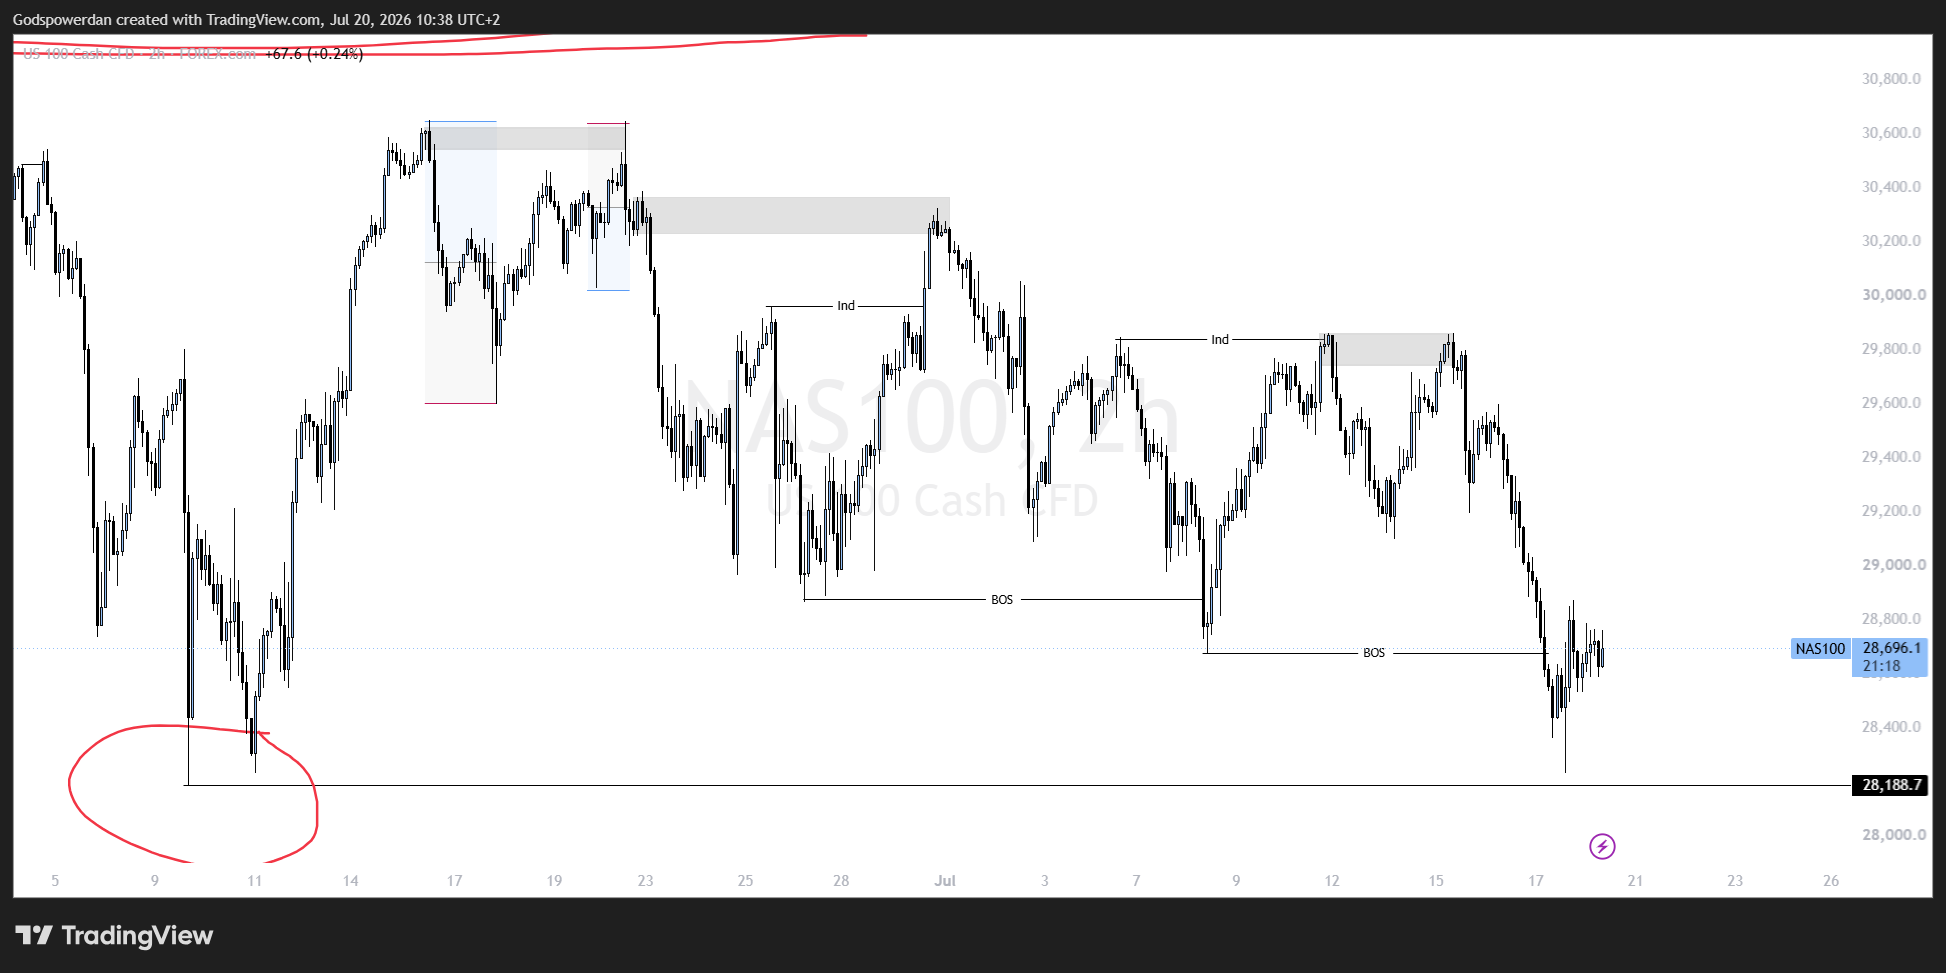
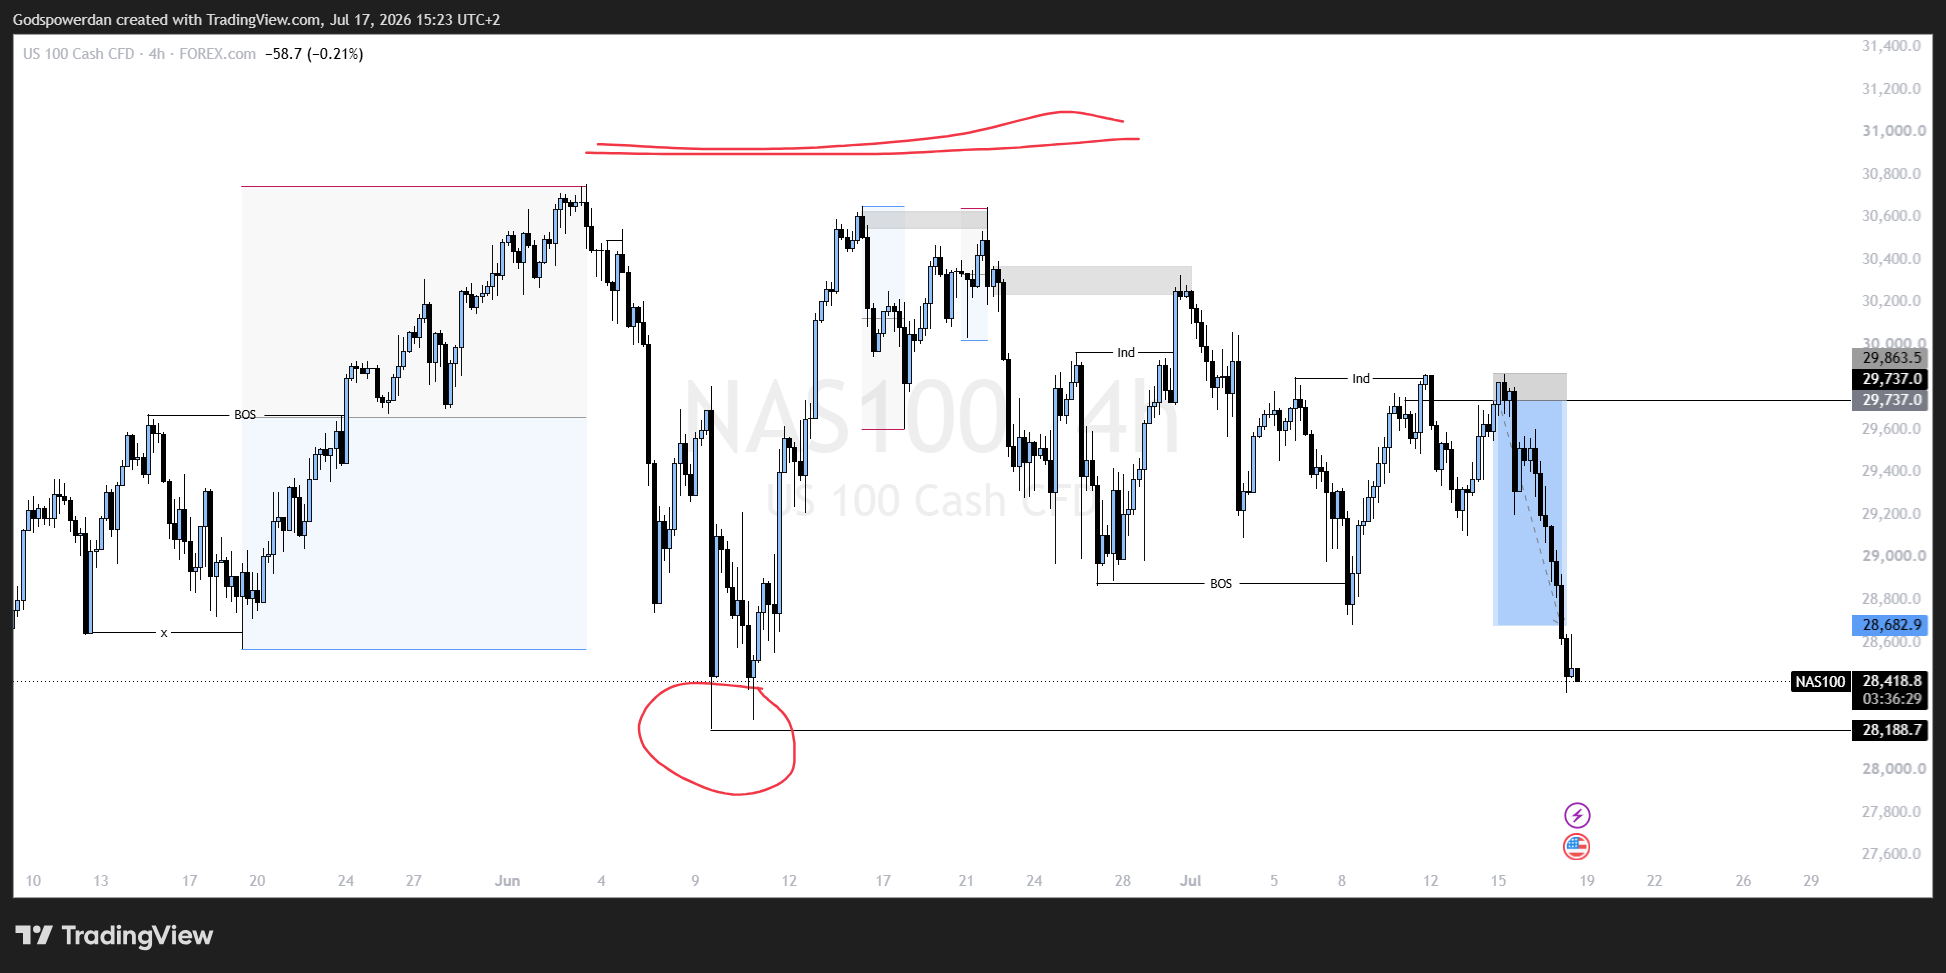
NAS 100- Price Closed without a break below the Key Support level but rather intends to create a double bottom at the zone. Let's see how next week goes.

N
@nsg_usd - 1 month ago
Quoted - asuquokelvin

So what you mean is that for it to reverse from any of the zone I marked with the upward movement arrows it will take like another 6 months, meaning it should be like early next year, for what I understand it should be when the war ends, when risk appetite will increase

The timeframes do not always correlate in that manner. It may have taken 6 months for the first rally but might take more months for the next rally or less when the corrections end within your reaction boxes region, not exactly the same monthly duration, but will closely relate.

N
@nsg_usd - 1 month ago

NASDAQ Daily Trade Projections

As the New Trading week begins today, I'll just be watching out price reactions on Nasdaq.
Expecting the week to start with buys and later continue with sells.

G
@godspowerdan - 1 month ago
Quoted - nsg_usd

NAS 100- Price Closed without a break below the Key Support level but rather intends to create a double bottom at the zone. Let's see how next week goes.

Yeah true

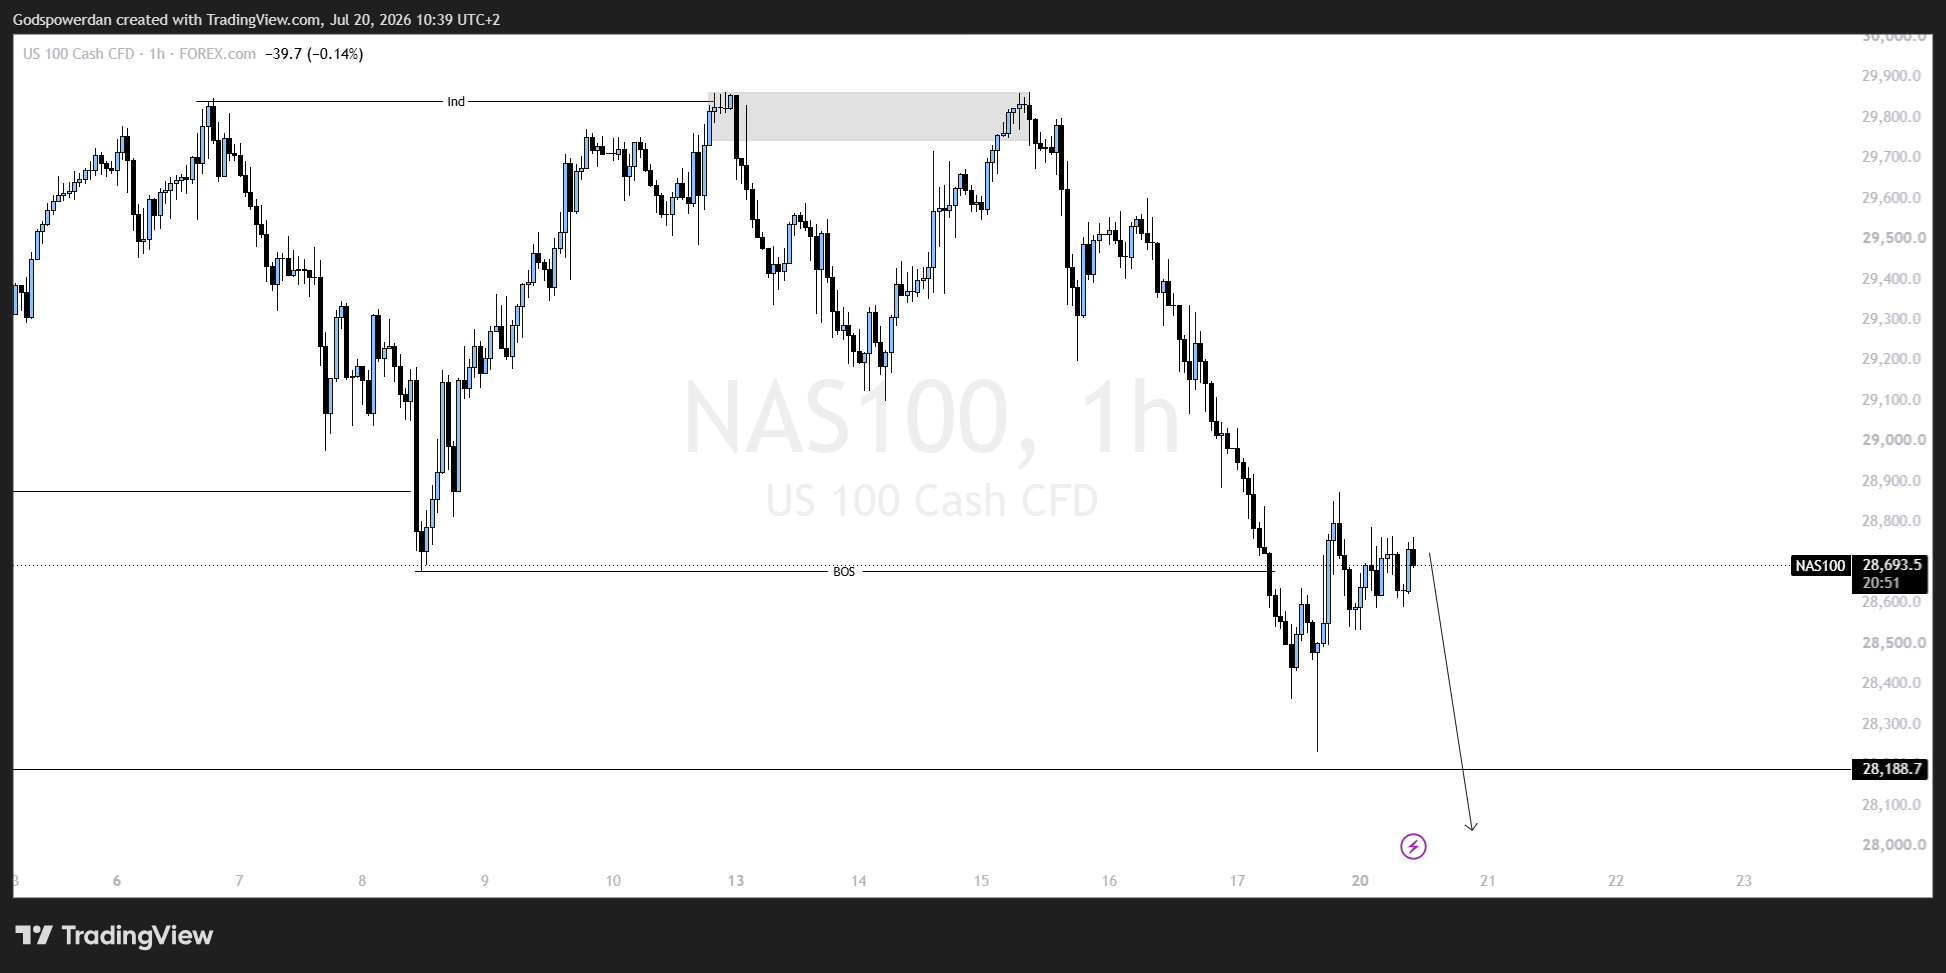
That's the higher timeframe narrative, but let's stick with our recent structure as i would always say. Price is still bearish, that rejection from that support you marked was just a reaction/pullback. For the buys to be confirmed from that level, Price has to start protecting the lows.

So the pullback was just little, price may intend to continue downwards and the tendency is high

A
@asuquokelvin - 1 month ago
Quoted - nsg_usd

NASDAQ Weekly Trade Summary and Recap (5-final)

With the following factors;

-Heavy selling in semi-conductor and AI-related stocks
-Profit-taking after the Nasdaq's strong rally
-Renewed US-Iran war and Airstrikes, which pushed oil prices higher and revived inflation concerns,

Investors rotated their capitals and investments from high-growth technology stocks into financials, energy, and defensive sectors, causing the Nasdaq to finish the week under pressure despite favorable inflation data.

Summary: Comparing the impact of economic calendar news data with geopolitical risks/tensions, we can safely conclude that bullish economic data release alone, does not guarantee a bullish market. Macro data may shape an underlying narrative, but lasting price direction is ultimately governed by institutional positioning, sector rotation, earnings expectations, price action dynamics, and evolving geopolitical risks.
When you talk about inflation concerns is it a good one for nas100 or a bad one, because inflation came out as suprise, changing the narrative for the dollar, now your fundamentals should pick a side, is it the war that is driving, or inflation or profit taking so we can understand, you are combining everything all of them to the best of my knowledge can't be what is moving nas100 base on my fundamental knowledge,

1. Profit taking after the rally pushed the nas100 downwards

2 . The war resumption also pushed the us100 downwards too due to fear increasing

3. The us inflation doesn't have anything to do with nas100 going down because the inflation came out worse than expected even skipped expectations, so now if you really want to look at it from a fundamental bias the fed would consider rate cute, now when interest rate is considered investors run to techs and other risky assets so that would have given nas100 a strength but no , so what is really pushing the market this period is fear, and the war is the fear trigger

A
@asuquokelvin - 1 month ago
Quoted - nsg_usd

The timeframes do not always correlate in that manner. It may have taken 6 months for the first rally but might take more months for the next rally or less when the corrections end within your reaction boxes region, not exactly the same monthly duration, but will closely relate.

The reversal time from the monthly timeframe all depends on a risk on environment, when investors will want to buy risky assets, so we just wait but for now am waiting for a rally to that box level to look for possible sells

A
@asuquokelvin - 1 month ago
Quoted - nsg_usd

The timeframes do not always correlate in that manner. It may have taken 6 months for the first rally but might take more months for the next rally or less when the corrections end within your reaction boxes region, not exactly the same monthly duration, but will closely relate.

The reversal time from the monthly timeframe all depends on a risk on environment, when investors will want to buy risky assets, so we just wait but for now am waiting for a rally to that box level to look for possible sells

A
@asuquokelvin - 1 month ago
Quoted - nsg_usd

Alright. noted. We'll just watch and see. This war is even escalating more as Iran is just spreading strikes to US allies. They just hit Kuwait Oil site, let's hope market does not gap on monday. else this Nasdaq low will just break easily.

Price didn't really gap but retracing into the fvg level, and couldn't break below the 28400 level, like I said last week, that if that level doesn't break with strong volume that price will not give a huge sell into the monthly zone, so that is what is happening it's retracing to that fvg to react from there and continue

Disclaimer:

At MyTradingLand.com, we connect you with forex brokers and provide a community for traders. While we offer valuable information and resources, please note that we are not financial advisors and cannot provide personalized financial advice. Always conduct your own research and invest responsibly.

Community Guidelines: The MyTradingLand.com community is designed as a resource for forex traders, promoting respectful and constructive discussions. We reserve the right to remove any content that is misleading, abusive, or violates our terms of service.

Broker Information: While we may receive commissions or advertising income from some of the brokers listed, this does not imply an endorsement of any broker, nor does it affect our review process. Our evaluations are based solely on objective criteria and user feedback.

Always verify the regulatory status of any broker with your local financial authority, along with their terms and privacy policies, before engaging with them. It is crucial to conduct thorough research to ensure that you are making informed decisions.

Risk Warning: At MyTradingLand.com, we strive to provide accurate information; however, the forex market is highly volatile and can change rapidly. It is essential to verify any information before making investment decisions.

Please be aware that trading in forex involves substantial risk, and it is possible to lose more than your trading equity/investment capital. 70-90% of retail CFD traders incur losses in their trading activities as per information from various brokers.

You are solely responsible for your use of MyTradingLand.com and any trading decisions you make. We encourage all users to educate themselves thoroughly about forex trading and to consider seeking advice from qualified financial professionals.

Advertising Disclosure: We may earn commissions from recommended brokers, but our reviews are independent (not influenced by potential earnings). Sponsored content is clearly marked and doesn't reflect our views.

©2026 ©2025 All rights reserved Mytradingland.com