NASDAQ weekly Projections

1 2 ... 31 32 33 34 35 36 37 38 39 40 Next »
N
@nsg_usd - 1 hour ago

NAS 100 weekly summary

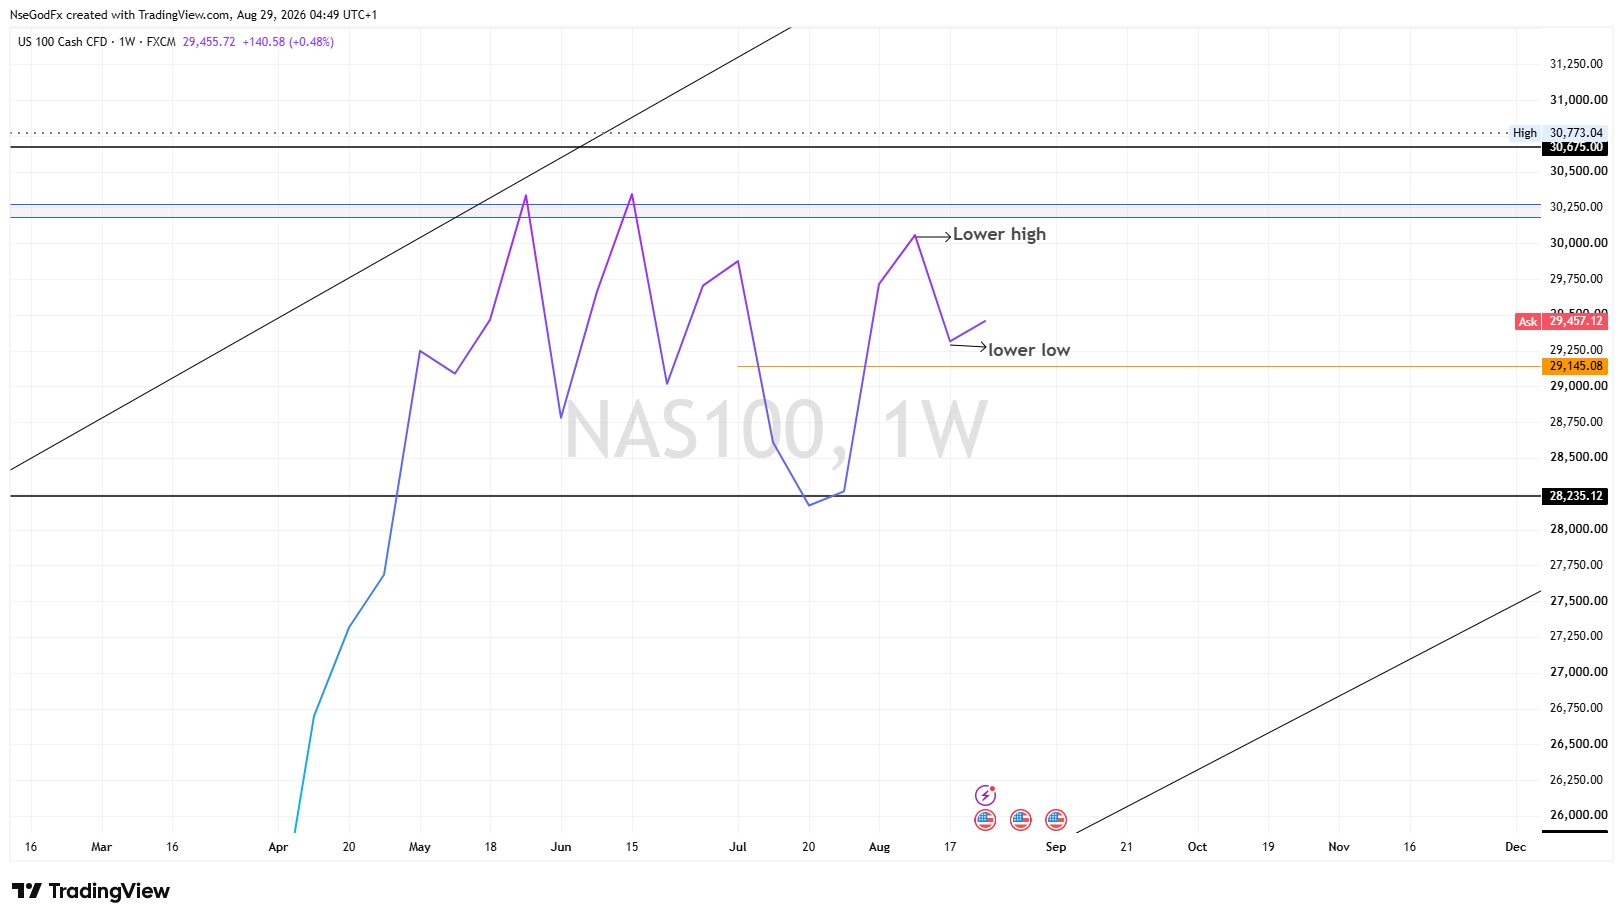
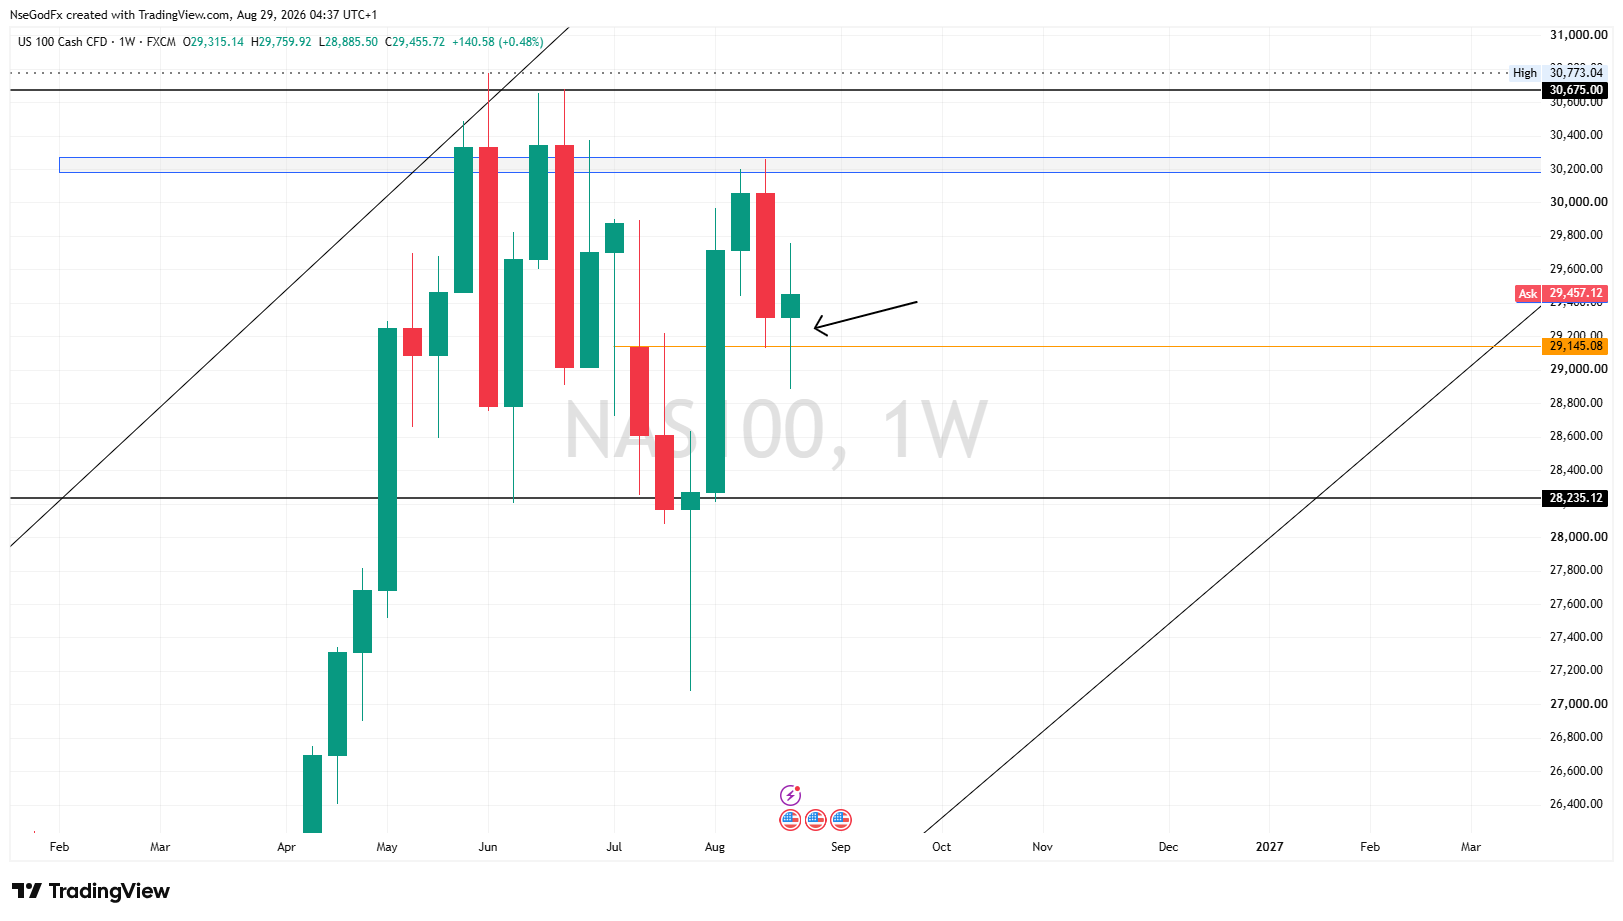
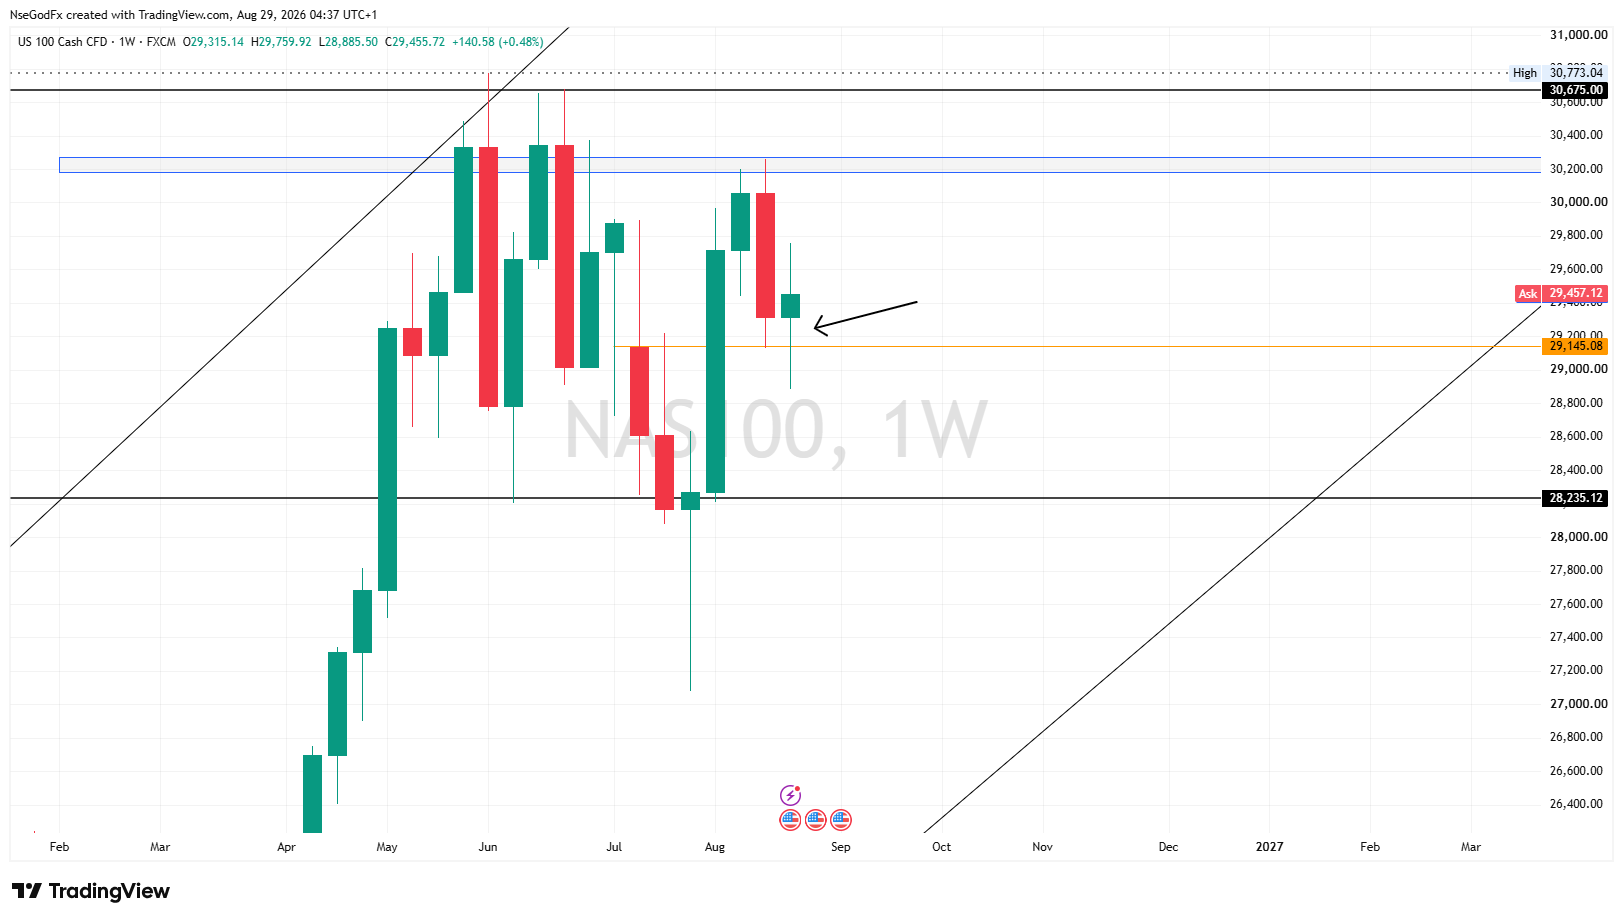
Nas 100 started the week with sells on Monday, then followed by buys on Tuesdays, Wednesdays and Thursdays, and then closed on Friday with sells, forming a weekly low at the 29315 price Level.

N
@nsg_usd - 1 hour ago
Quoted - nsg_usd

NAS 100 weekly summary

Nas 100 started the week with sells on Monday, then followed by buys on Tuesdays, Wednesdays and Thursdays, and then closed on Friday with sells, forming a weekly low at the 29315 price Level.

With the weekly low formed, price has created a Lower low after creating a Lower High last week.
I'll be expecting price to create a Lower High Next week, in preparation for sells next month.
This will now show a downward sequence.

N
@nsg_usd - 53 minutes ago
Quoted - nsg_usd

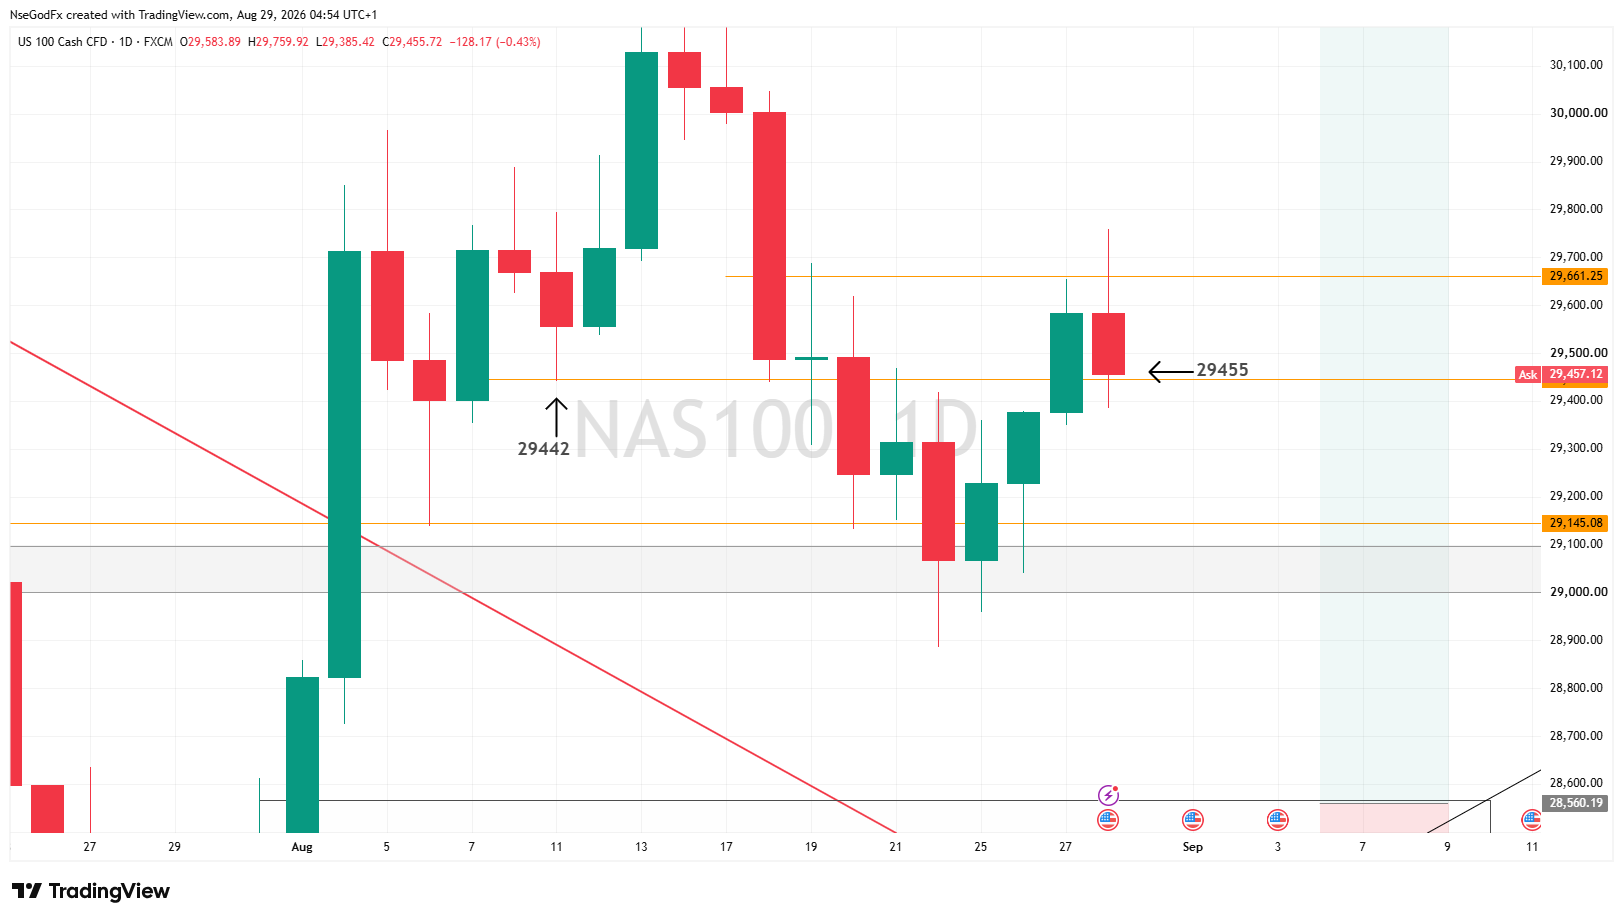
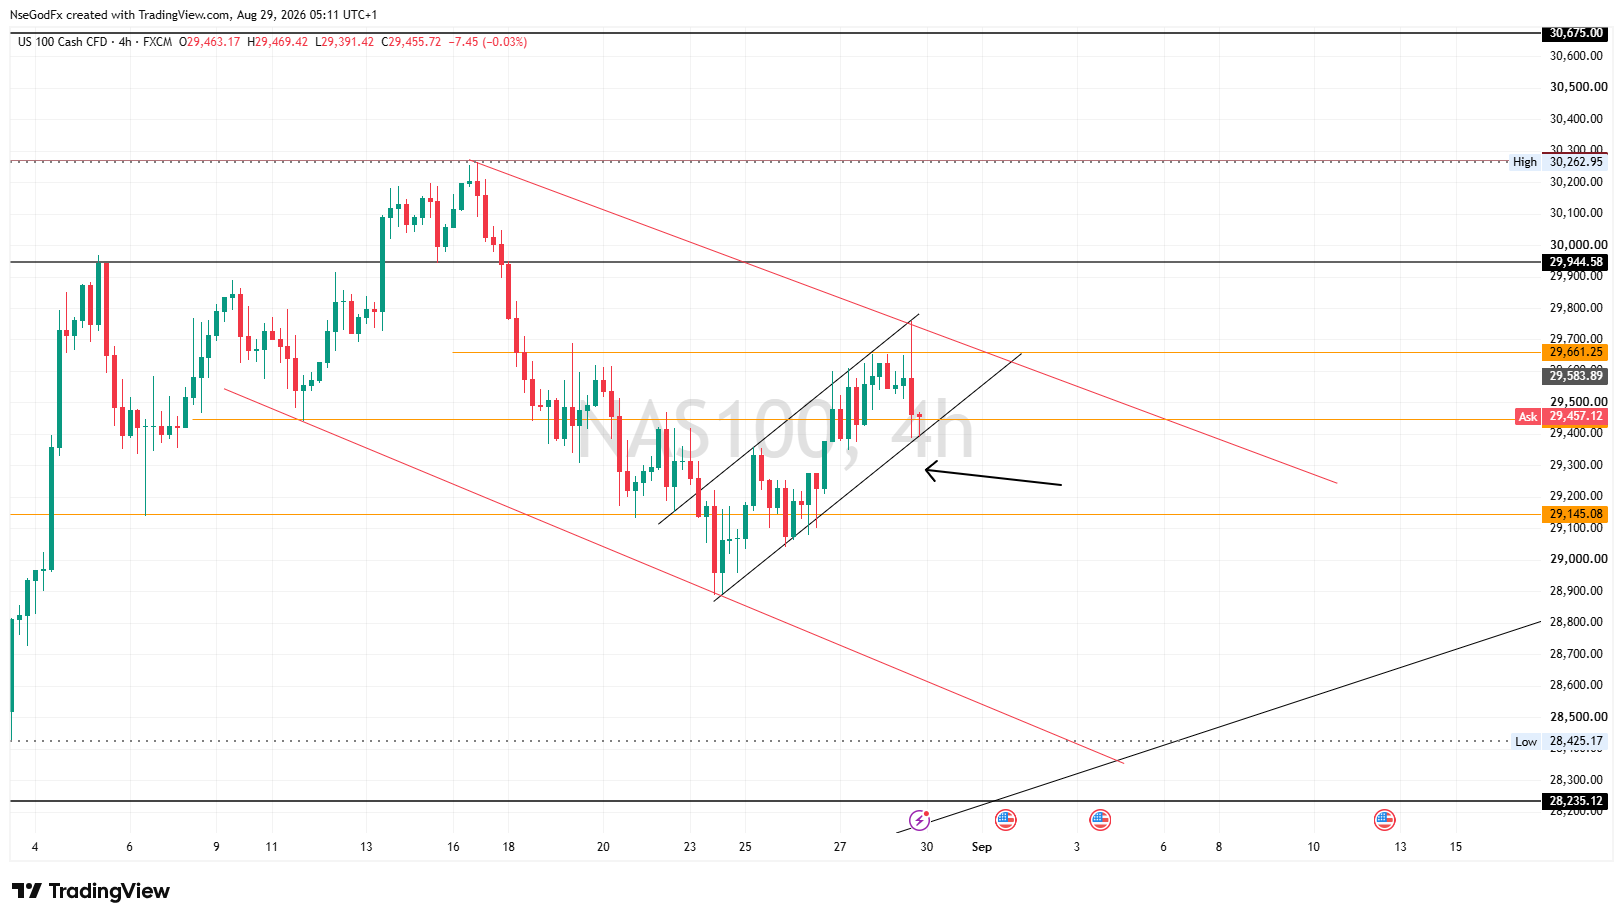
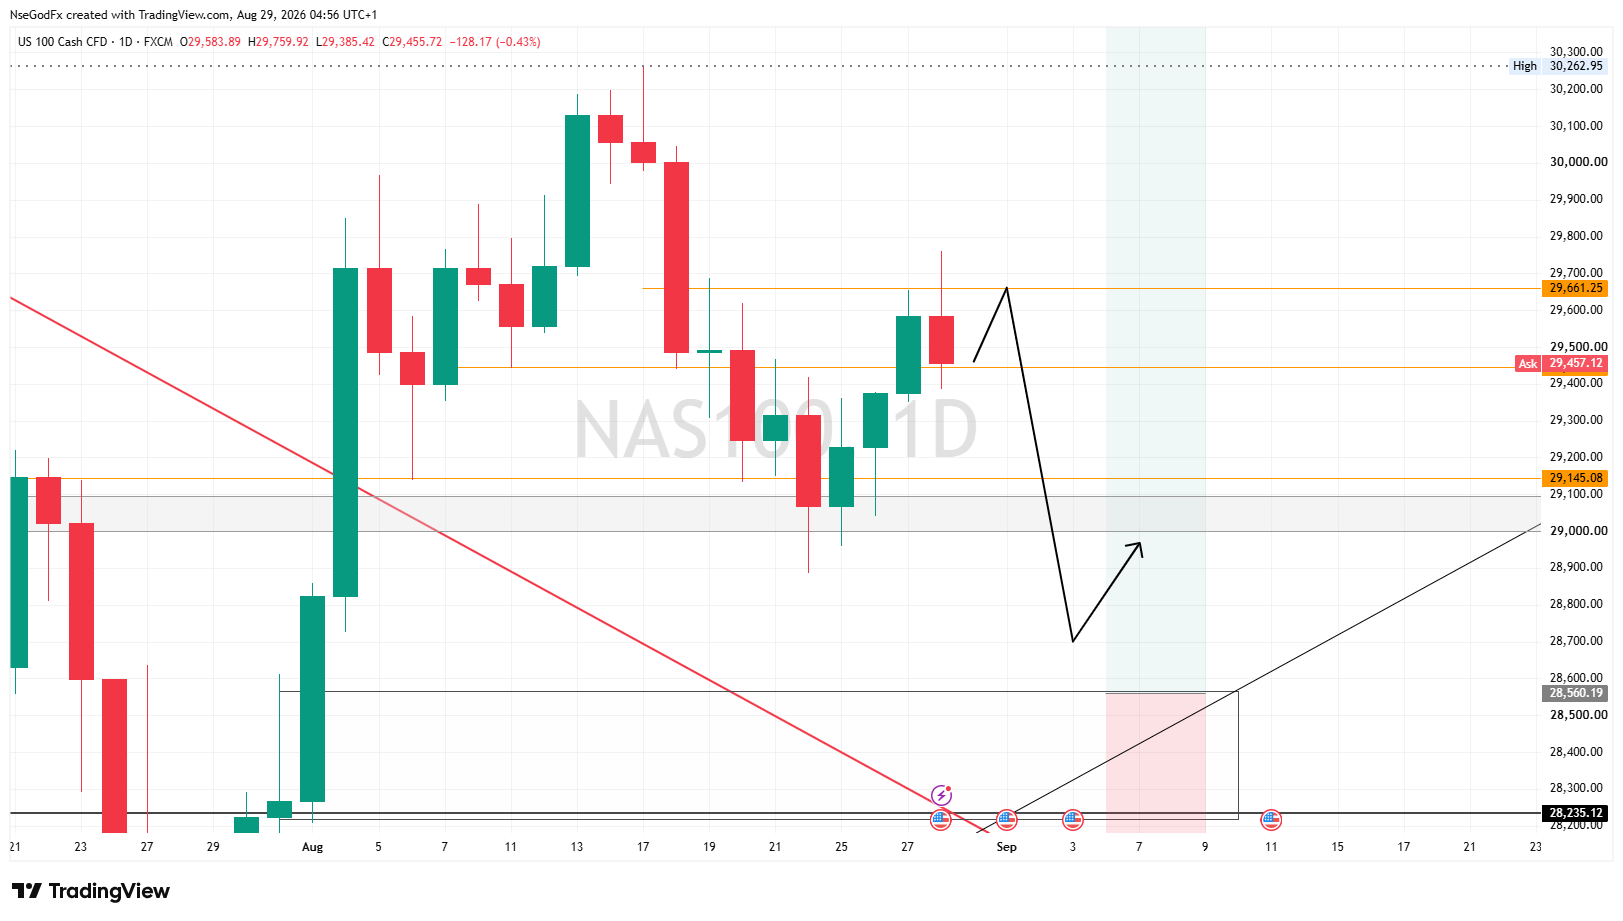
Nas 100- on the Daily, the Lower high and lower low sequence is clearer, where price close at 29455 close to previous 2 week's low at 29442.

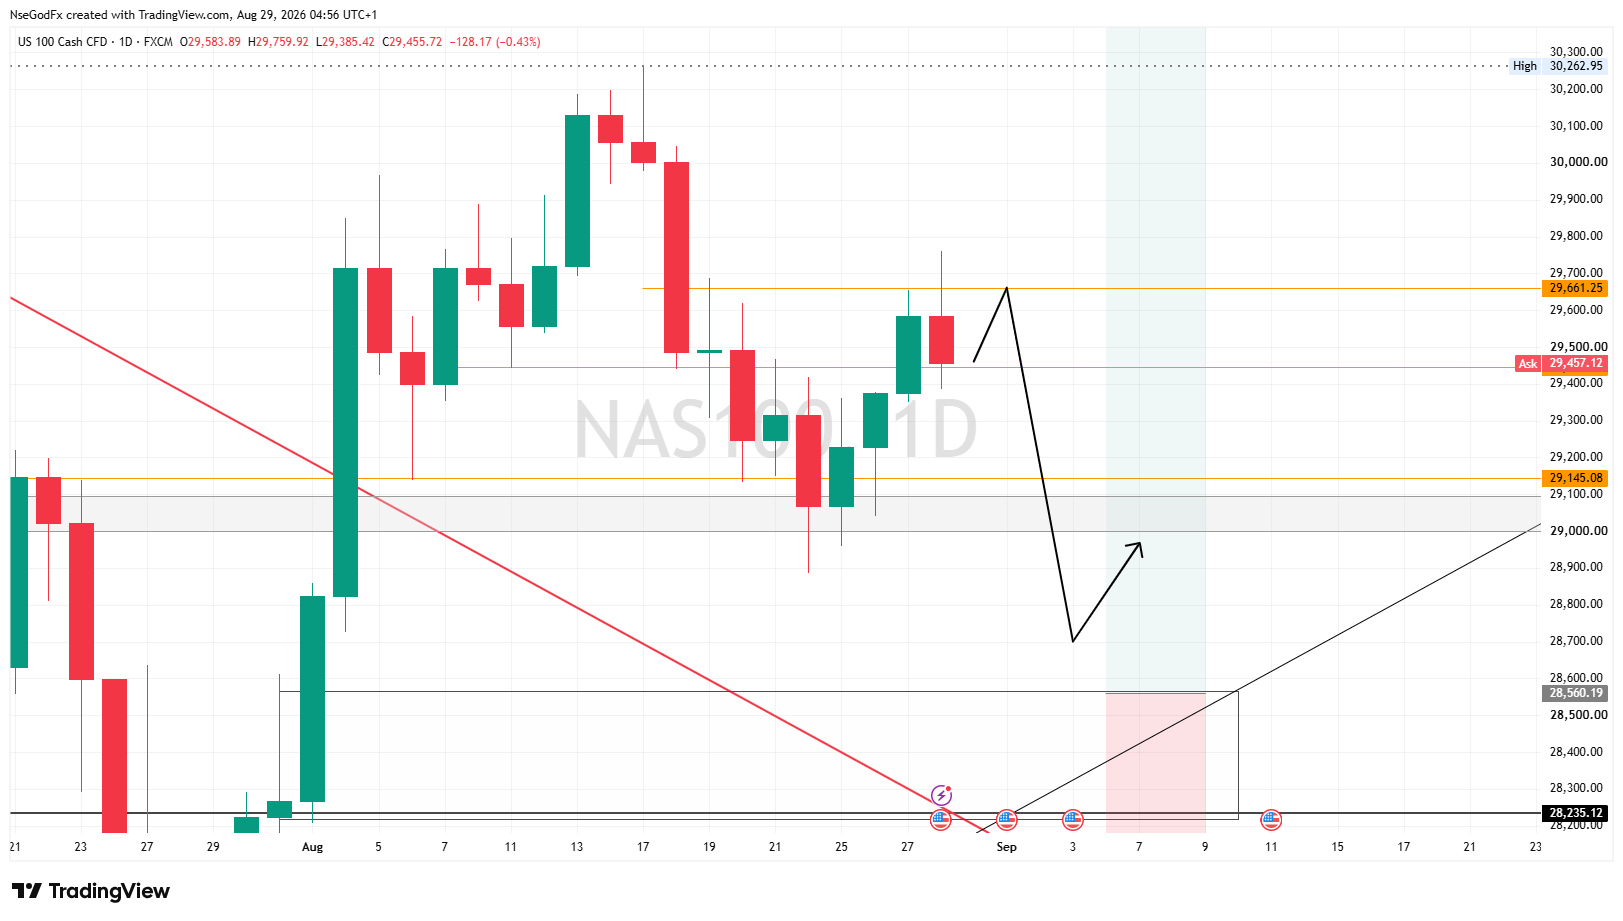
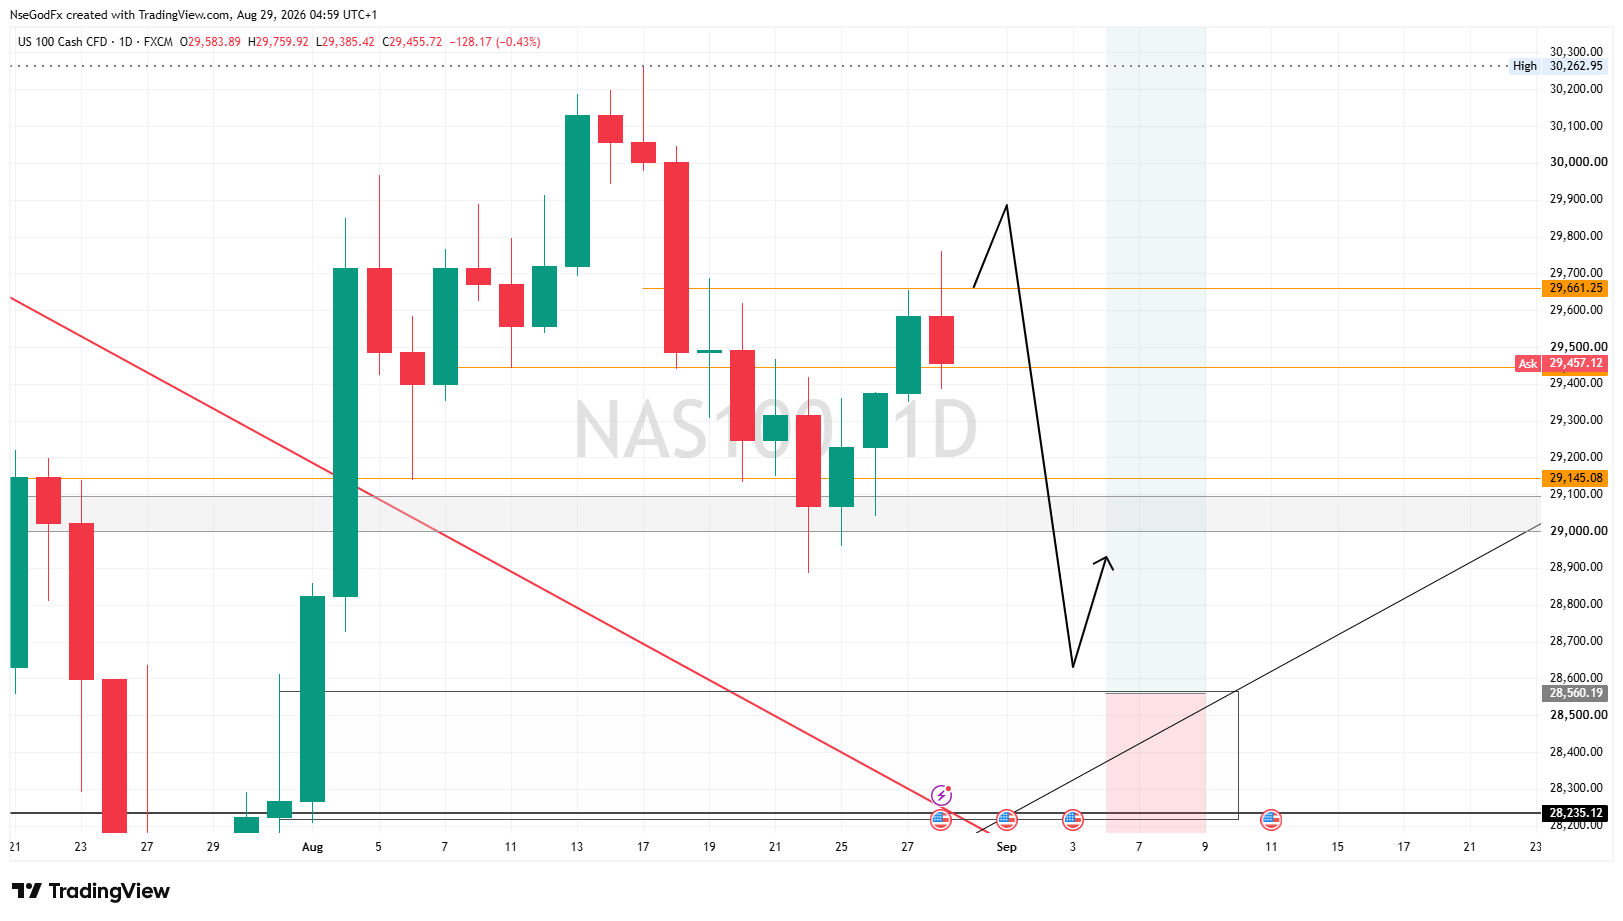
My projection on the daily next week is for price to start with Buys, rallying up to 29661-29700 price level first, then decide either to break above and head to 29900, or retreat down to the full-blown sells down to 29000.

N
@nsg_usd - 45 minutes ago
Quoted - nsg_usd

My projection on the daily next week is for price to start with Buys, rallying up to 29661-29700 price level first, then decide either to break above and head to 29900, or retreat down to the full-blown sells down to 29000.

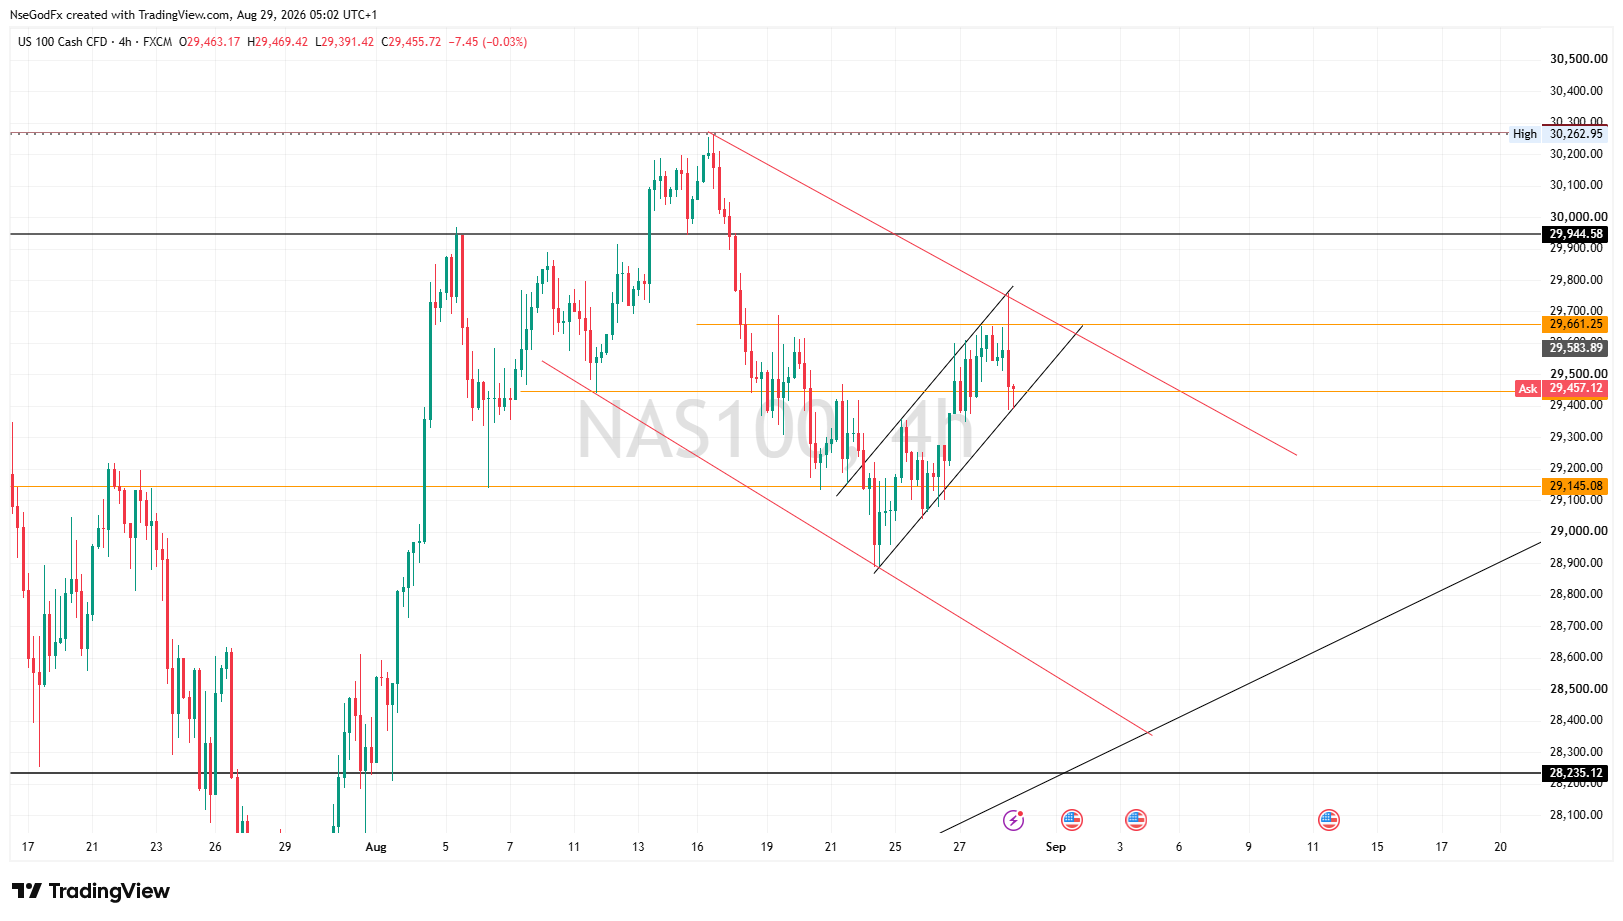
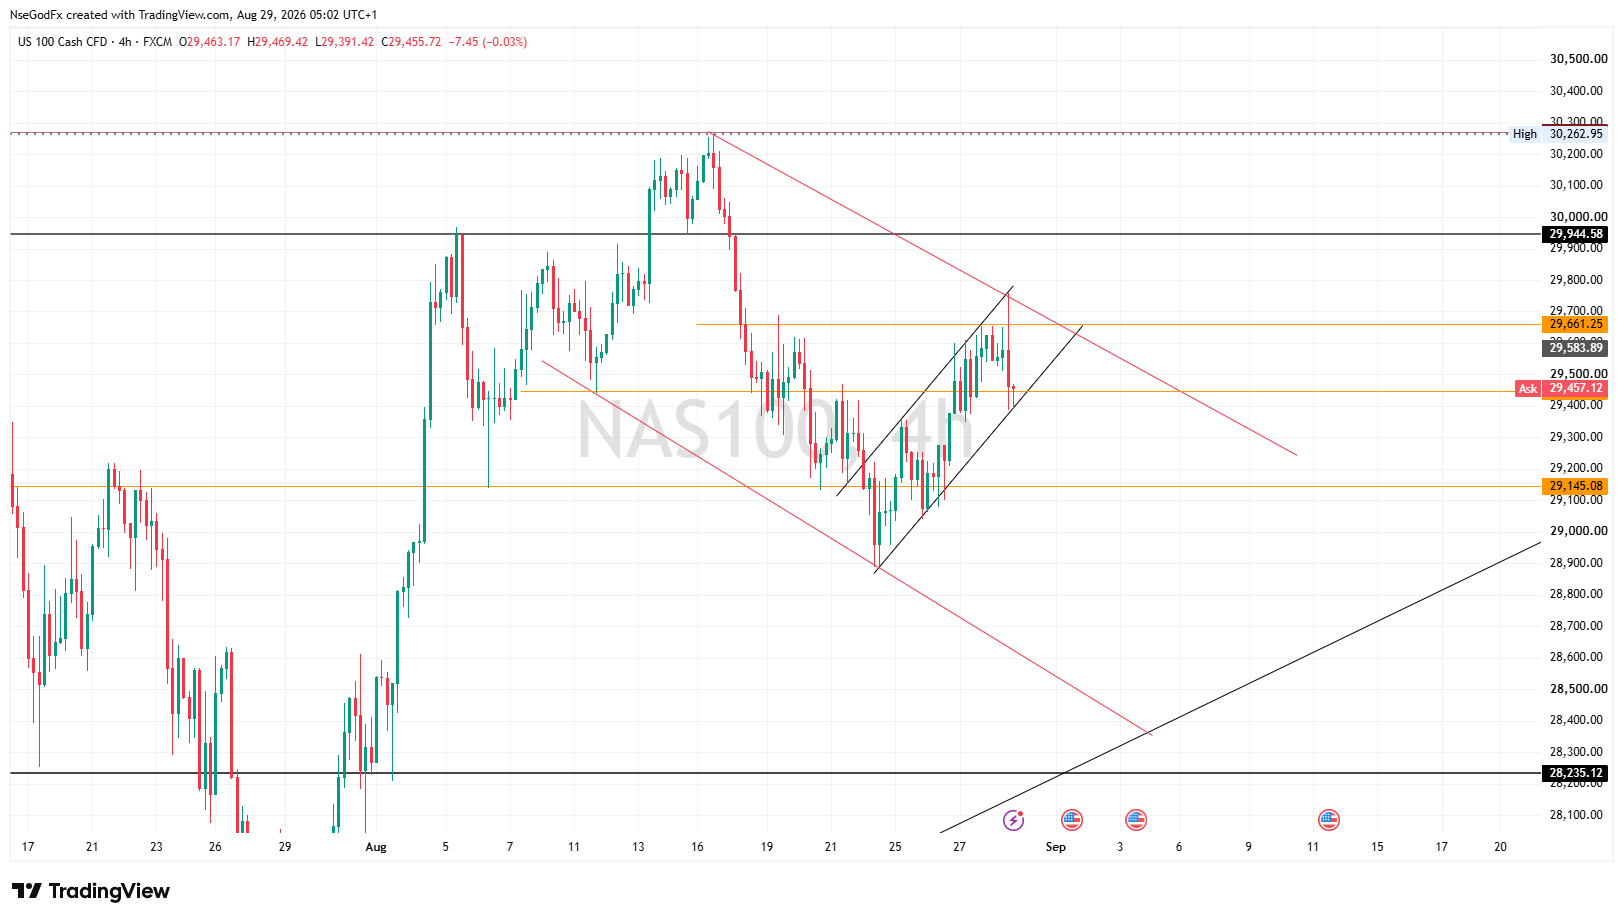
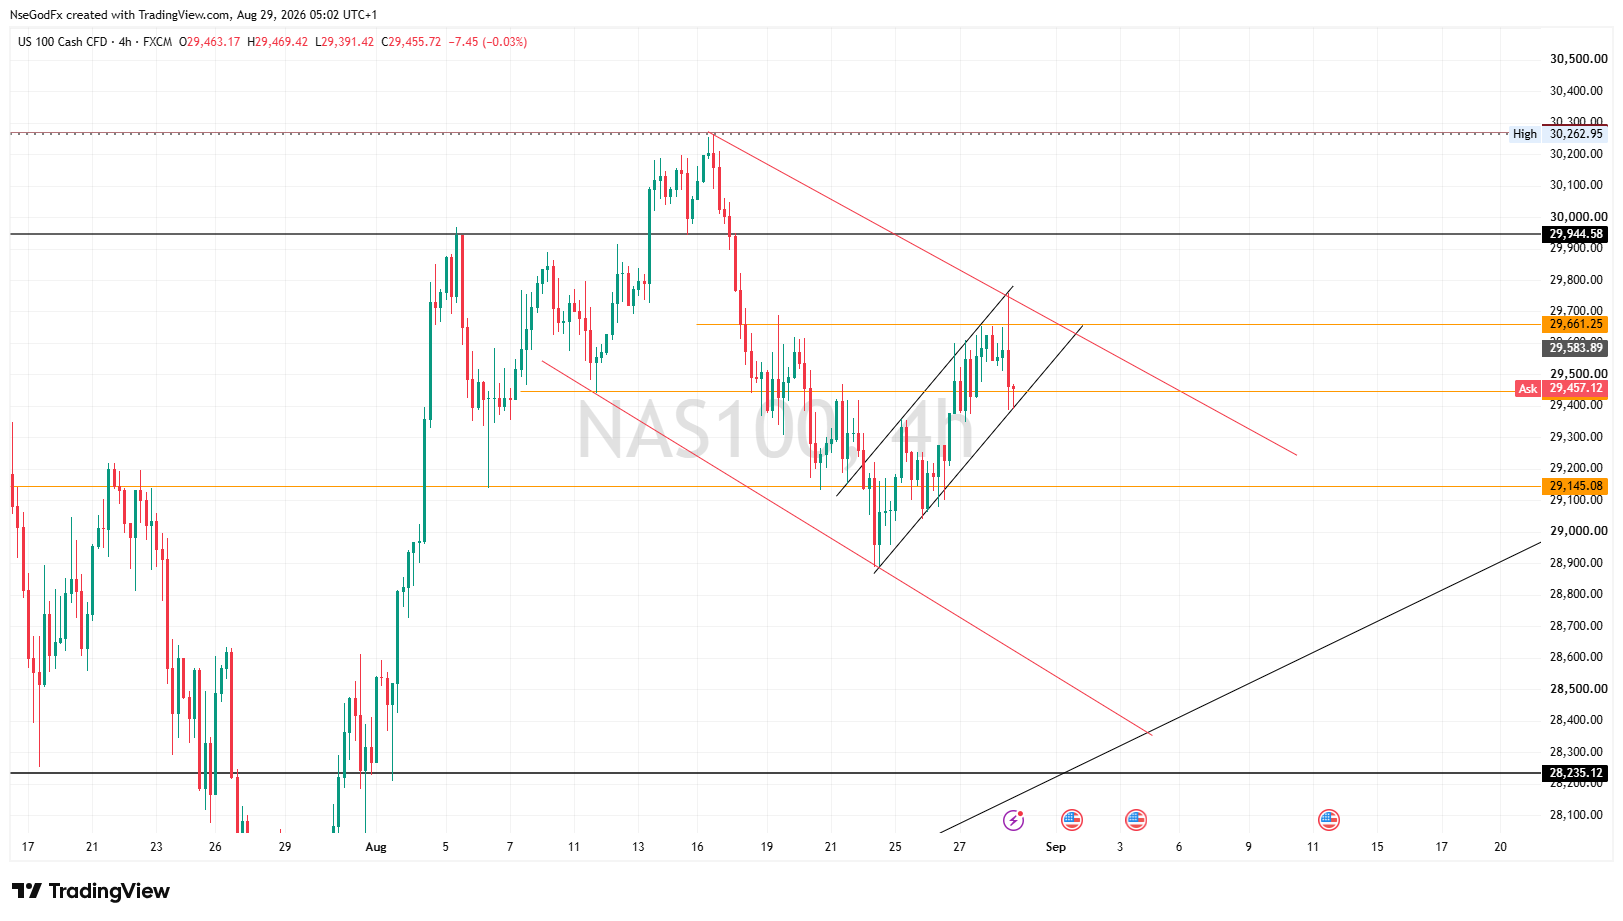
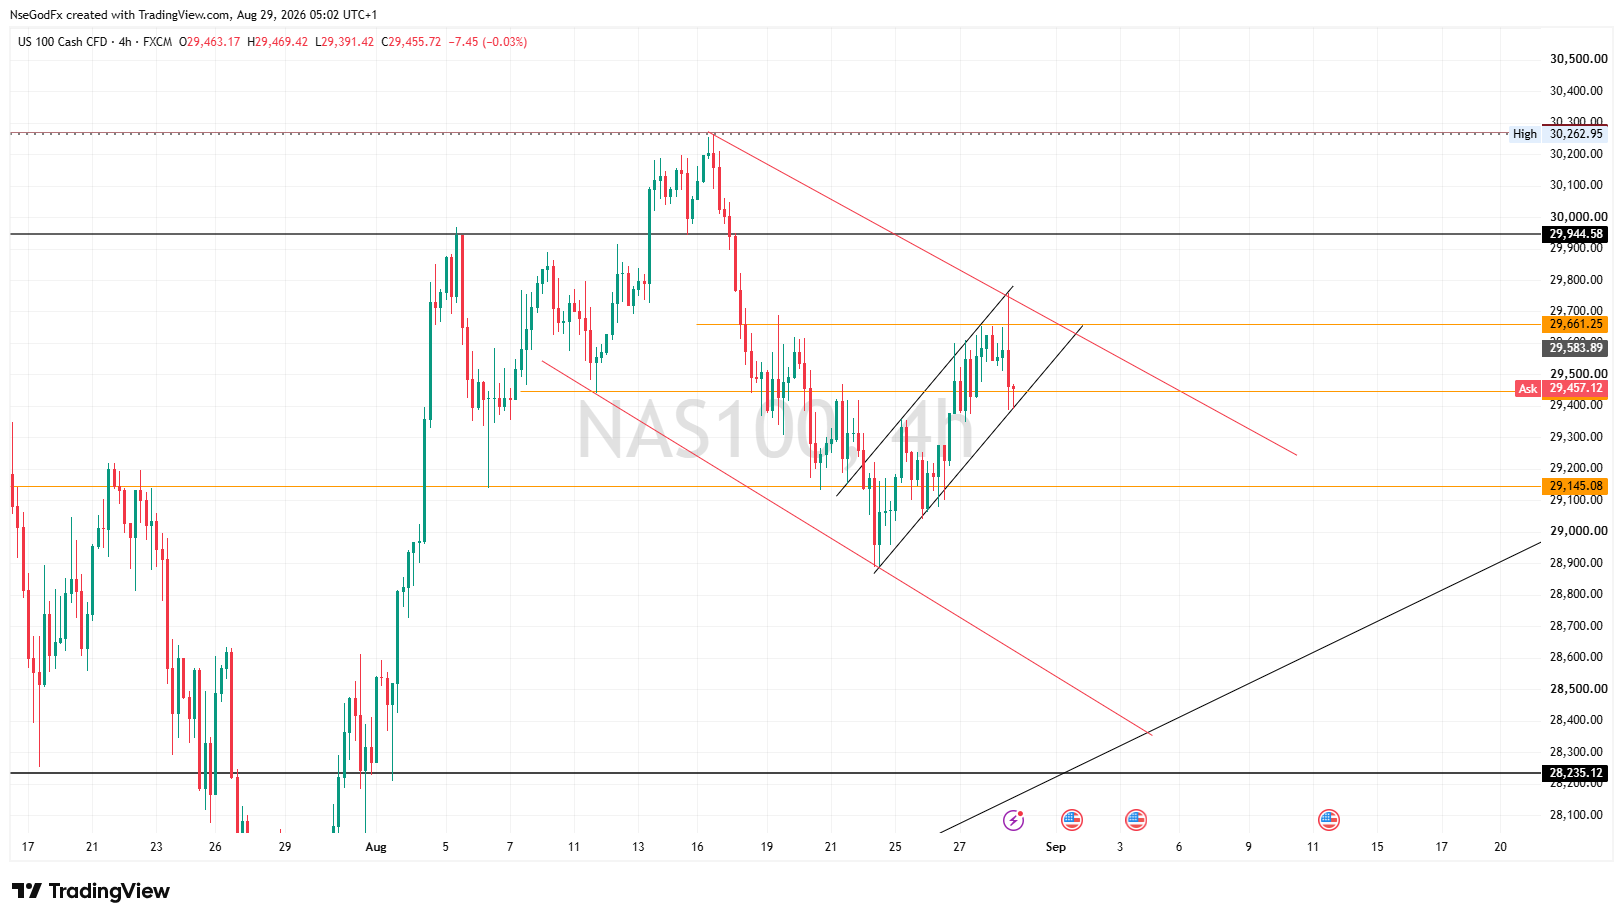
NAS 100- on the 4hr, Price has created two things. First price has created a 4hr bearish channel. showing that intraday is bearish.
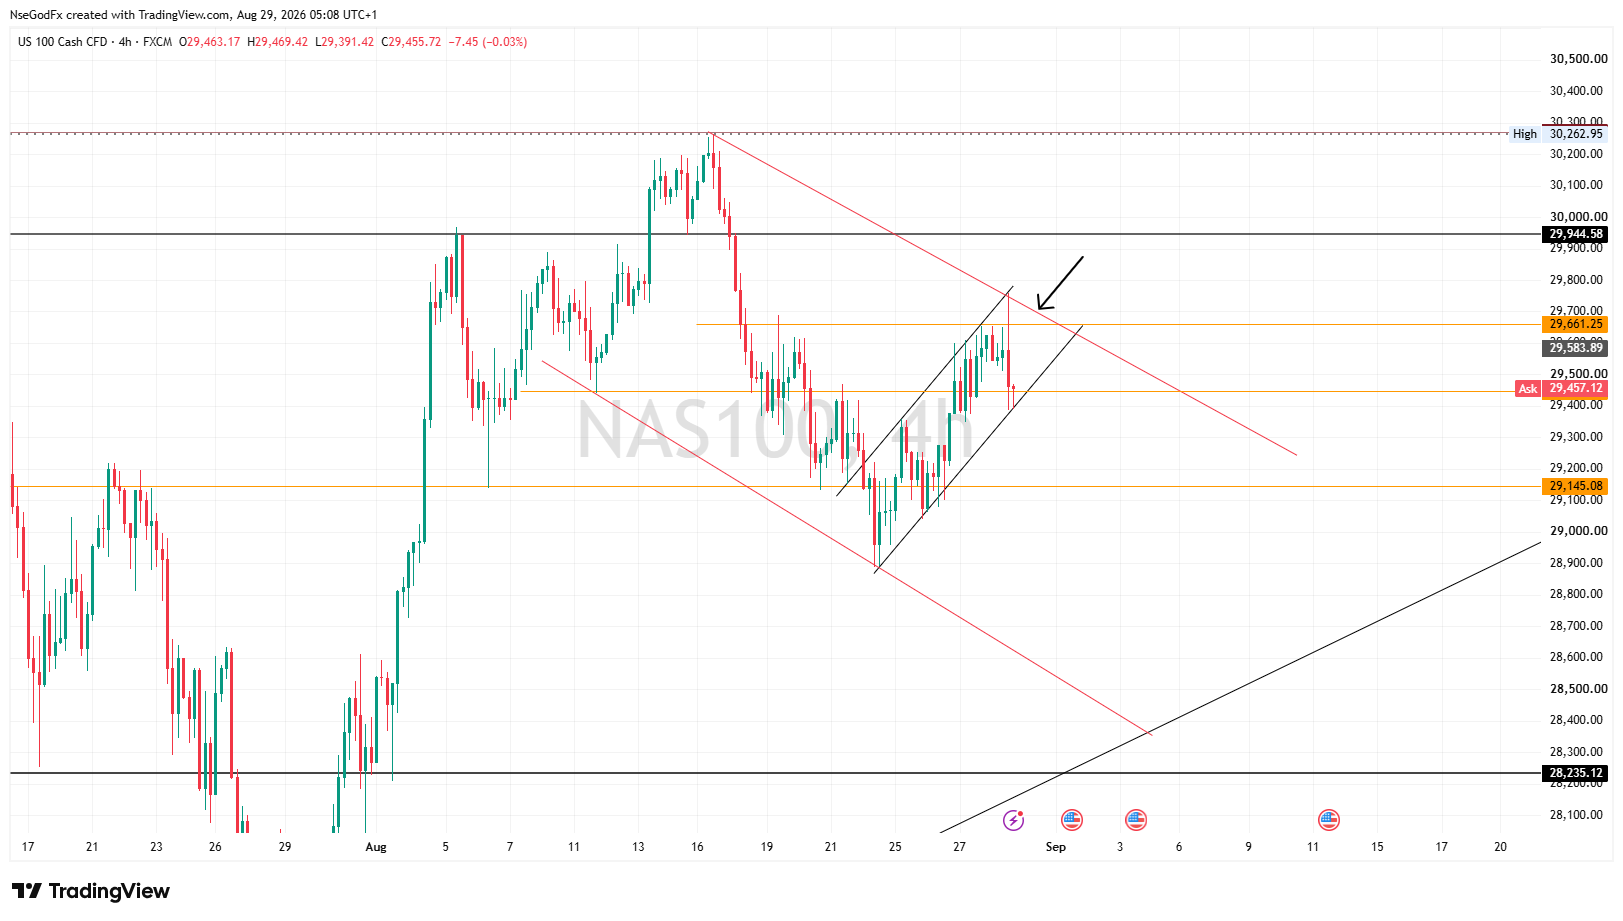
And price currently is at the upper boundaries of the trend channel which acts as a trend resistance that instigated the sells that closed the week.

N
@nsg_usd - 42 minutes ago
Quoted - nsg_usd

NAS 100- on the 4hr, Price has created two things. First price has created a 4hr bearish channel. showing that intraday is bearish.
And price currently is at the upper boundaries of the trend channel which acts as a trend resistance that instigated the sells that closed the week.

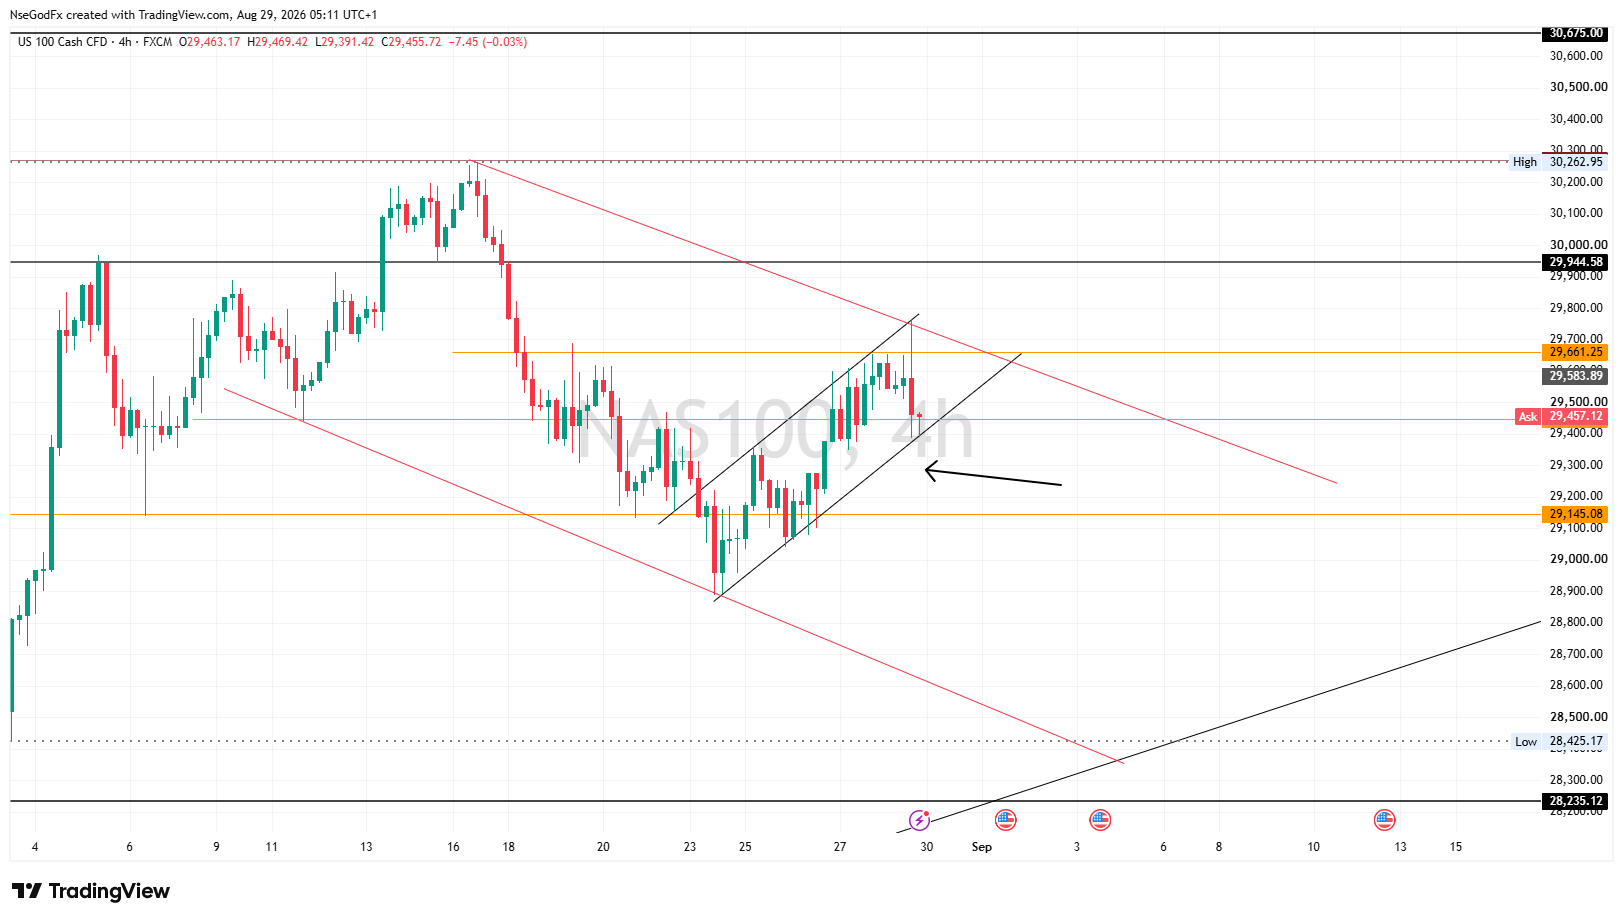
The second Thing visible on the 4hr Timeframe is the bearish flag pattern. This pattern is a bullish consolidation phase inside a bearish intraday trend channel. A breakout from this flag pattern to the downside will further confirm price is ready to continue the sells downwards, and this is where a lot of patience is required.

N
@nsg_usd - 30 minutes ago
Quoted - nsg_usd

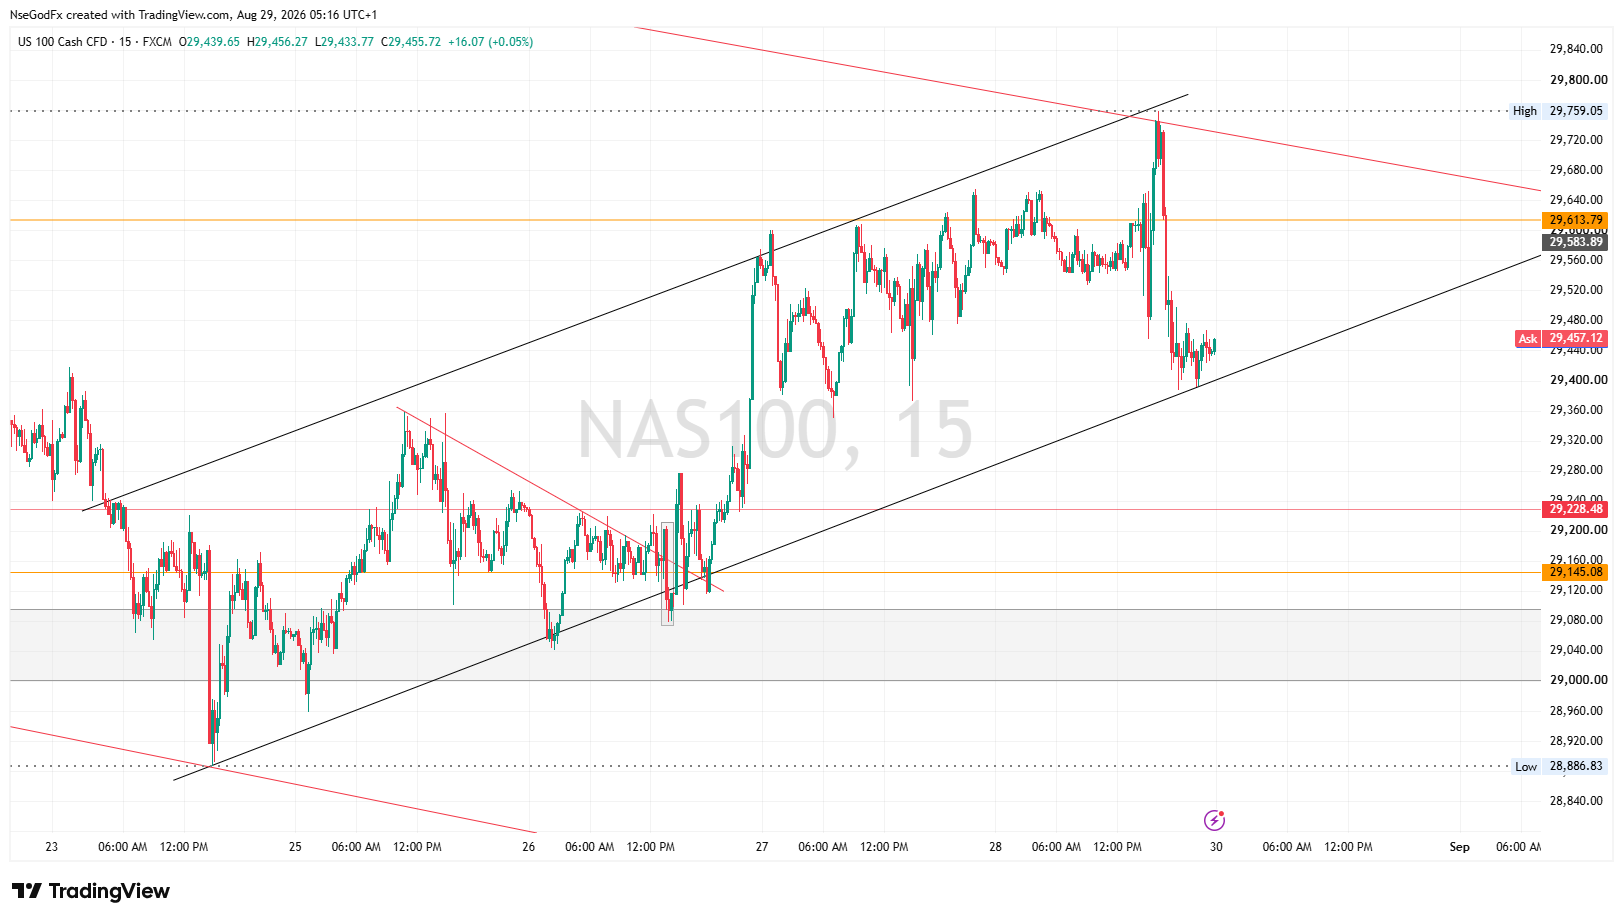
Also to note about this bearish flag pattern is that it represents the Lower timeframe direction and, in this case, Lower timeframe is bullish, intraday is bearish, and HTF is Bearish.

NAS 100- So, what we are waiting for next week, is to see the LTF align with the Intraday, and HTF. Without that alignment, every other sell while price is still confined to the bearish flag is more prone to premature sells and stop hunts.
Also to note, the LTF can continue in the bullish direction in order to adjust the intraday channel, to a more convenient Higher High, at around 29900, or 30,000 before going for massive sells.

N
@nsg_usd - 20 minutes ago
Quoted - nsg_usd

Nas 100- Trade Idea and Approach (next week)
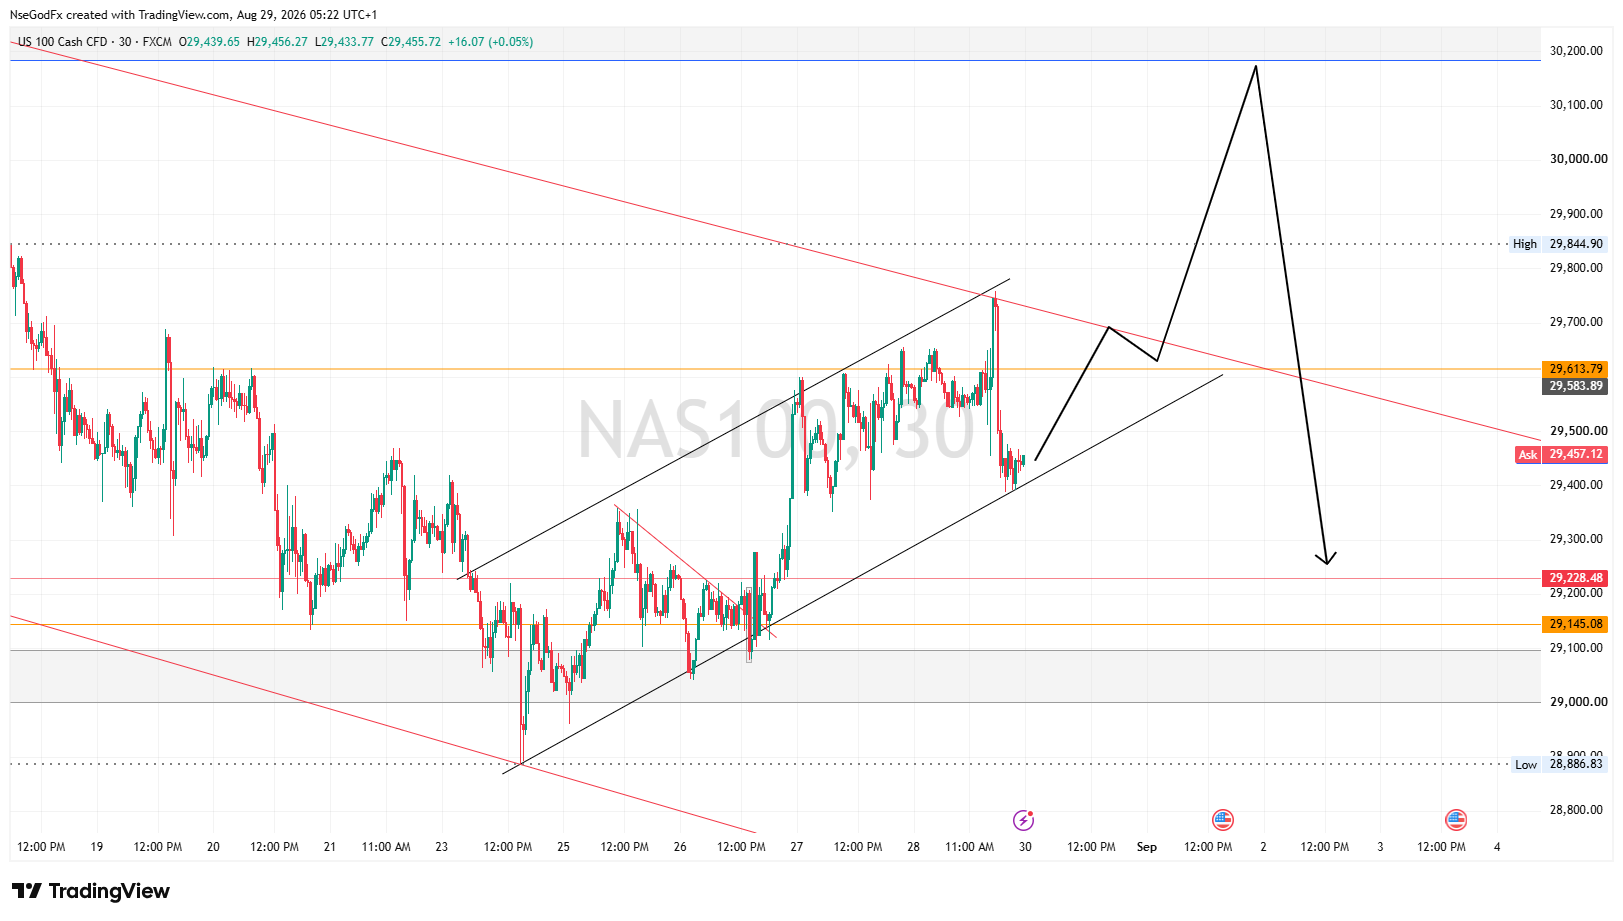
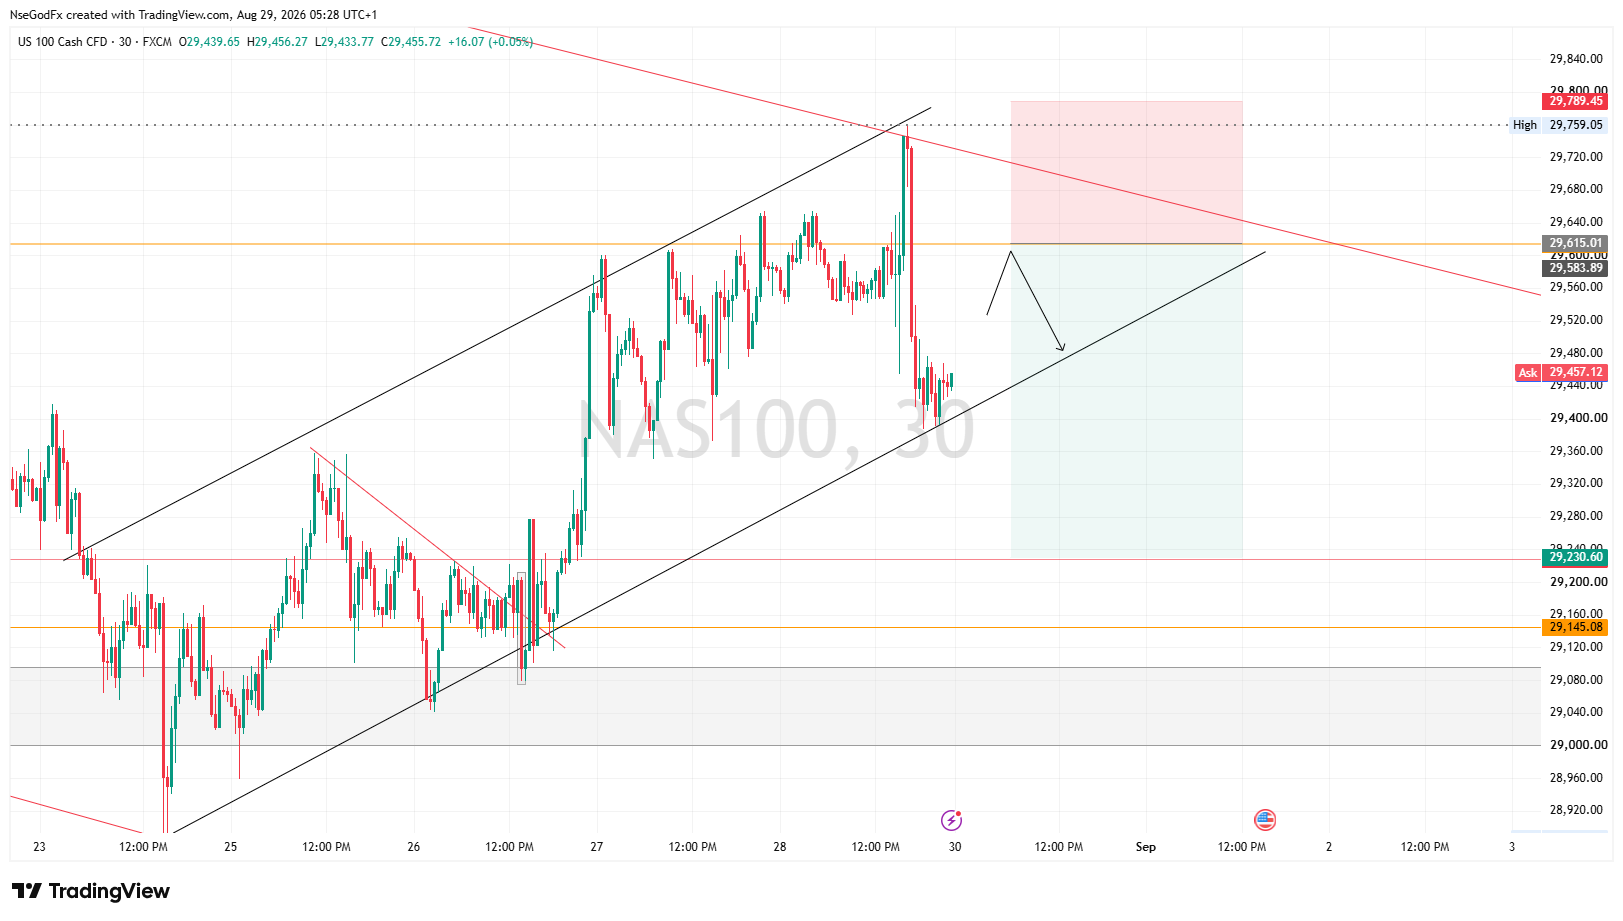
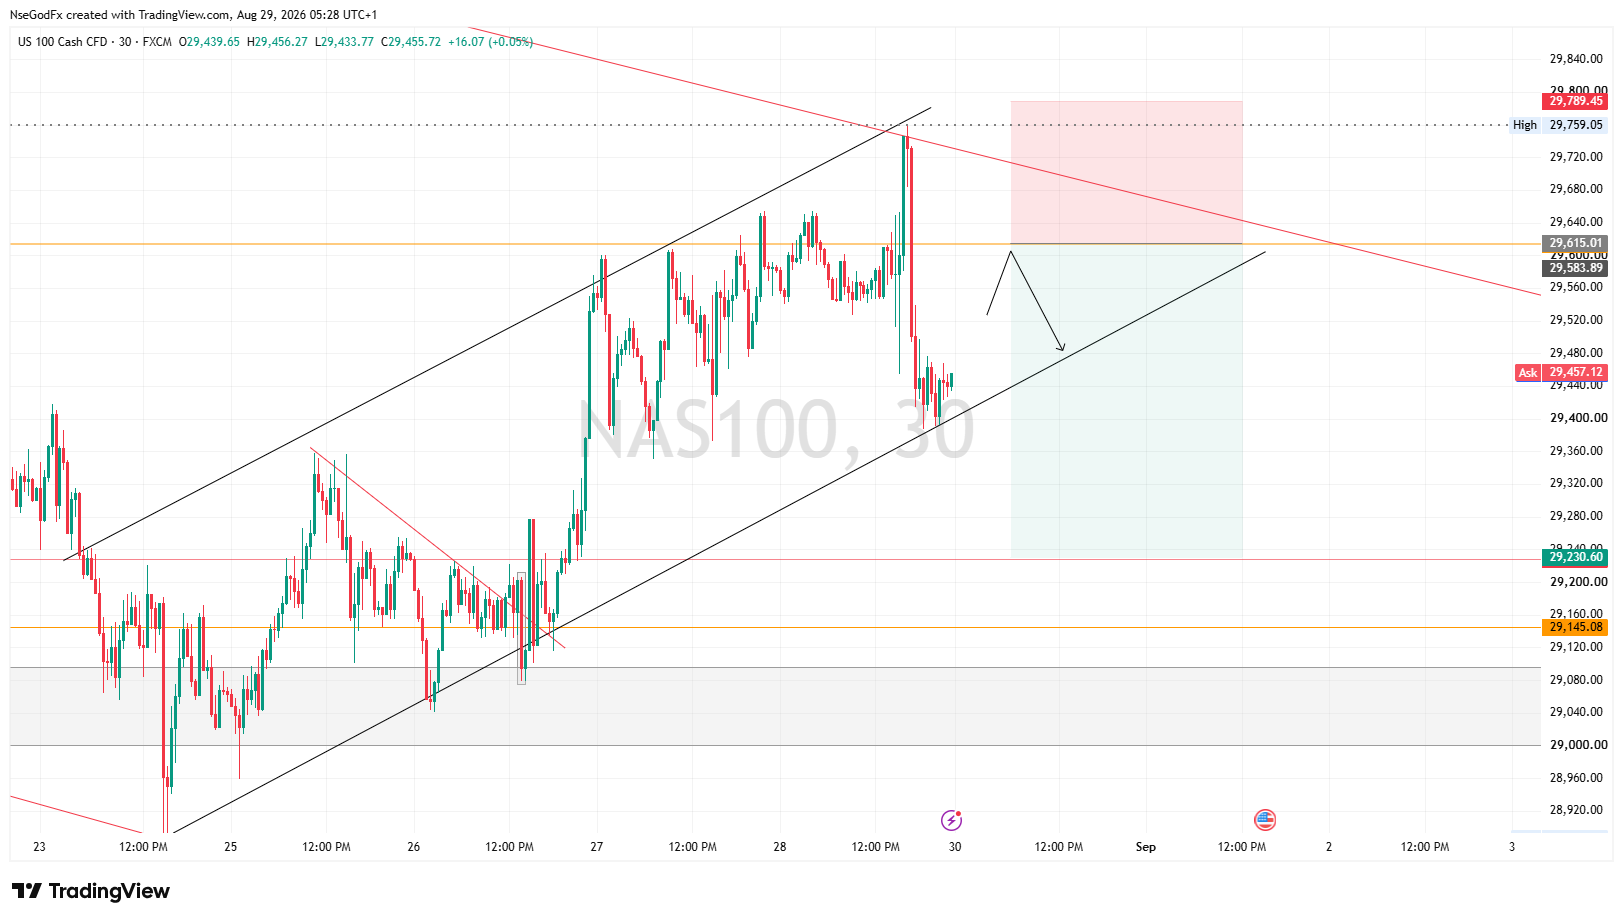
While waiting for LTF to align completely with the Intraday and HTF, I'll look for sells on 30mins.
Entry-29615
SL-29800
TP-29200

In summary, for next week, I'll be watching out for more sells than buys, but I'll look forward to seeing Monday start with buys, and Friday ending with sells forming a Lower High.

1 2 ... 31 32 33 34 35 36 37 38 39 40 Next »

Disclaimer:

At MyTradingLand.com, we connect you with forex brokers and provide a community for traders. While we offer valuable information and resources, please note that we are not financial advisors and cannot provide personalized financial advice. Always conduct your own research and invest responsibly.

Community Guidelines: The MyTradingLand.com community is designed as a resource for forex traders, promoting respectful and constructive discussions. We reserve the right to remove any content that is misleading, abusive, or violates our terms of service.

Broker Information: While we may receive commissions or advertising income from some of the brokers listed, this does not imply an endorsement of any broker, nor does it affect our review process. Our evaluations are based solely on objective criteria and user feedback.

Always verify the regulatory status of any broker with your local financial authority, along with their terms and privacy policies, before engaging with them. It is crucial to conduct thorough research to ensure that you are making informed decisions.

Risk Warning: At MyTradingLand.com, we strive to provide accurate information; however, the forex market is highly volatile and can change rapidly. It is essential to verify any information before making investment decisions.

Please be aware that trading in forex involves substantial risk, and it is possible to lose more than your trading equity/investment capital. 70-90% of retail CFD traders incur losses in their trading activities as per information from various brokers.

You are solely responsible for your use of MyTradingLand.com and any trading decisions you make. We encourage all users to educate themselves thoroughly about forex trading and to consider seeking advice from qualified financial professionals.

Advertising Disclosure: We may earn commissions from recommended brokers, but our reviews are independent (not influenced by potential earnings). Sponsored content is clearly marked and doesn't reflect our views.

©2026 ©2025 All rights reserved Mytradingland.com