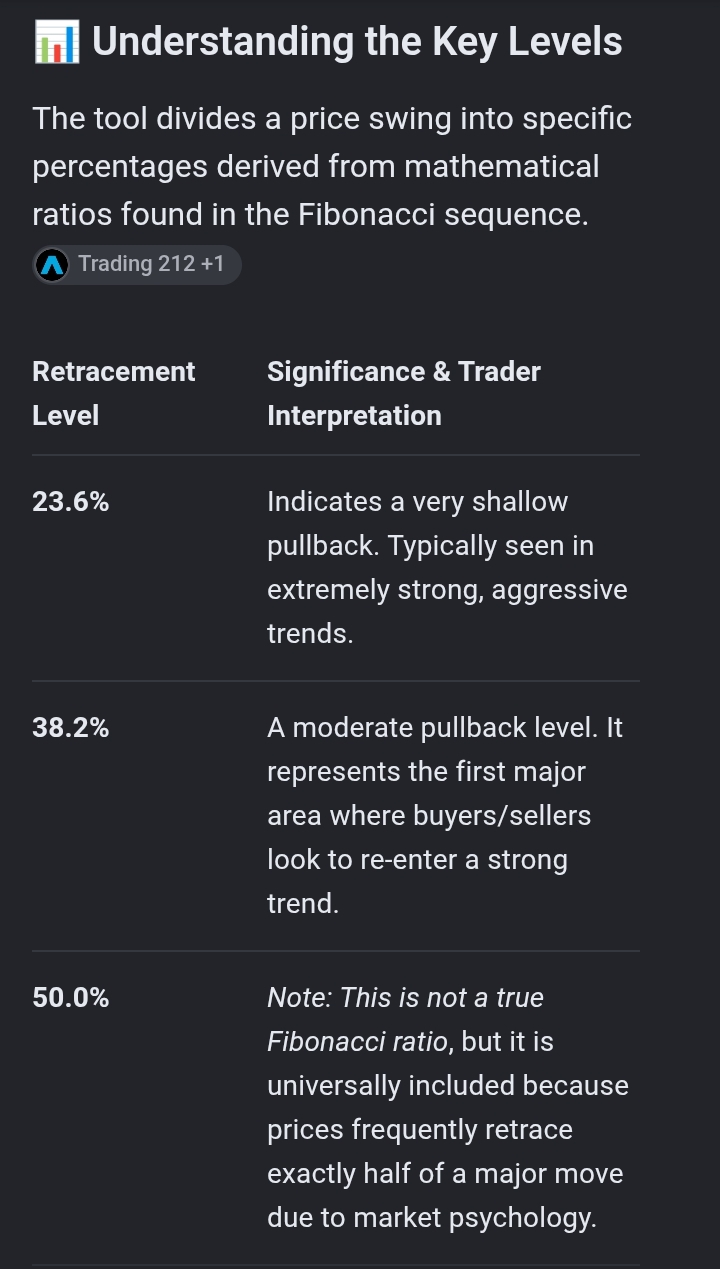
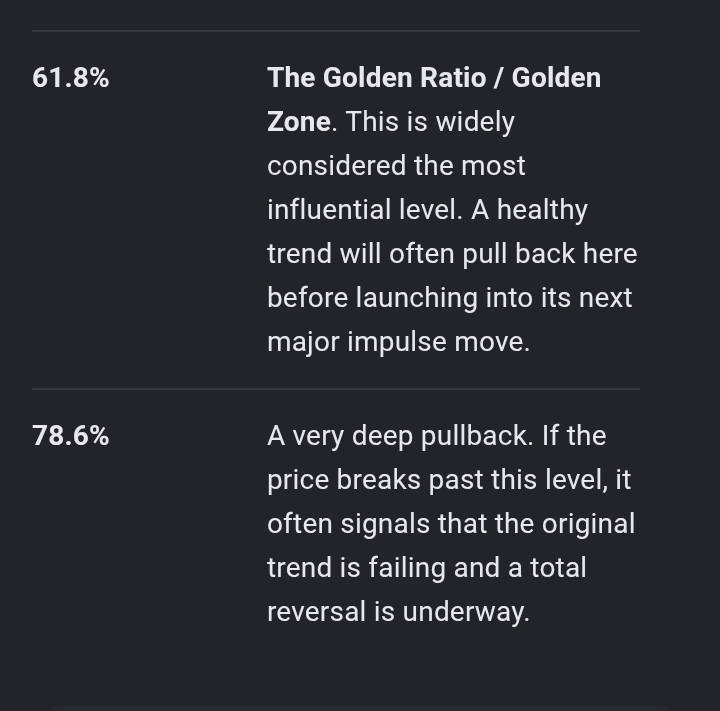
Fibonacci retracement is a popular technical analysis tool used by traders to identify potential support and resistance levels where an asset’s price might pause, reverse, or continue its prevailing trend. It is plotted as static horizontal lines on a price chart, representing percentages of a previous significant price movement