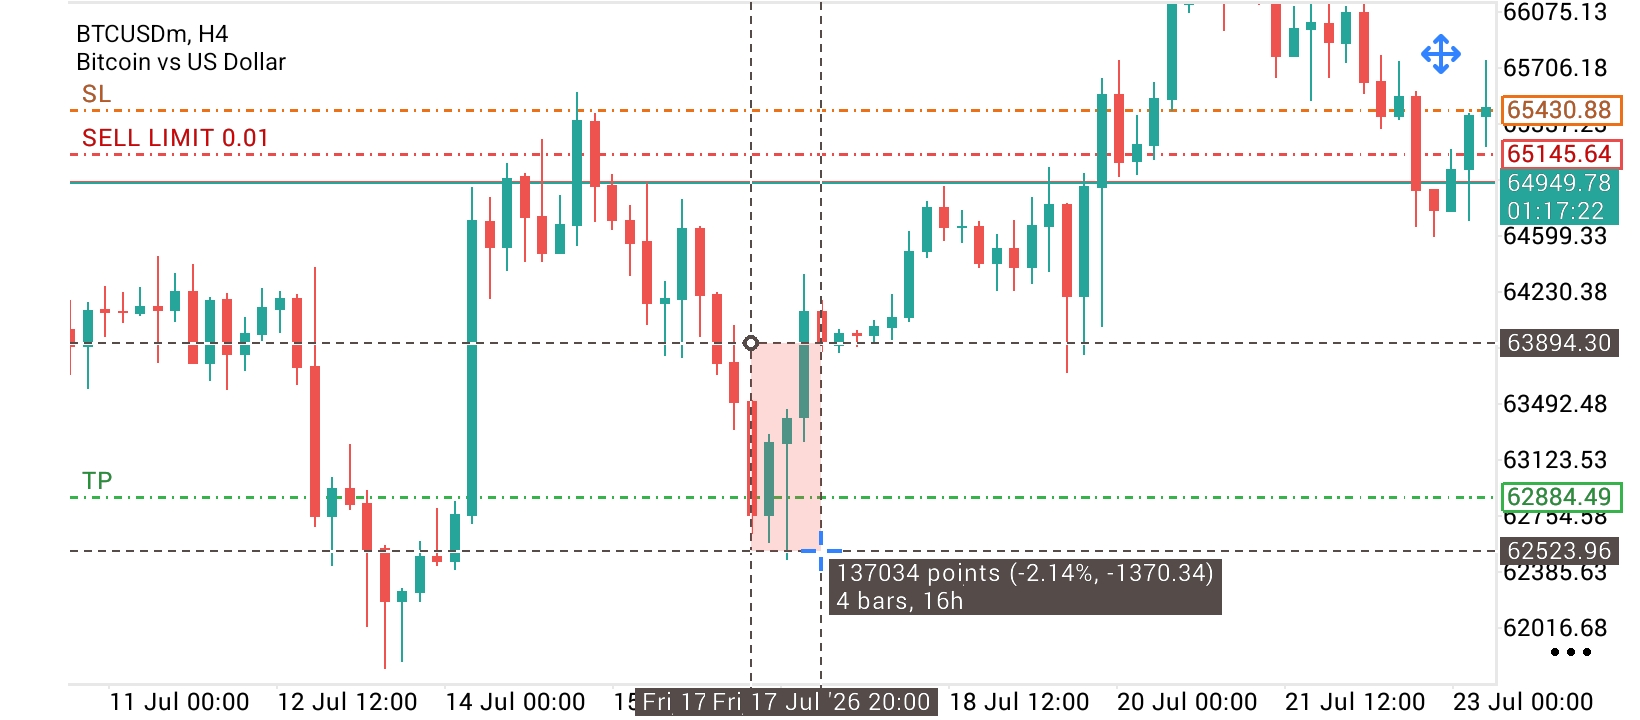
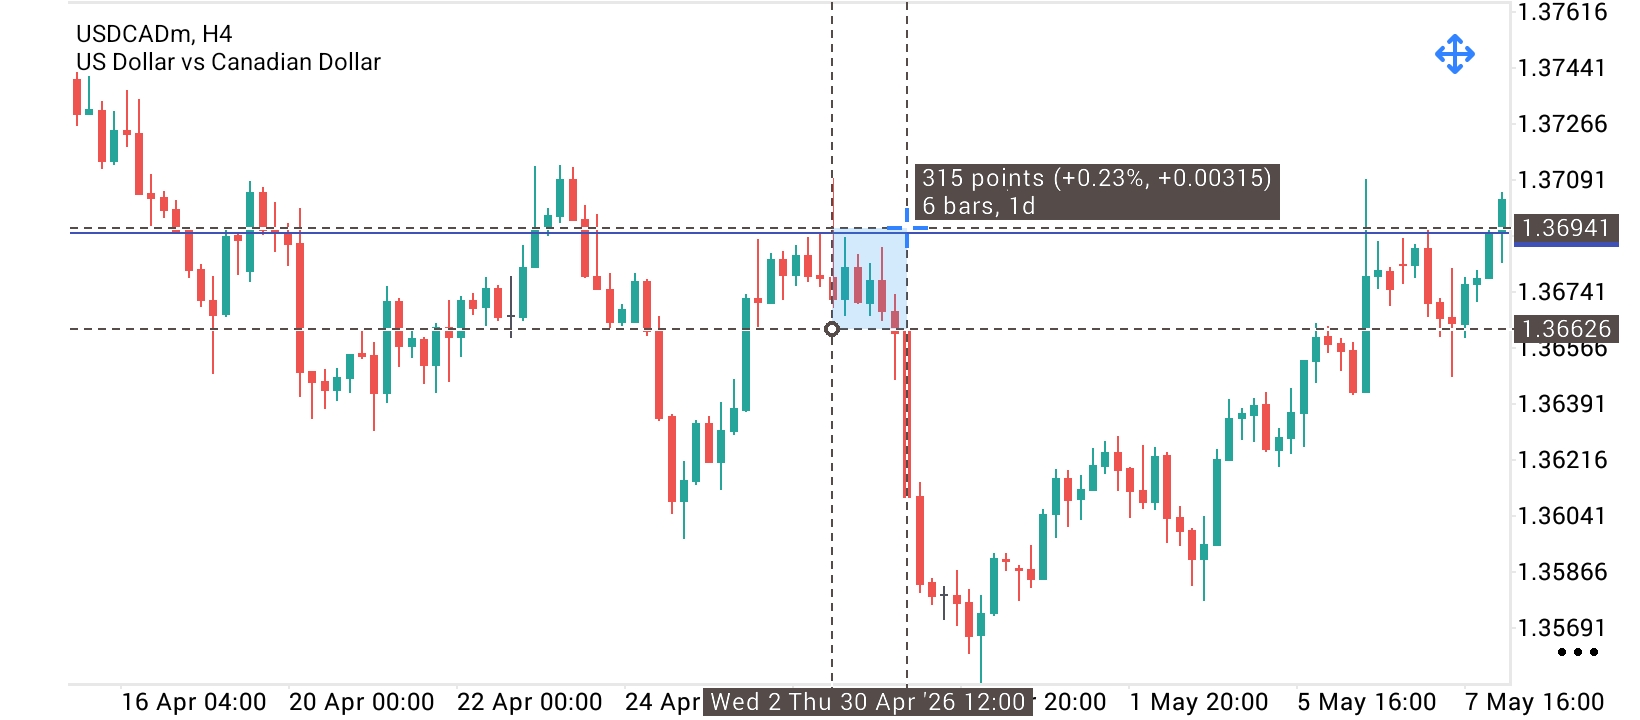
Go to usdcad, check for 29th April this year from 1pm to 4:59pm then compare with BTC on 17th of July please all this check it from 15min timeframe as the structure timeframe and also entry timeframe, then mark the highs that were previously formed from 1am till the entire trading hour to when 1pm opened do for the both charts then use the writeup you will get more understanding and your eyes will be open to the hidden strategy you dont see as a retail traders, you will start trading like the banks, that is the two chart images it's an assignment do it and give a feedback