
A
Arthur Wildberry
@arthur_wildberry
Last seen:
12 hours ago
Prioritize RIsk
0 Followers
0 Following
Everyone has a plan until they taste their first loss of the day; then the plan goes out the window
17 trades is mentally exhausting considering the amount of thought you must have put into each of them. I prefer taking just 2 to 3 trades with conviction and if by the end i am still in a loss i call it a day.
It is simply when you are always trading in one direction every time. For example if you are always buying and never selling.
Institutional traders have been able to solve the problem of psychology by creating and enforcing daily loss limits. Once an institutional trader makes up to 3% loss in a day, the trading platform automatically shuts him out. retail trading software does not have this feature, so retail traders are allowed to self-destruct aka blow their accounts
I often wonder why price seems to breakout of the box then suddenly reverse in the opposite direction
This is just gambling if you are not following the rules of the strategy. You said you were waiting to see something and you didnt see it then you went ahead to place a trade based on something else
Do well to check the leverage your broker allows for gold. The lower the leverage, the more funds you will need to have in your account to trade that instrument.
Were you trading crypto or stocks? I always try to journal my profit/loss everyday instead of waiting till it accumulates.
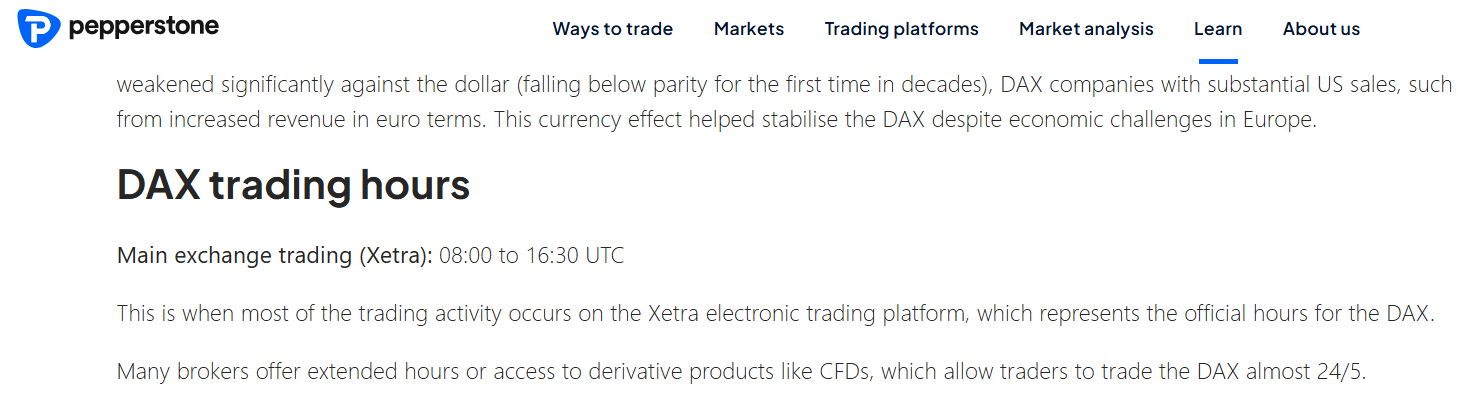
Best time to trade DAX is between 8 am and 4 30 pm during the main European trading session. There are many ETFs that track the DAX and these ETFs are traded daily during the main exchange hours causing liquidity to be highest when the DAX exchange is open
+1
One cannot be an analyst if he is not a trader. On what knowldge will they base their analysis on? Just like every coach can play football but not every footballer can coach. So, analysts to me are like coaches.
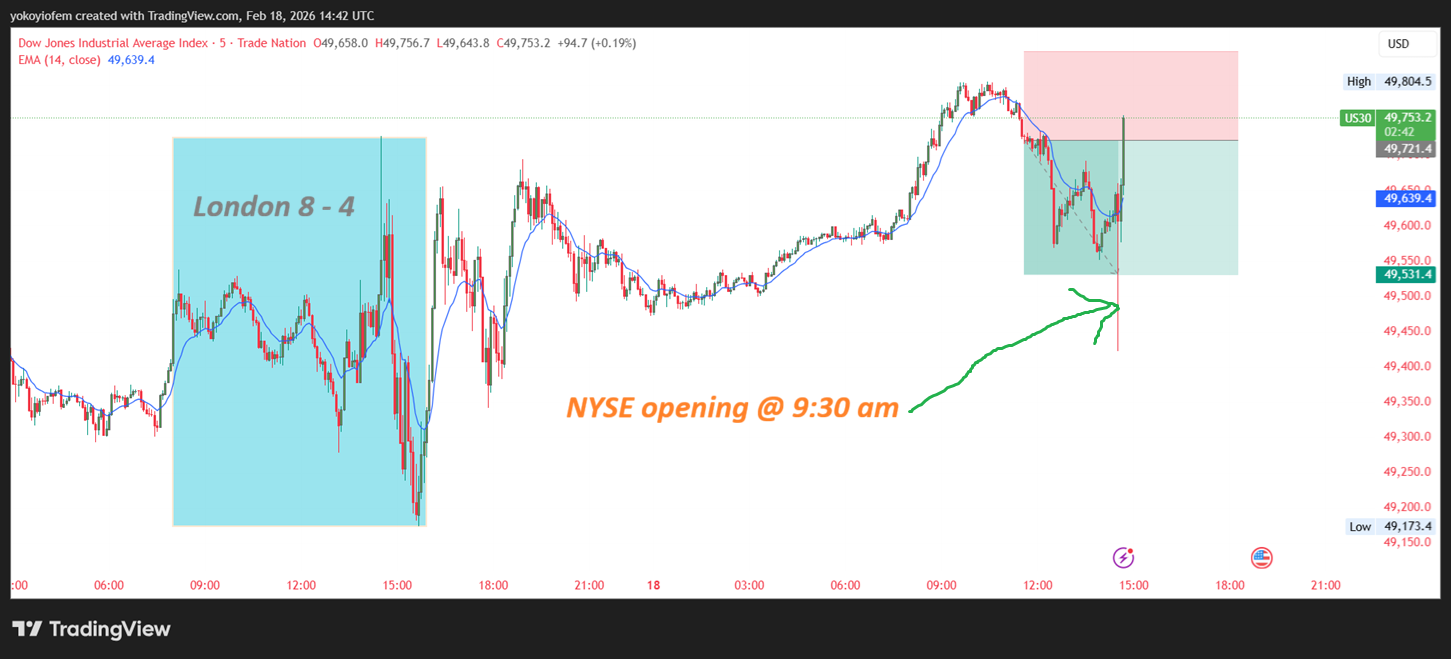
Hello Yokoyi, I follow your thread, I just wanted to point out that the spike that pushed price to your TP coincides with/signifies the New York Stock Exchange opening time of 9 :30 am. A flurry of activities and order execution is likely to have increased volume and spiked price to your TP. The same thing happened yesterday on the trade you posted.
There's got to be some exceptions right? I mean there's got to be some brokers that allow you connect to TradingView with a standard account, anyone have an idea?
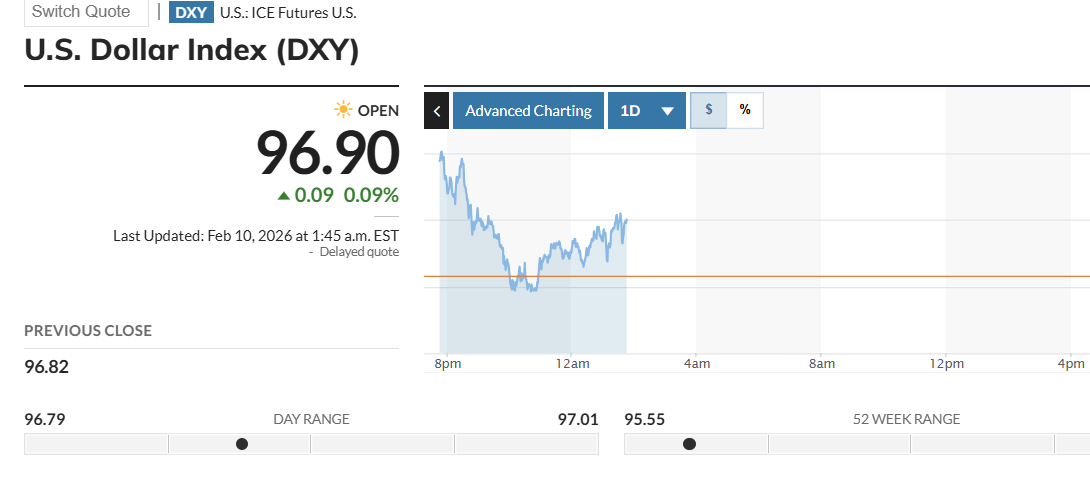
The us dollar index just gives you an idea of arket sentiment. Today at 96.90 it means the us dollar is 3.1% weaker than major world currencies.
I first of all check the brokers account types, I prefer trading with raw spread accounts so the broker must have this. I then check the payment methods to see if the broker support my local payment methods cos I need to be able to put in and withdraw money without any fuss.
Raw spread accounts charge you a tighter spread and in return, you must pay a fixed amount of money as commission after each trade.
There was a time I traded 0.05 lot size of EUR/USD on a raw account, and the spread was 0.01 pips. Before closing the trade i was up $5 but after closing the trade i discovered my final profit was $4.82 because a $0.18 commission had been deducted.
Showing 20 of 58 replies.
Log in to see all replies