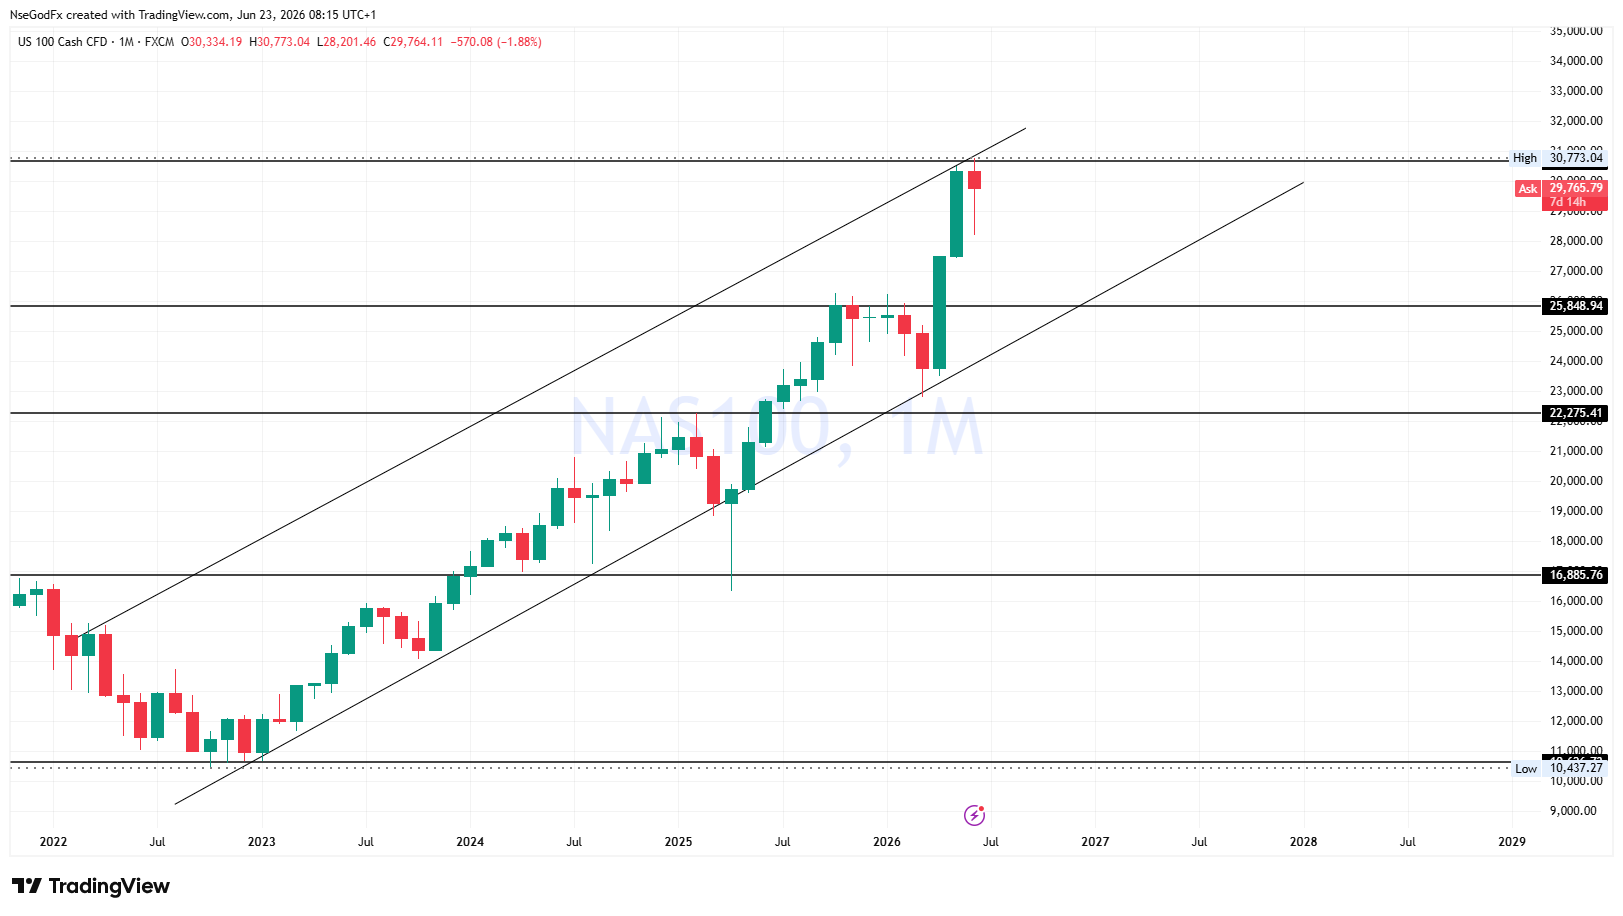
With the monthly Bearish Candle remaining 8 days to close as a hanging Man, at an Upper channel Resistance and Monthly High at Price Level between 30,500 and 31,000, i'm anticipating price to drive down to price levels between 28500, and 28,000
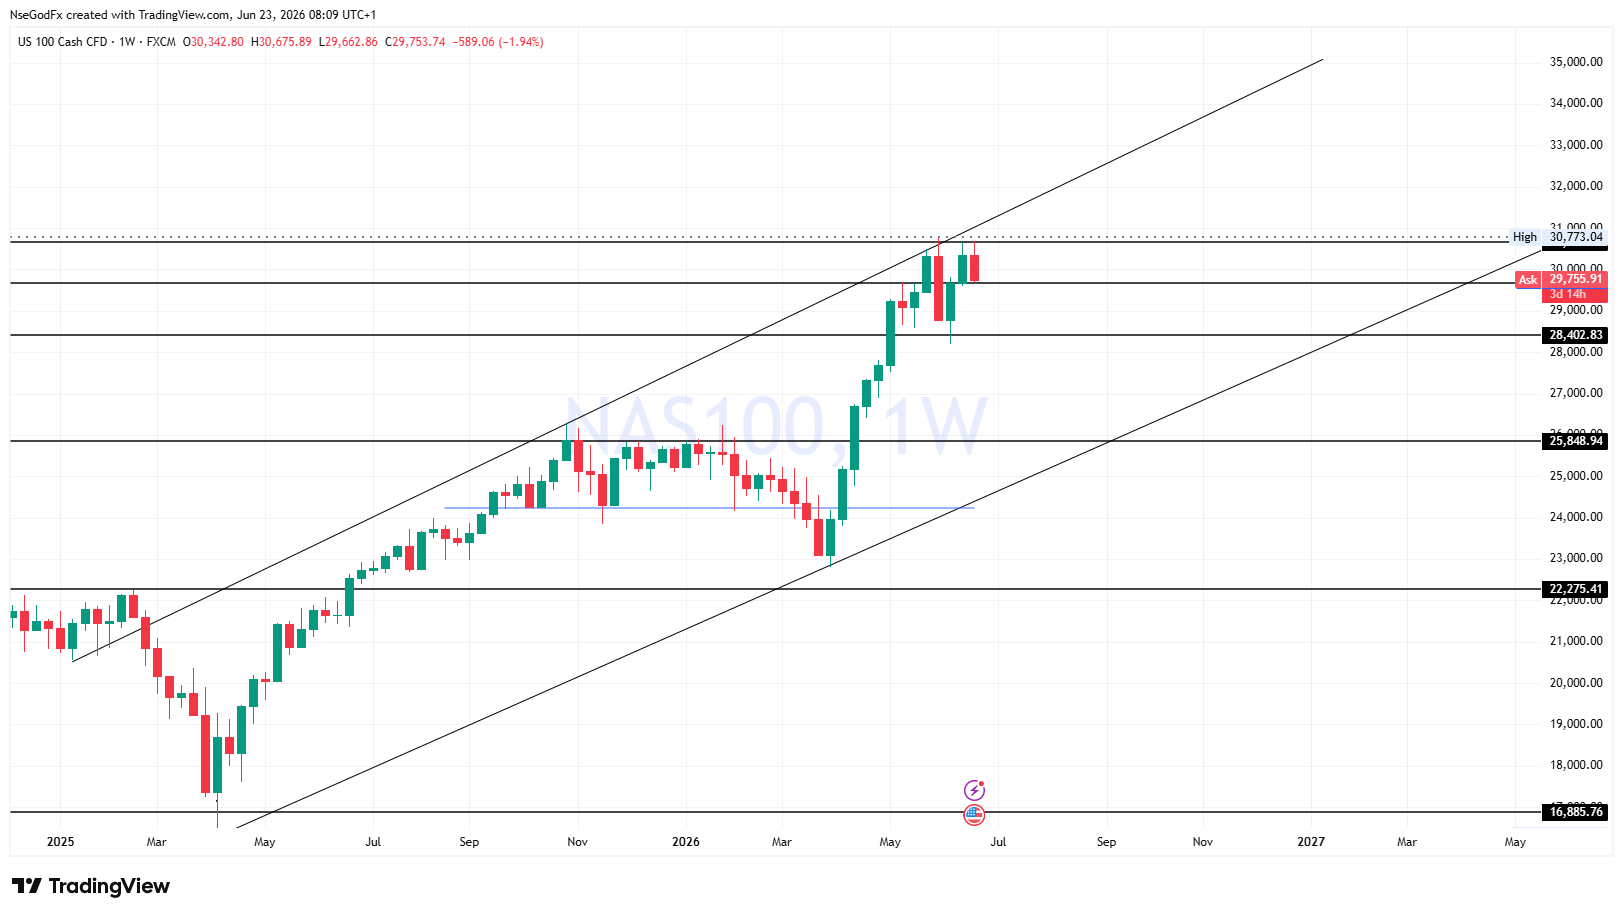
On the Weekly Chart, Price has formed a double top, which is a Bearish reversal Chart pattern. this further confirms Price inability to break through the Resistance Levels (30500-3100)
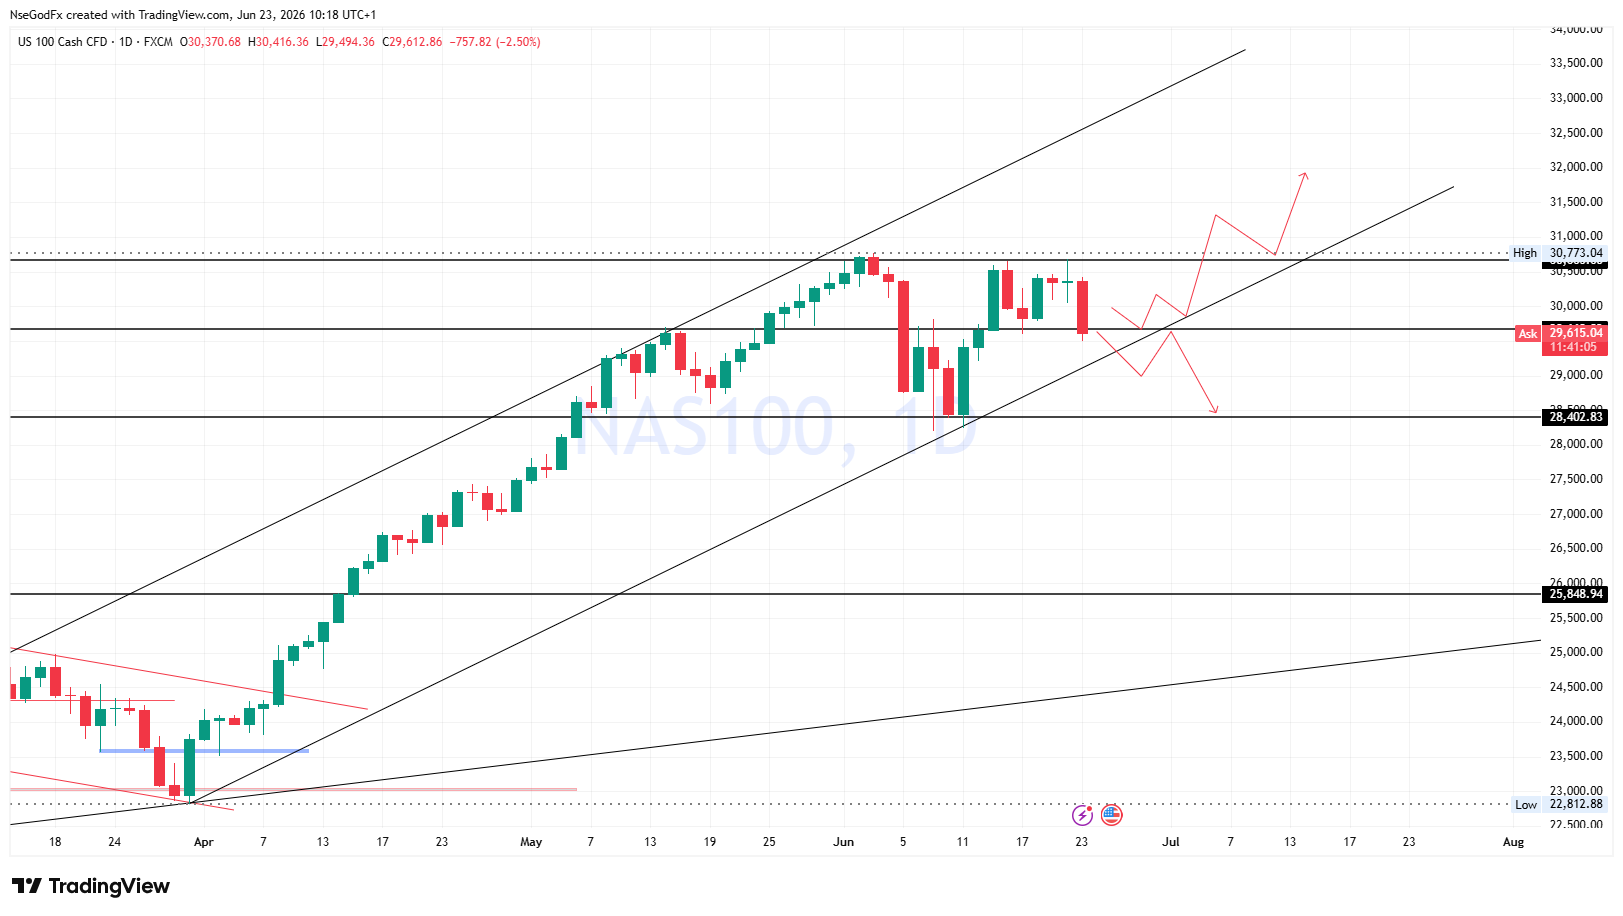
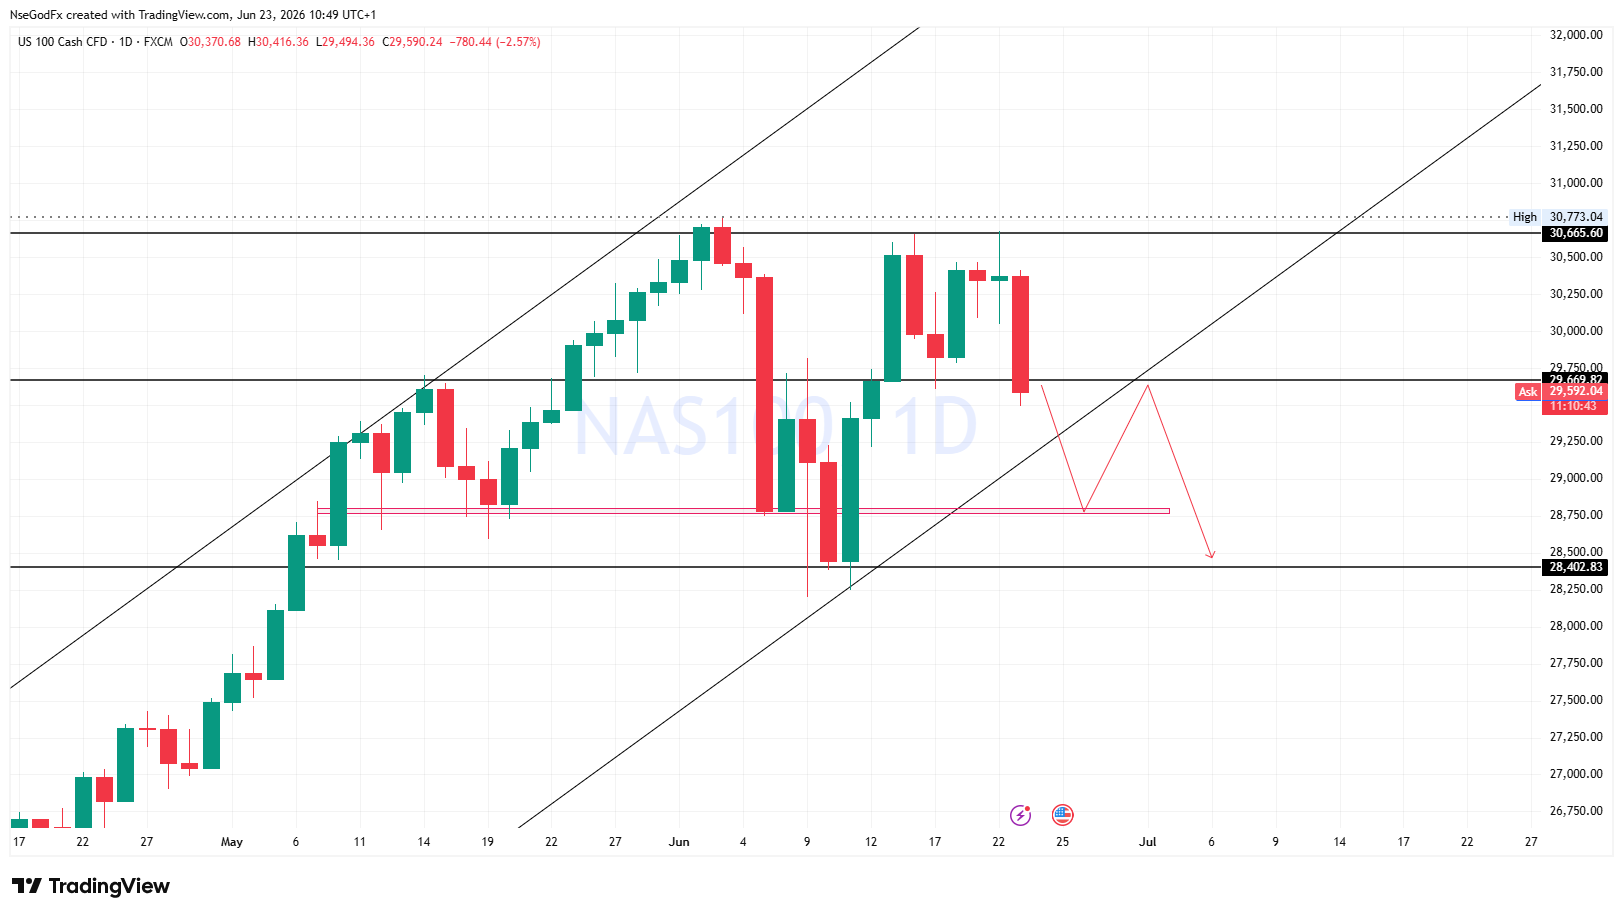
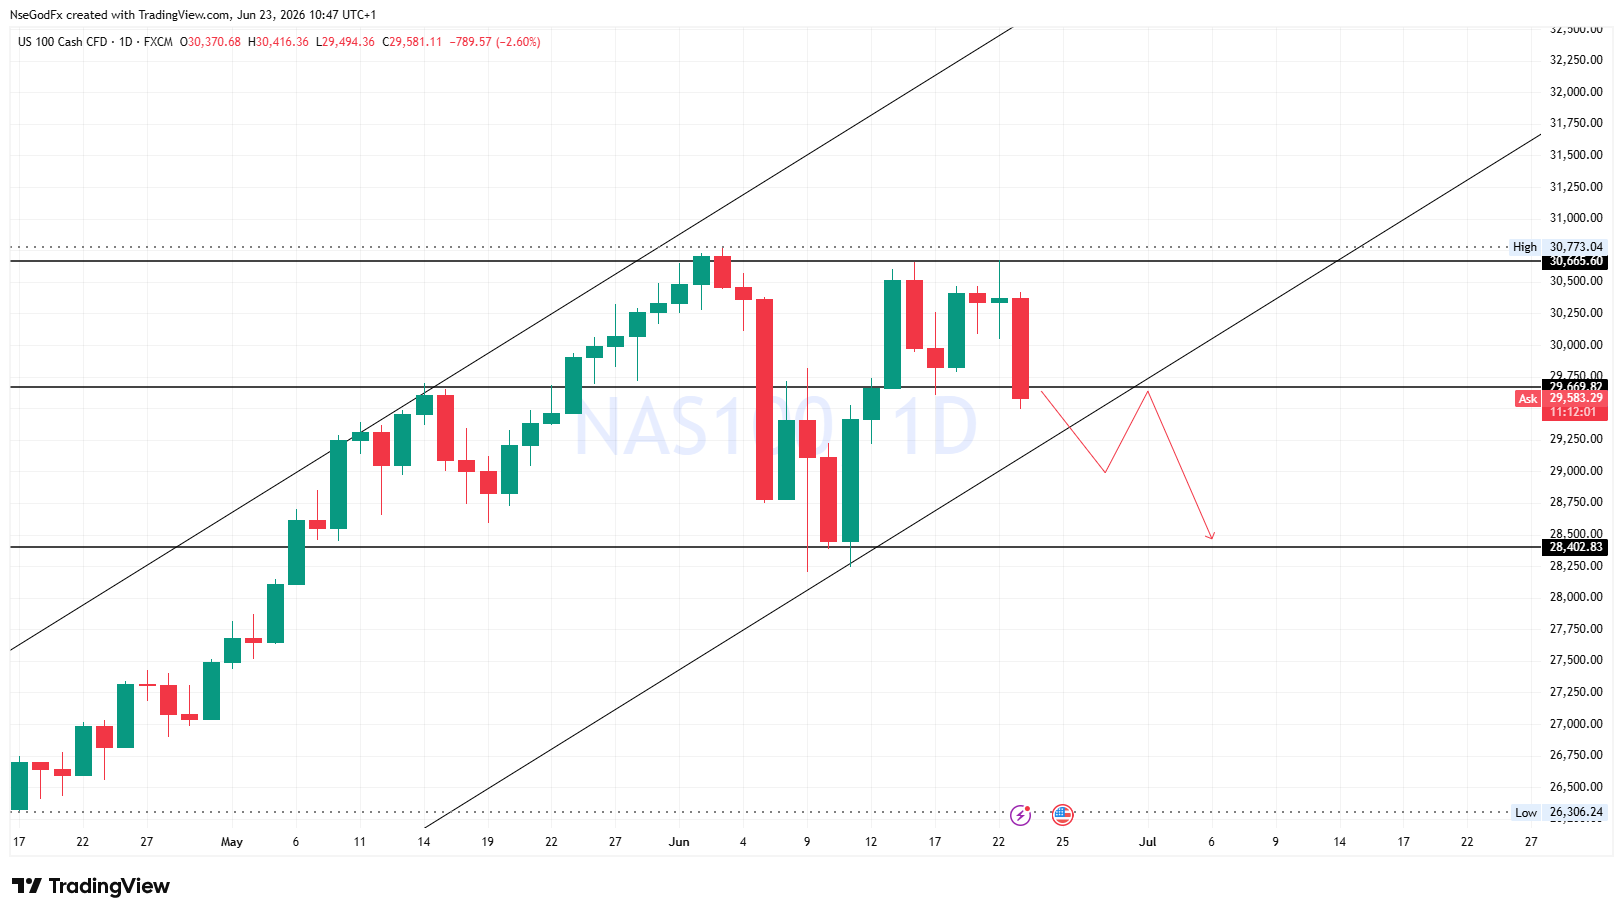
On the Daily Chart, Price is still confined within a daily Bullish channel reacting on a daily Support area(29800-29600) and two Scenarios can happen....
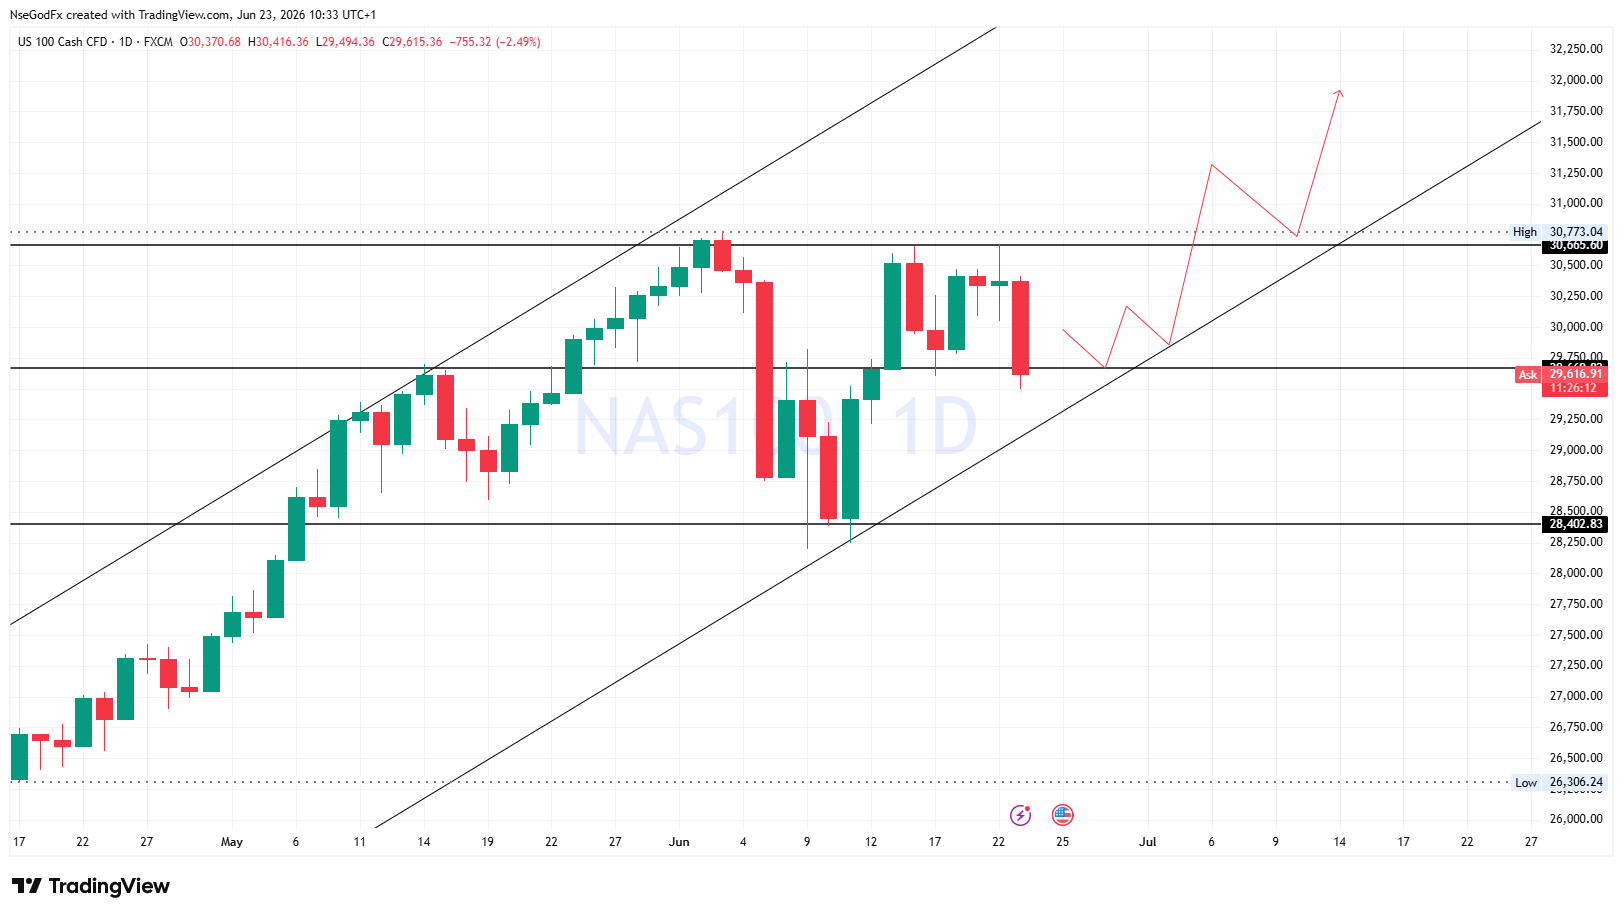
Scenario 1- Price will form a daily double bottom at the daily Zone (30600-30800).. and continue trading in range between the New All time resistance zone (30500-31000) and the Daily zone throughout the week...
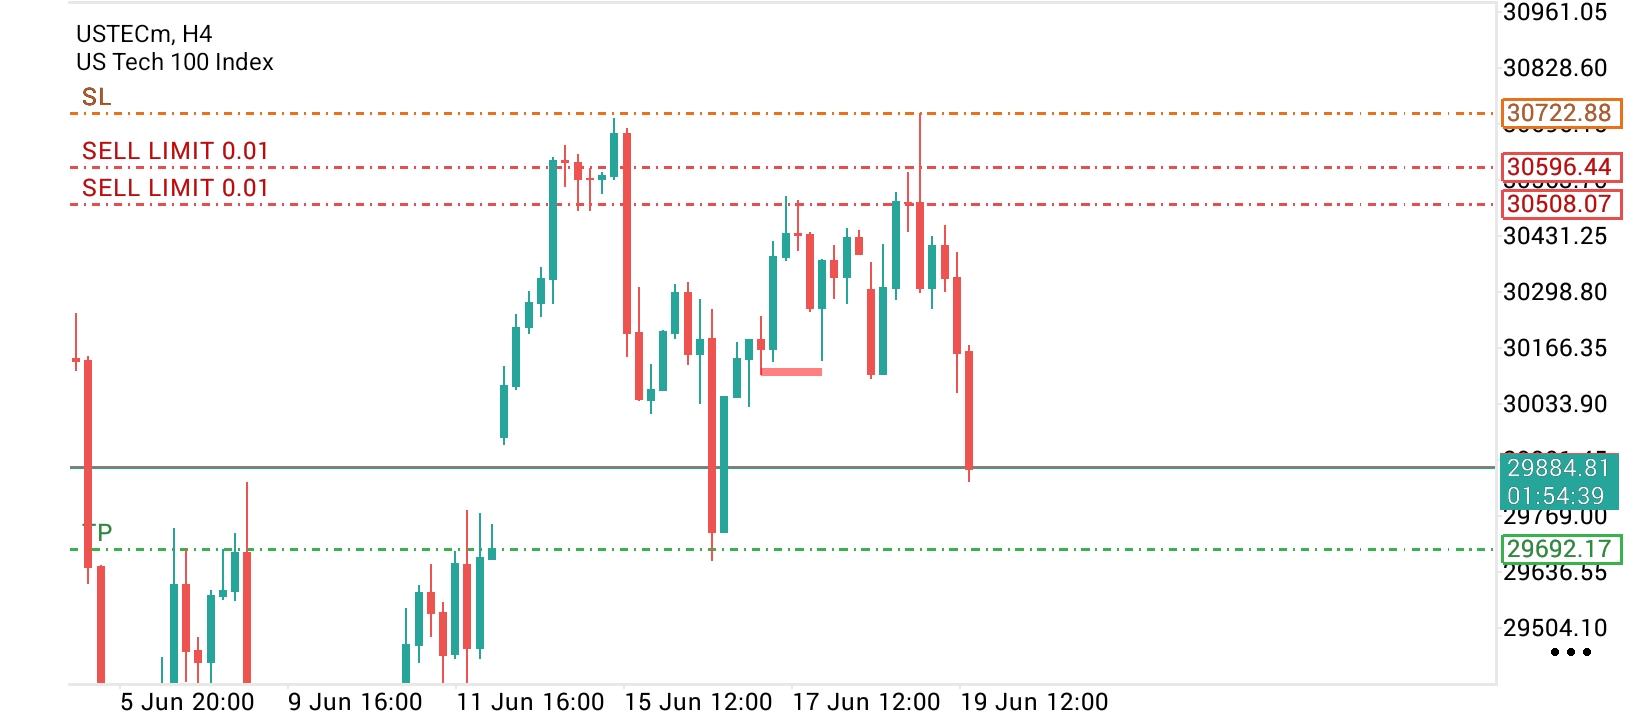
Your analysis is good but considering the fact the fear guage is pointing towards the risk off zone, techs may see further downside more as the dollar save heaven strength persist, as cash flow is leaving risky assets. I had a sell limit on ustech trade yesterday but although didn't trigger but it sold hard my first limit entry was at 30508 and second limit entry was at 30596 but I wasn't triggered but price went down till this morning, practicing good risk management I missed the trade because didn't want to trade beyond my risk limit
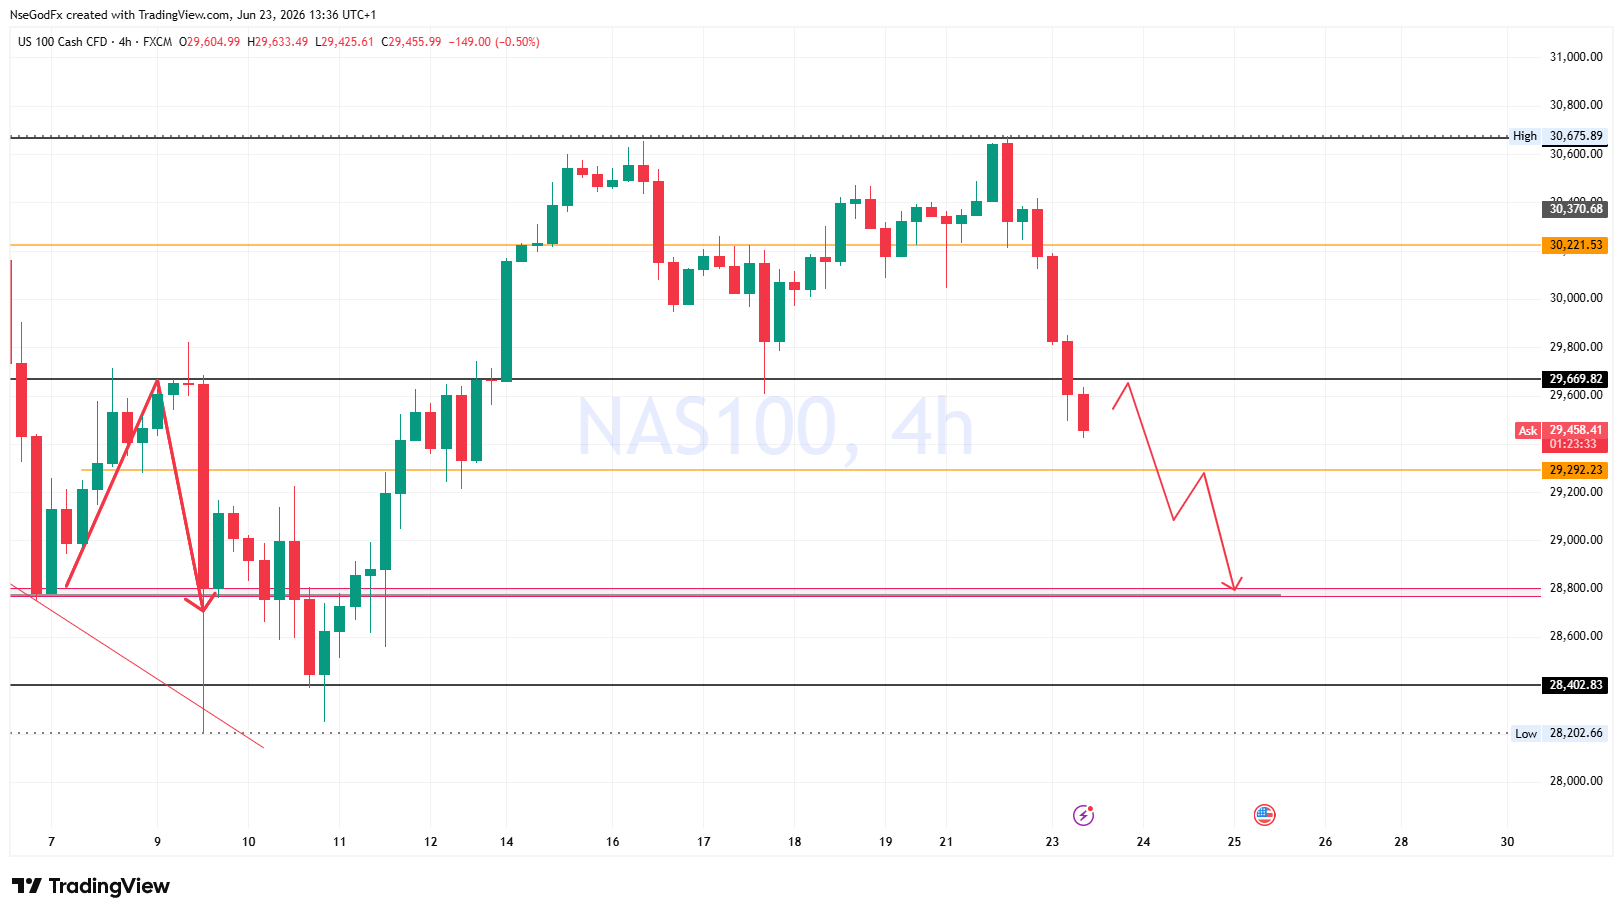
Scenario 2: Price will break the support zone and retest it as a resistance, and we'll see a further Price decline to the Internal Support Level (red zone which is between 28700-28800)
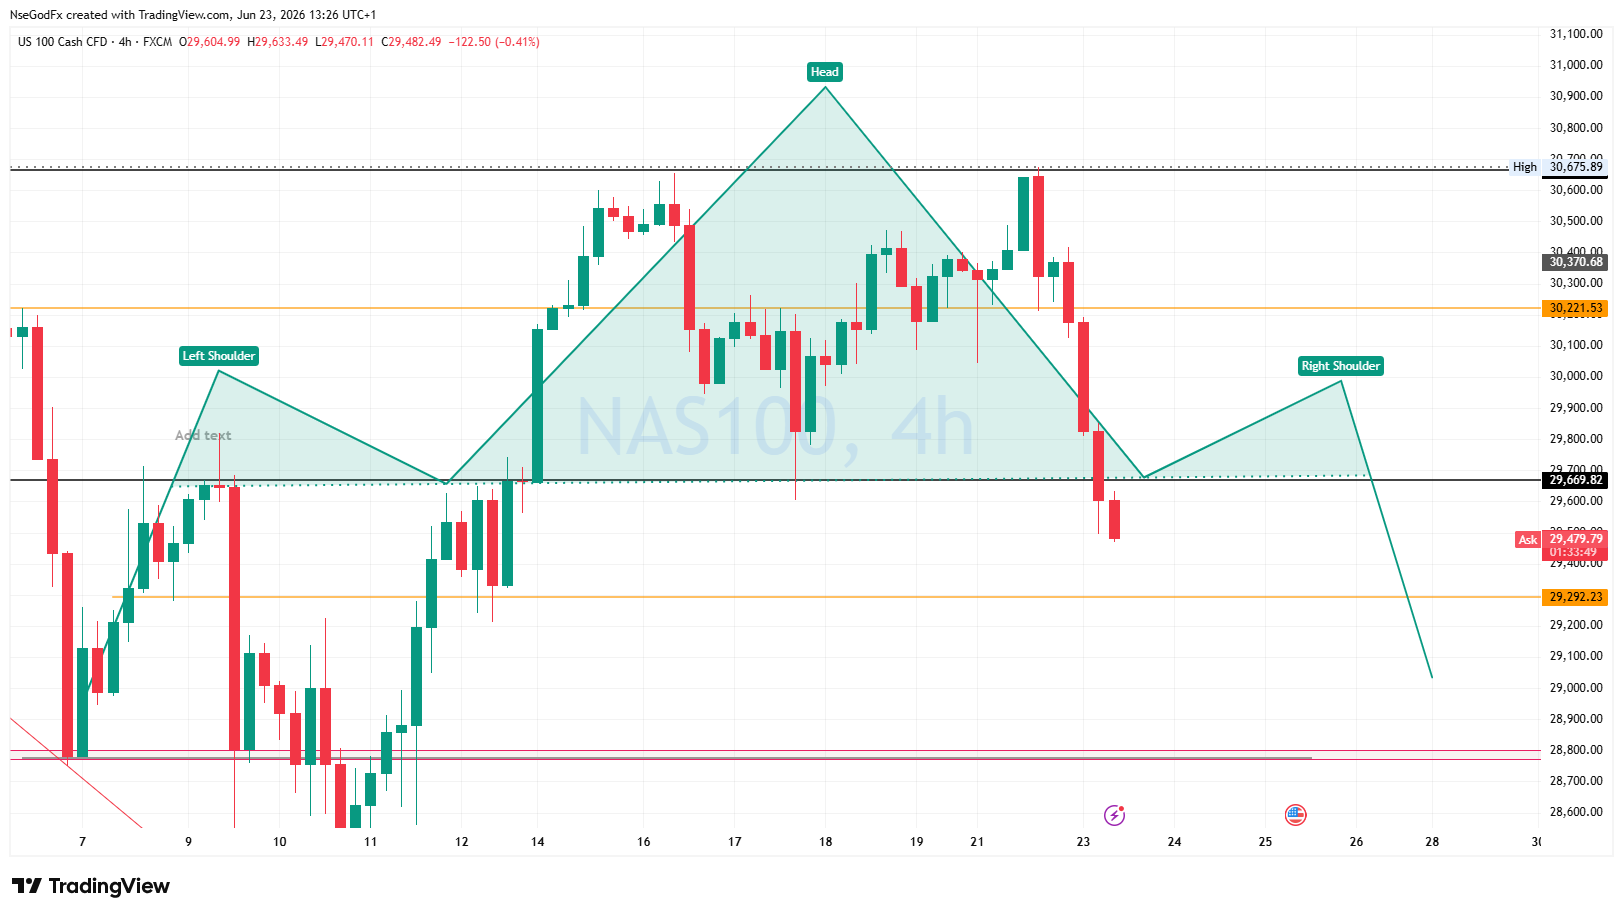
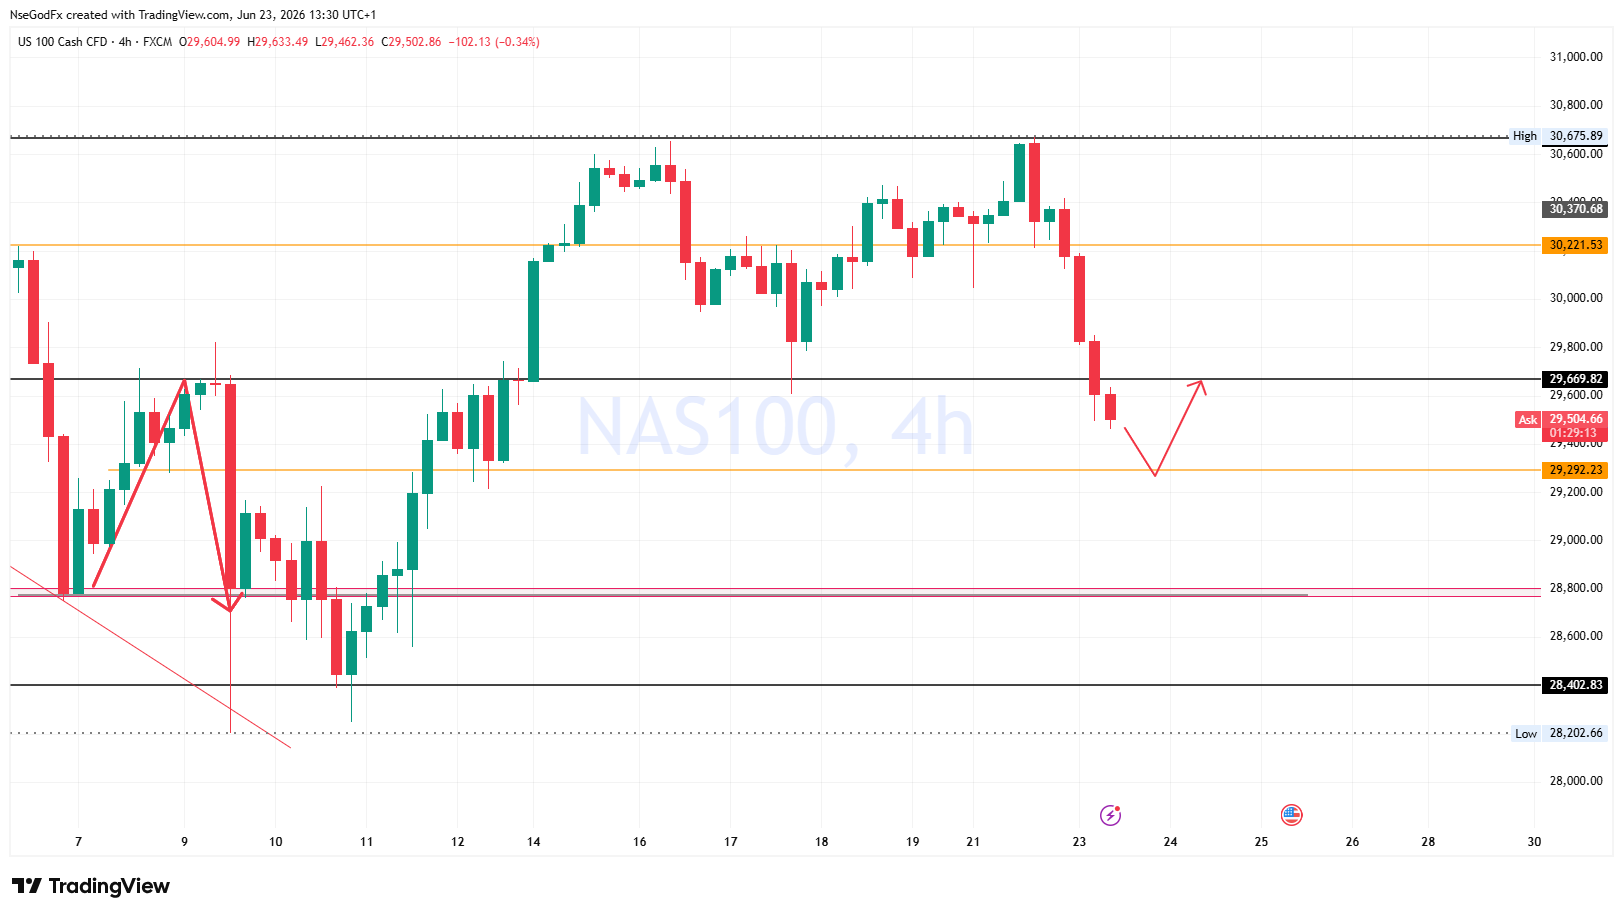
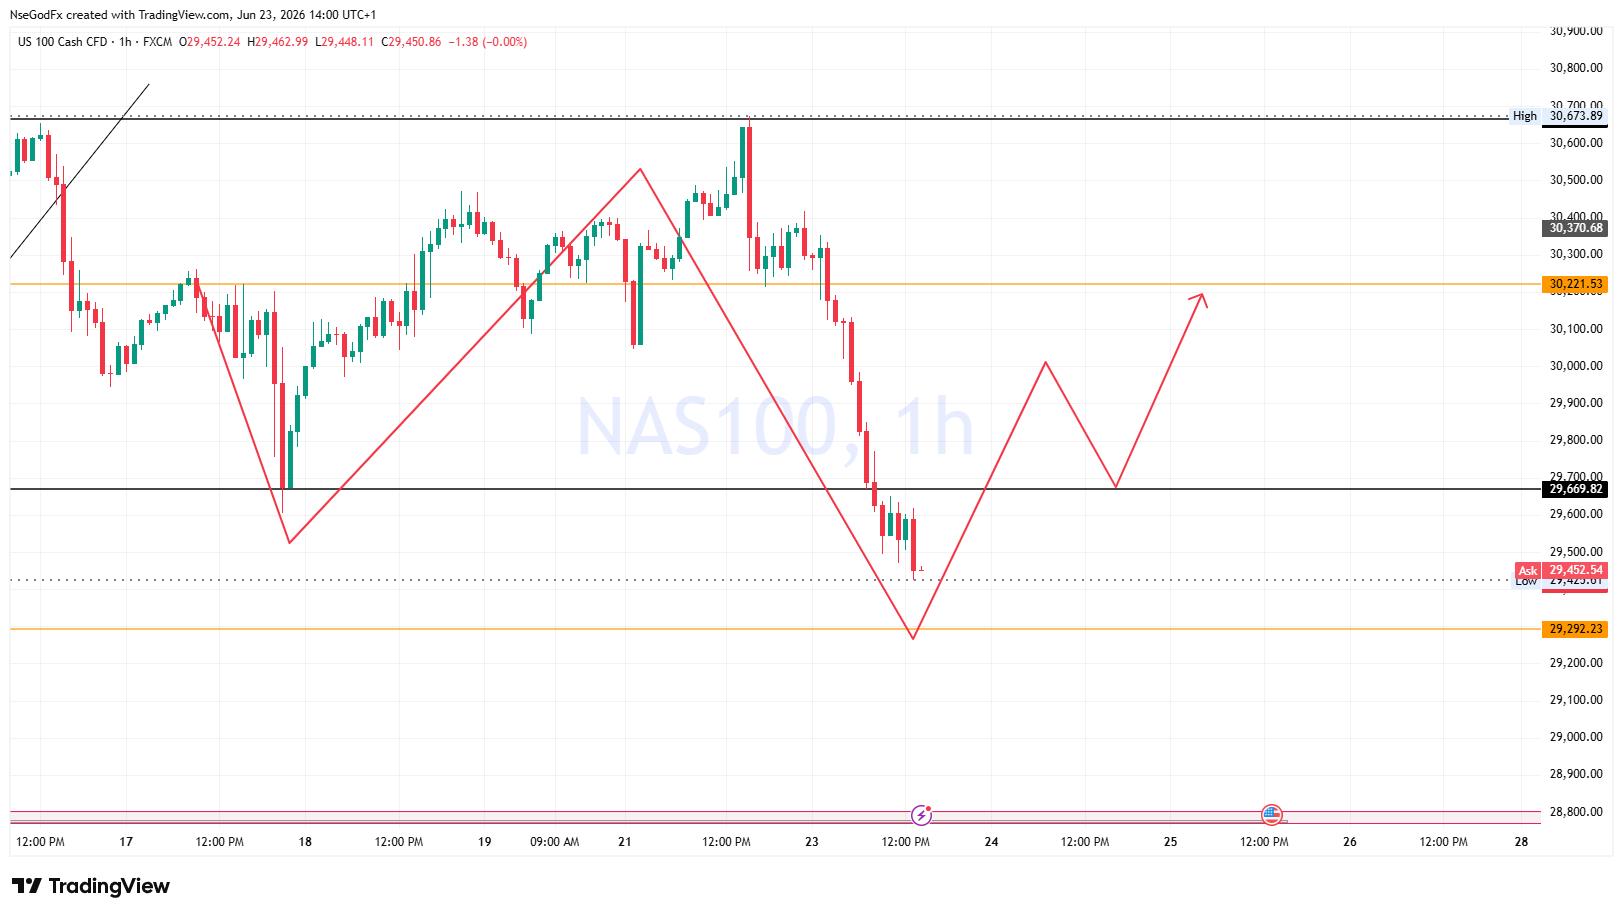
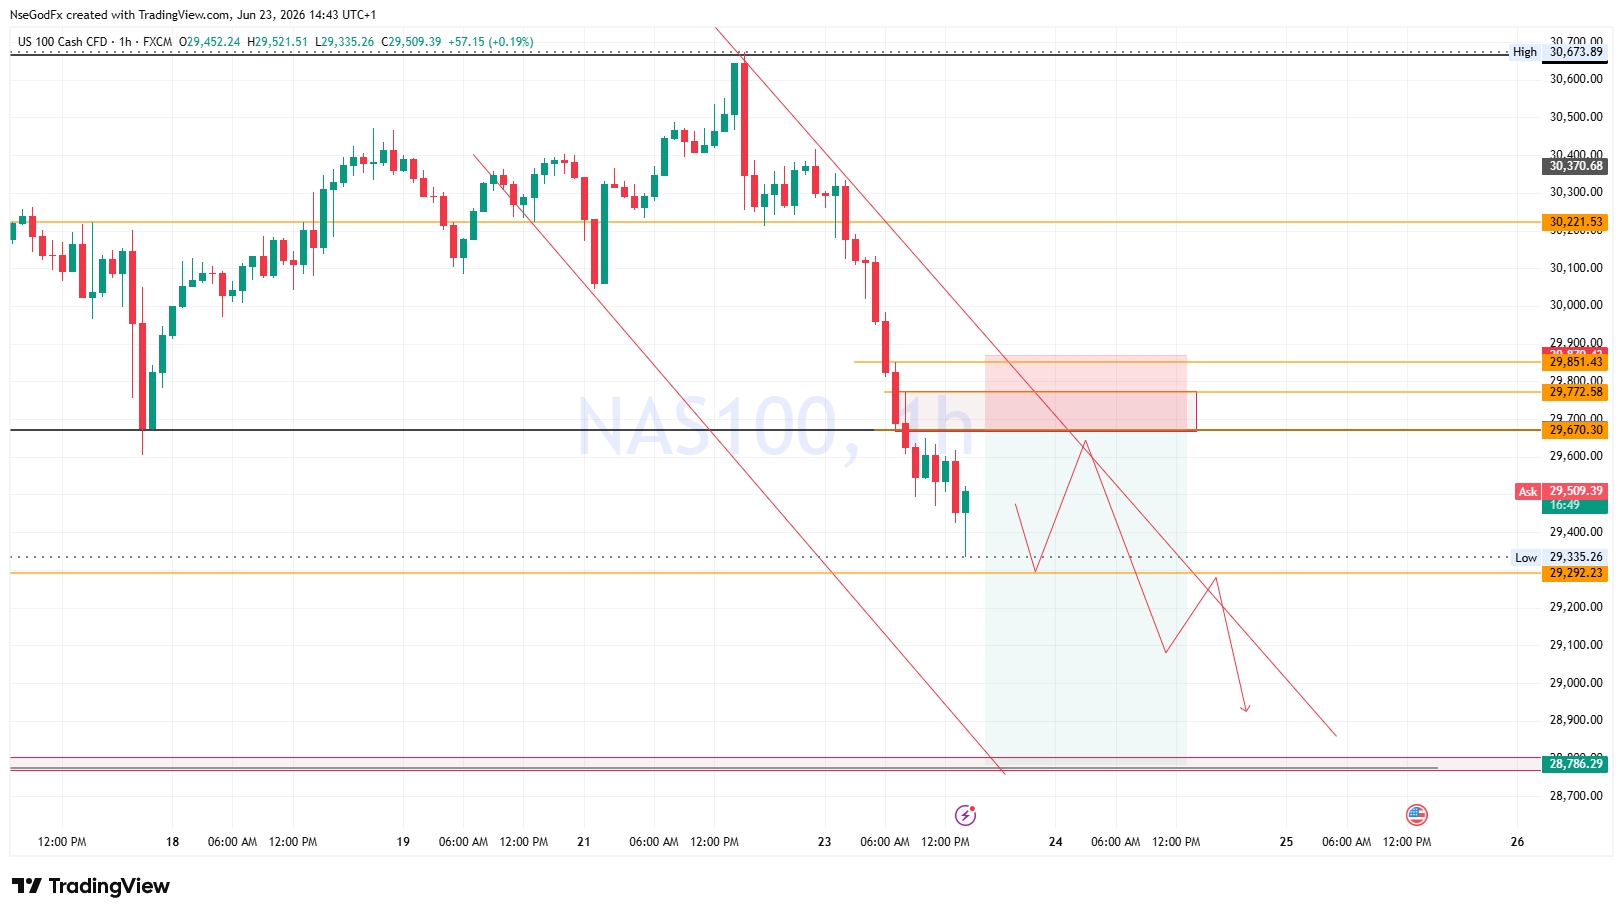
with the current ongoing sells, i'm expecting some 4hr bullish reactions at 29292 price region (yellow Line level) where price will cause a pullback to the Daily flip Zone (Support turn resistance) 29600-29800
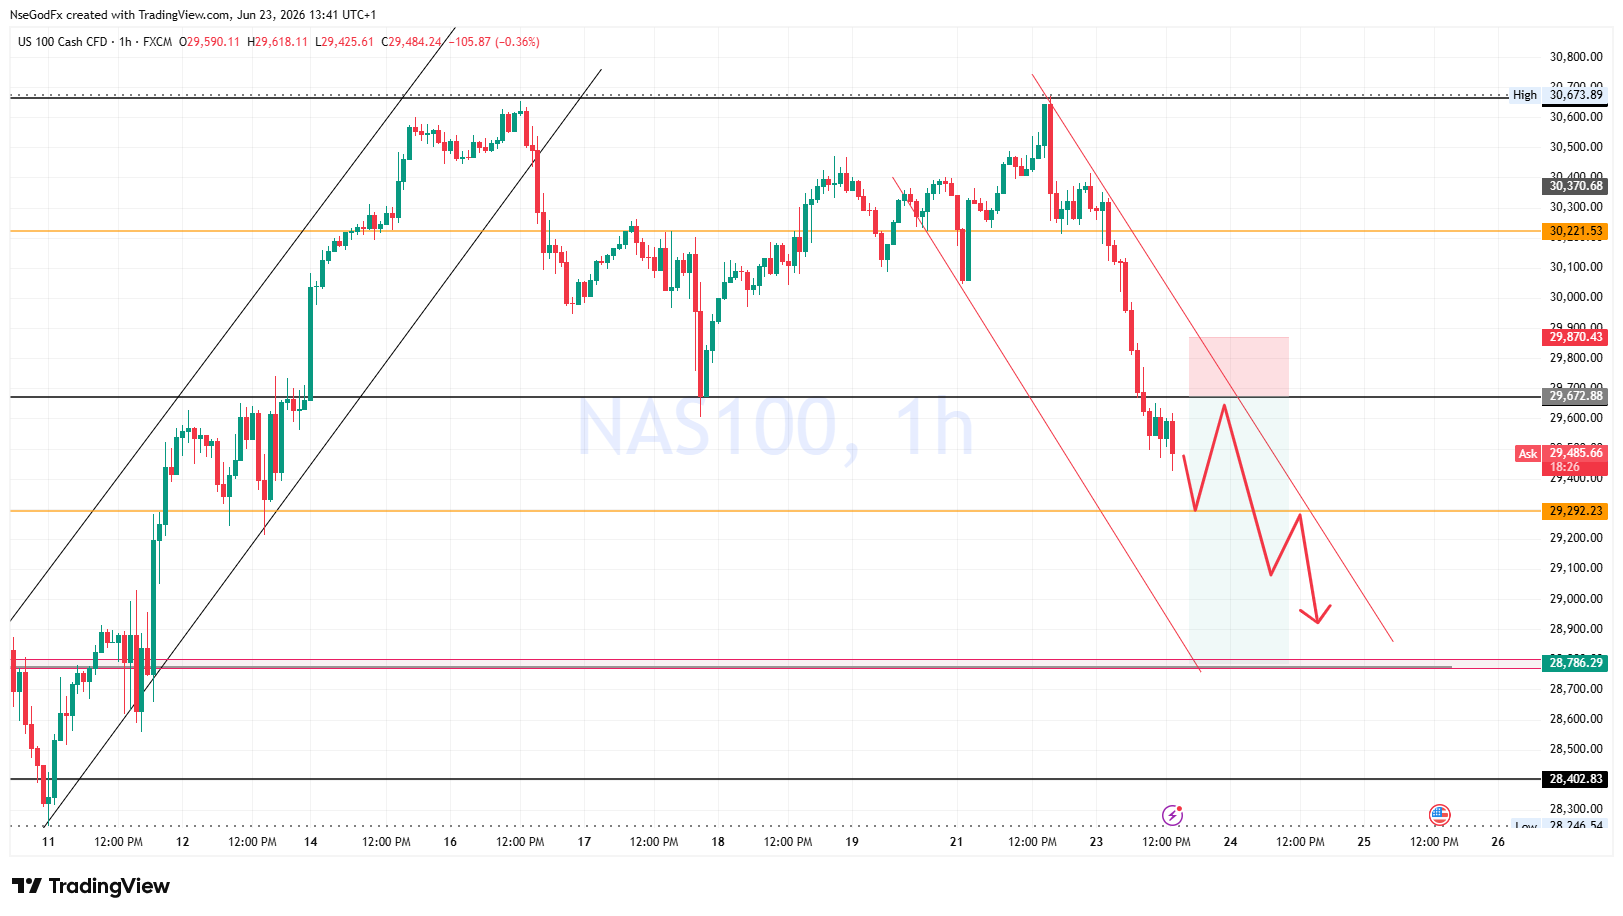
on the 1hr Chart, there's a bearish Channel, with two touches, and a pullback to my entry zone will confirm 3rd touch of the trendline which is one of effective entry strategies, that i use.
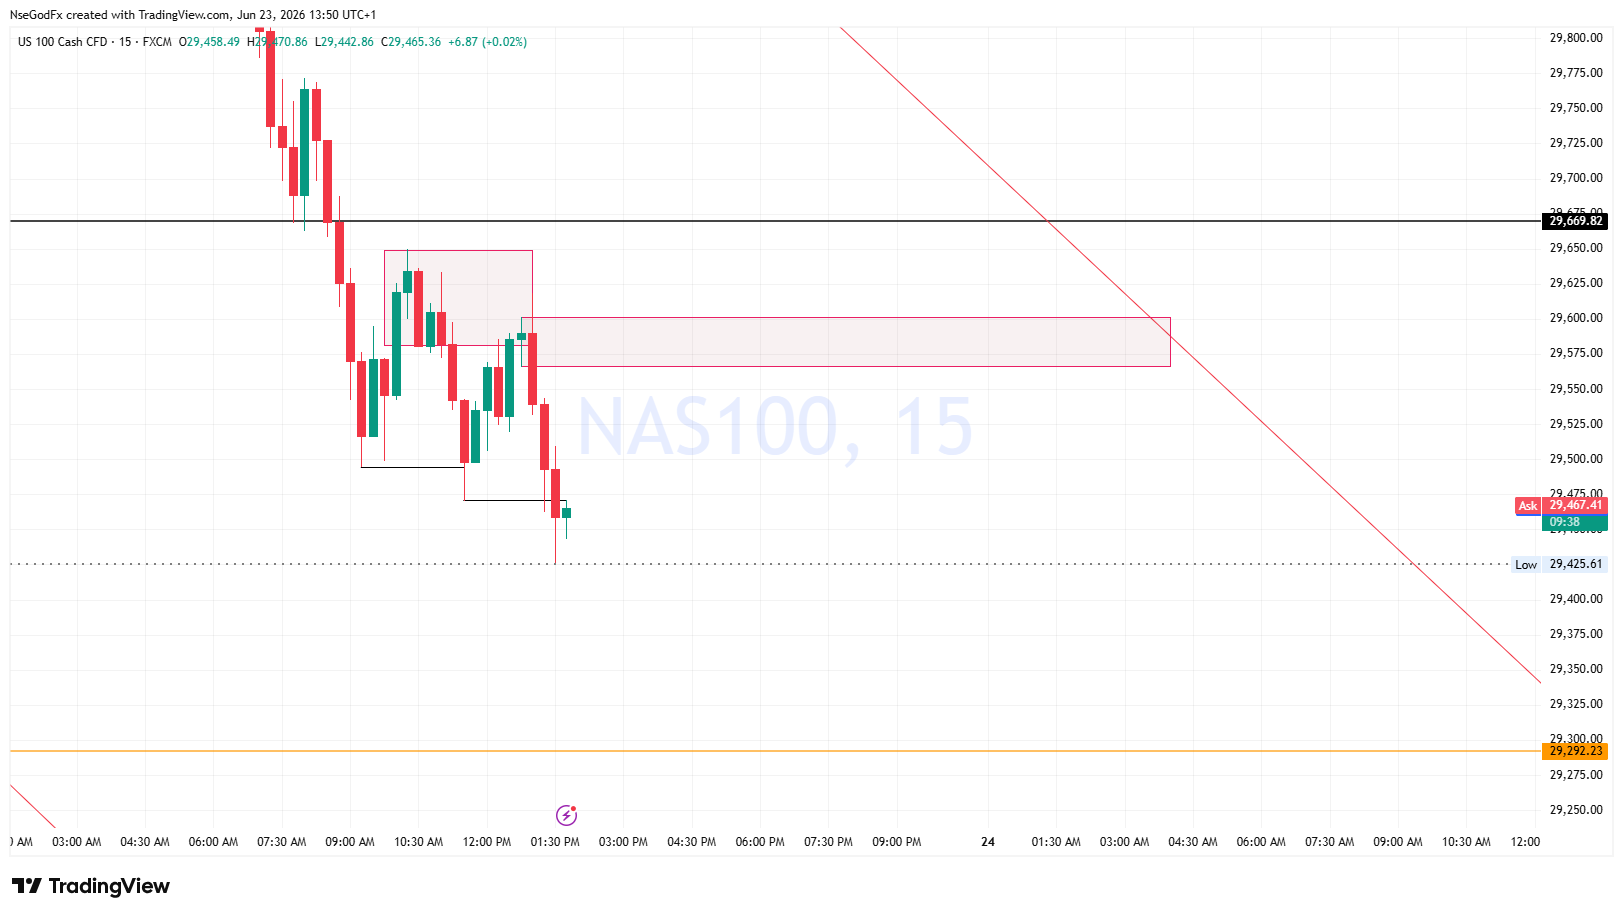
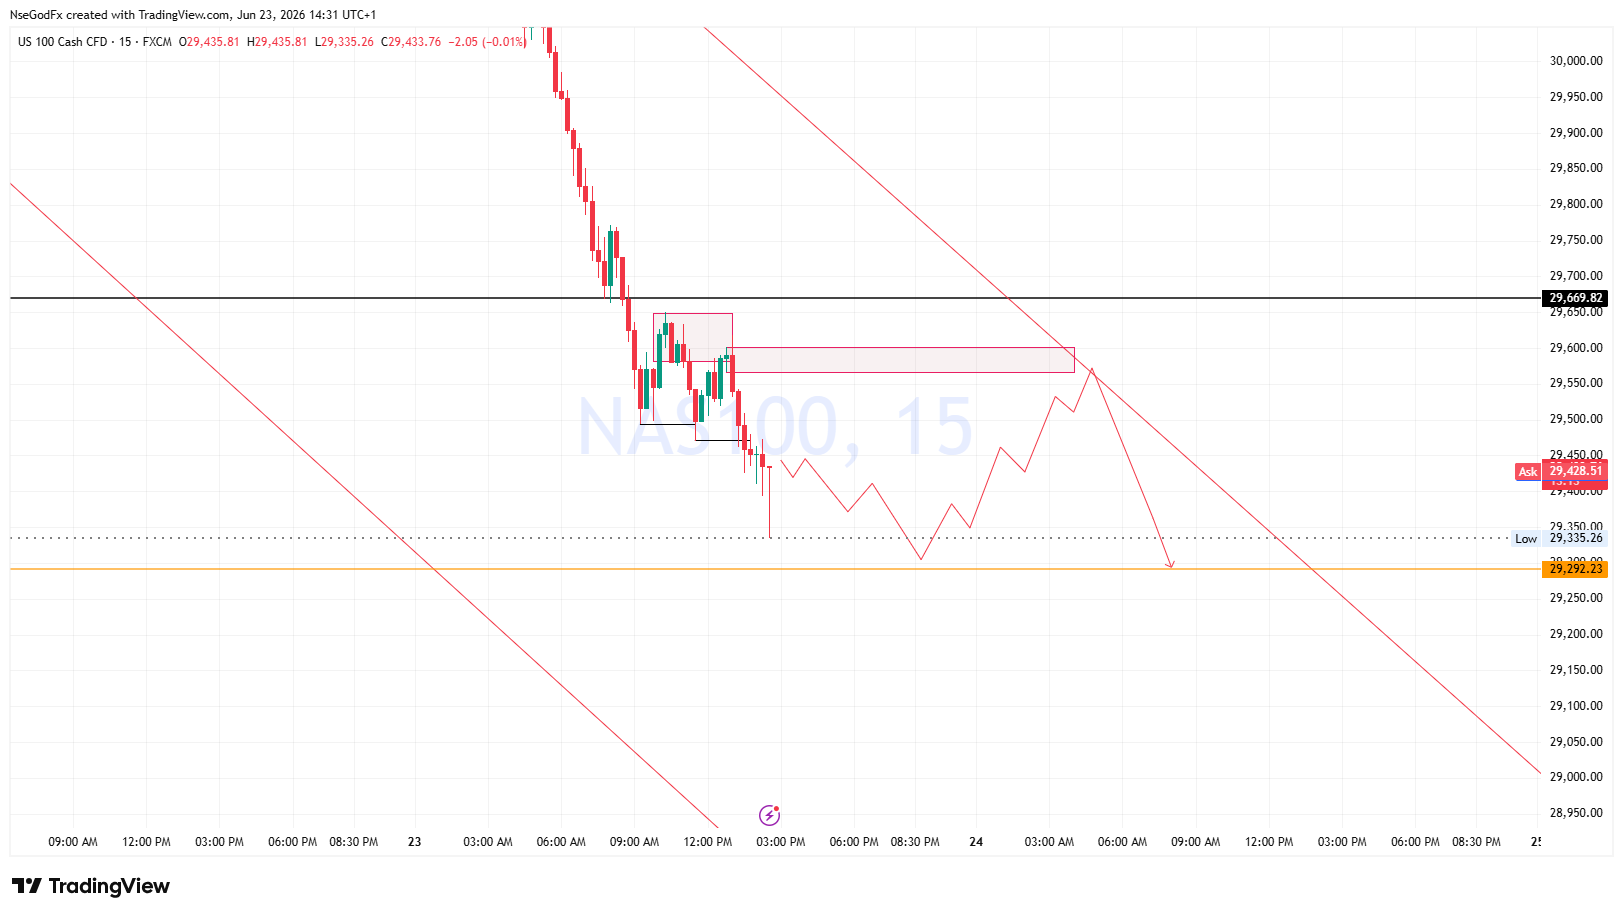
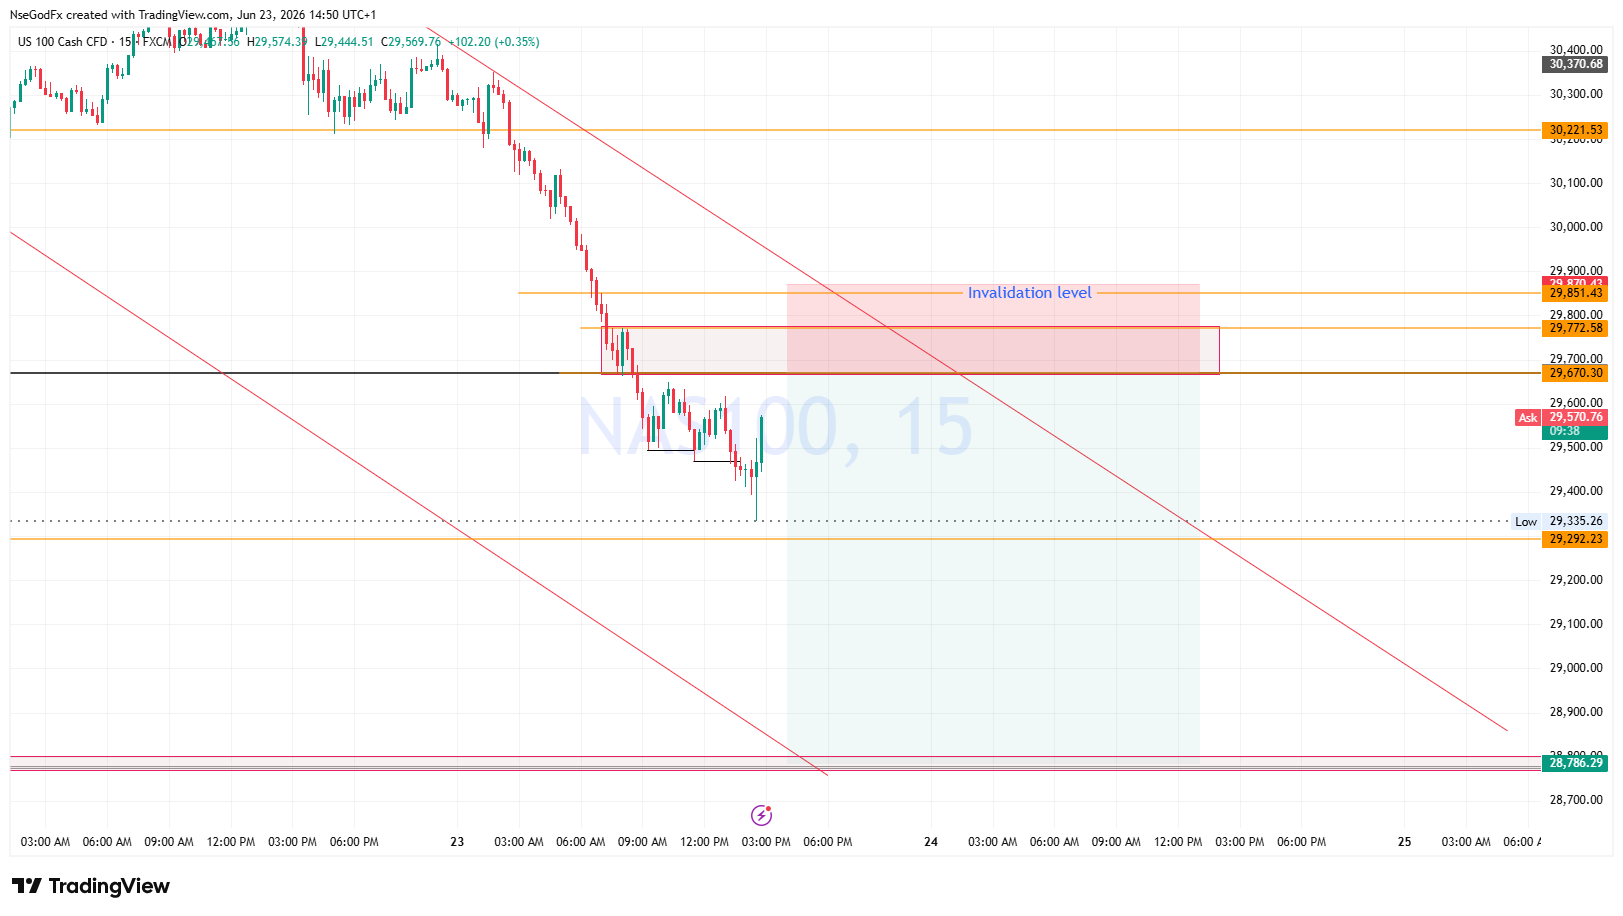
To further Refine my entry, i'll go to the 15mins Chart. I do this mostly when i want to trade a small account, so i can have an early entry, and a good stop placement. Here, a 15min Supply Zone has form just at the Flip Zone. This further adds to my confidence on taking the sells from that region
This is where, it often requires a lot of patience and discipline for me to wait. Yes price can want to retrace deeper, but i won't execute until I've seen confirmations that the retracement is ended within the flip zone (as resistance). But If price flips the zone back to use it as a support, as indicated on the chart, i'll expect the buys to get to the yellow price level @30221 region then i look for confirmations to join the sells from there.
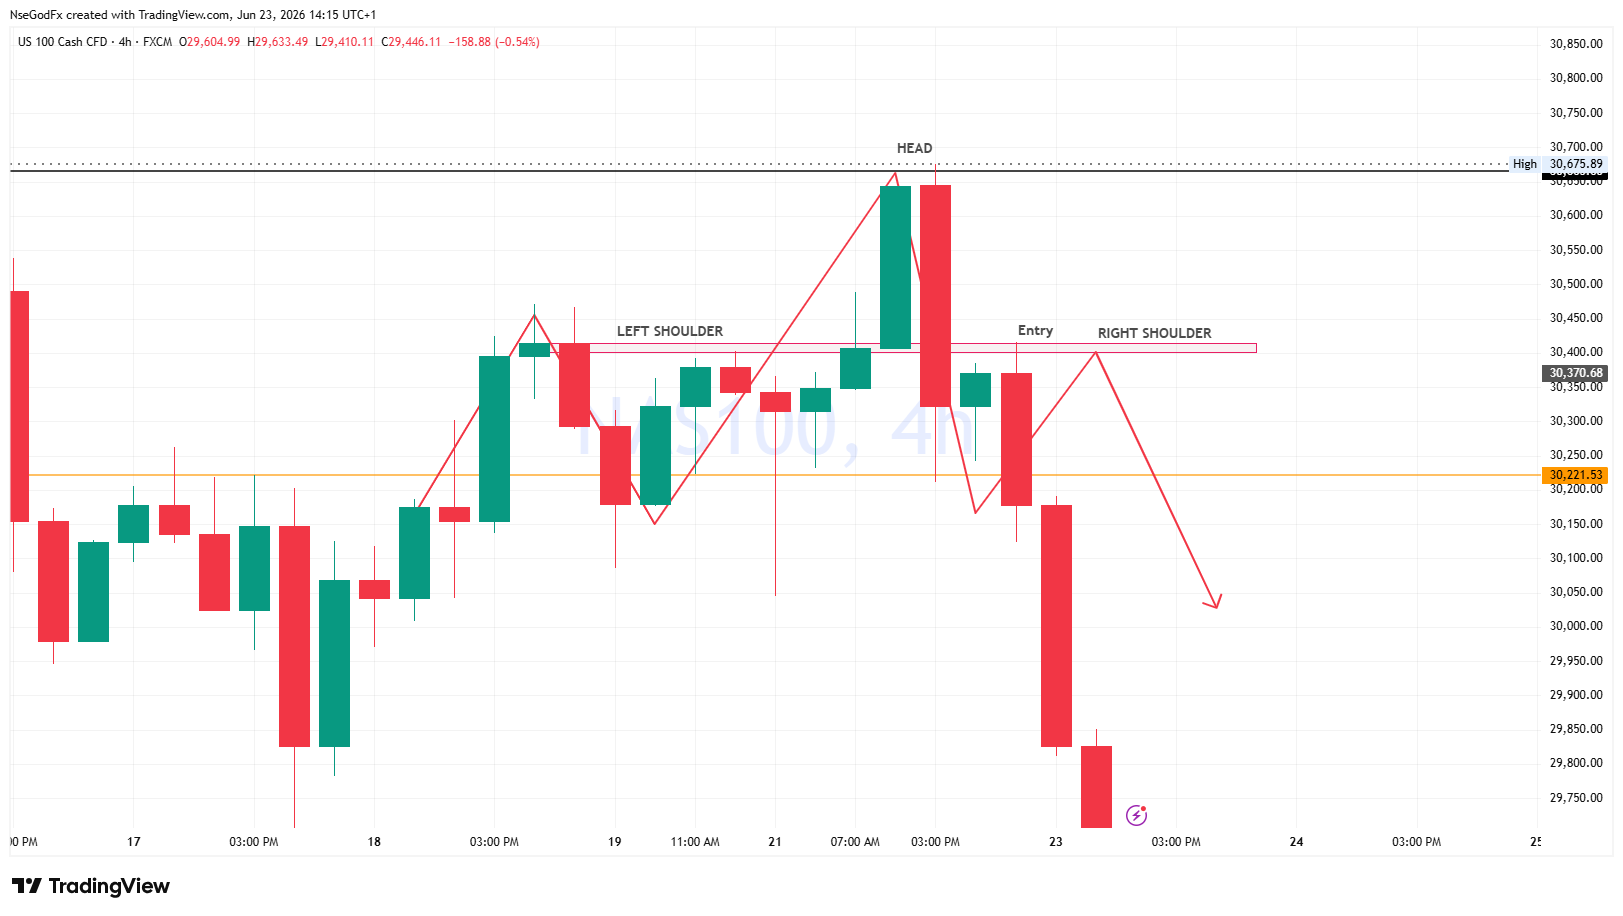
This is nice. But if i were to take the sells when the price was around this region, would have had my entry at 30352, using the Head and shoulder 4hr Pattern formation. it's more visible on the 15mins though.
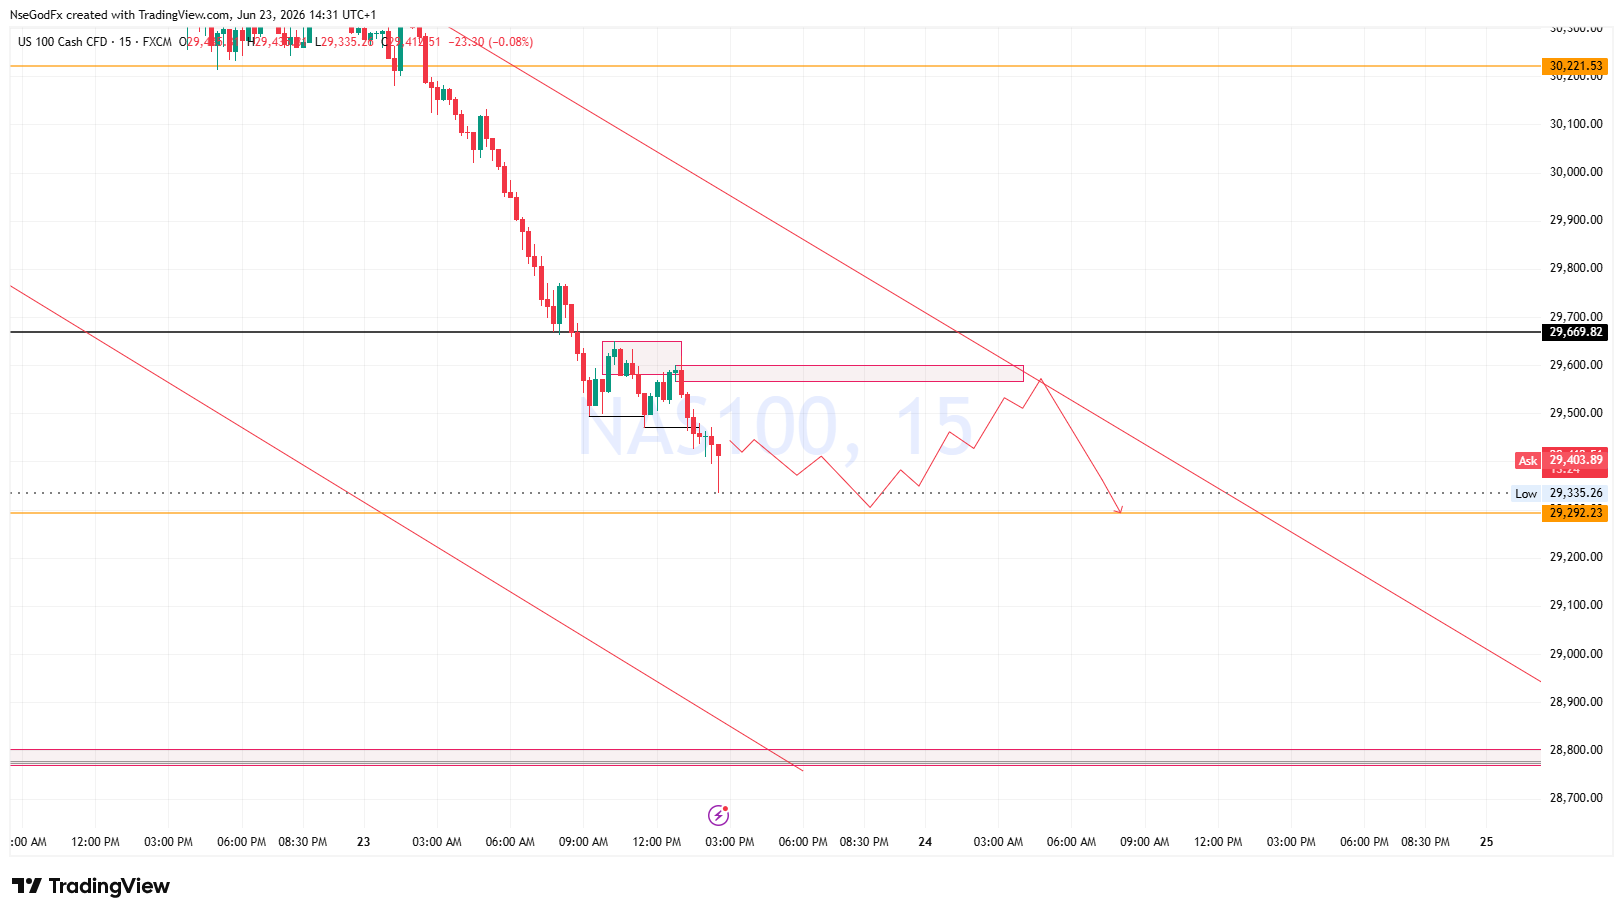
On the 15mins Chart, i'll start anticipating the retracement, but i often avoid watching charts on Lower Timeframes, to avoid emotional torture, an hesitations.