S&P 500 Market Analysis and Trade Setups

N
@nsg_usd - 1 week ago
Quoted - asuquokelvin

Oh it's okay that could have been a mistake

It's totally fine.
Did you trade SP 500 or US30 today?

N
@nsg_usd - 1 week ago
Quoted - asuquokelvin

It is just a pullback simple way of practicing such is my using the previous day high or low as resistance or support and then see how price reacts when it gets to the support or resistance of that previous day daily candle, I use it a lot

Yeah. I use it too.
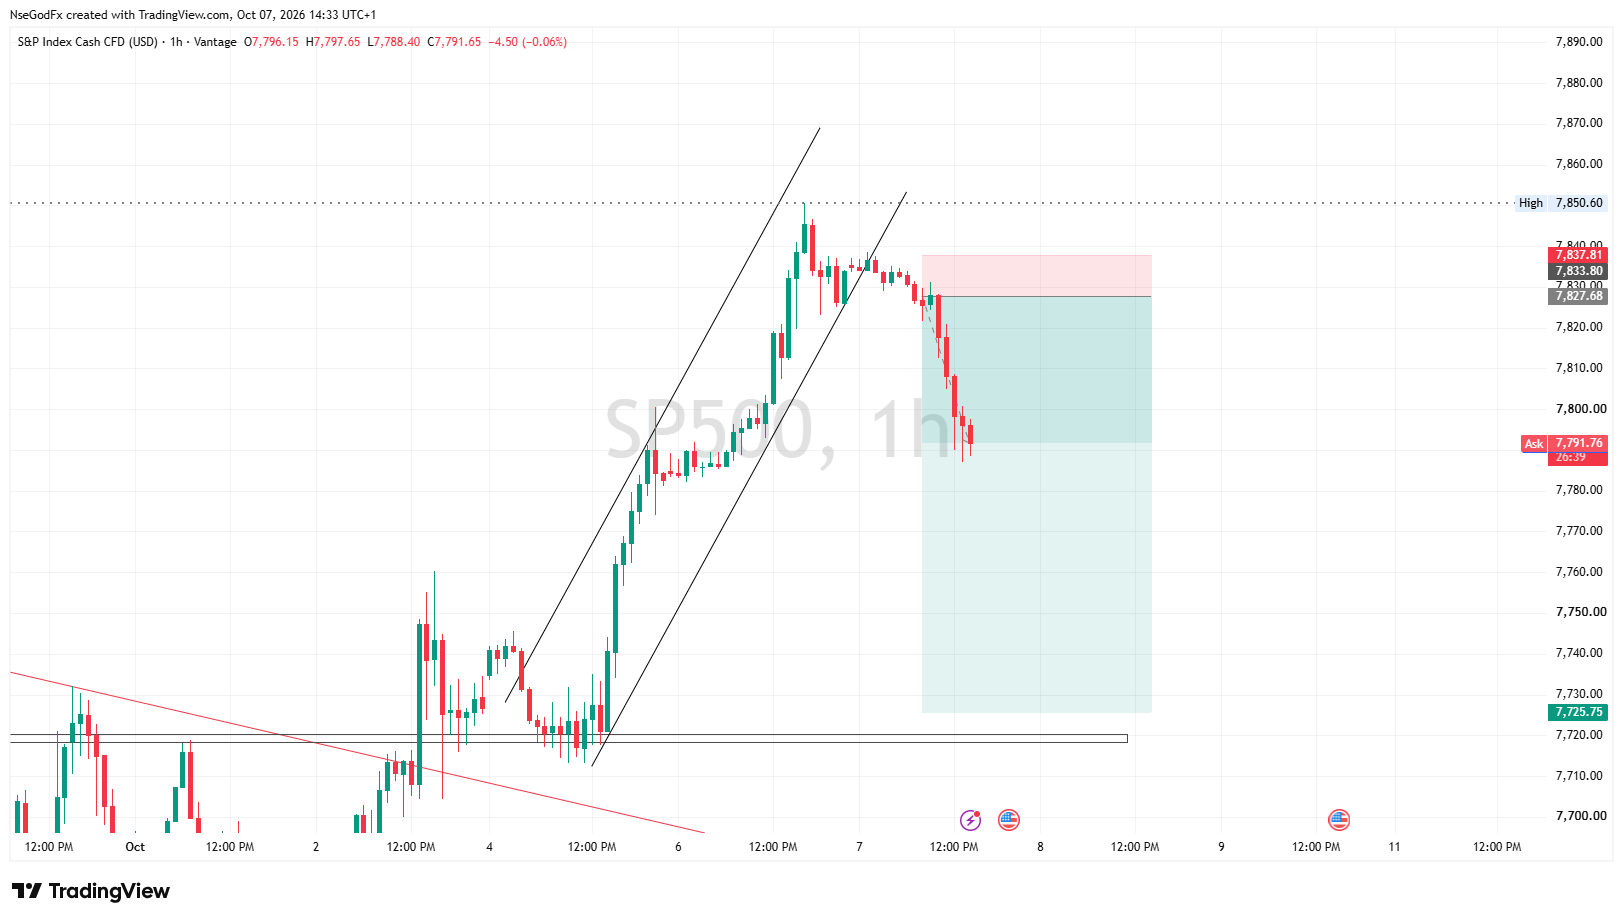
But I'm practicing on Shorting Indices from ATH, which is different because there has never been historic data for reference compared to trading it on currencies.
It's beyond catching a simple pullback but more like timing and catching trend reversals by building a trading strategy that will enable me to keep trading Assets even when they are on All-Time High adventures.
today's shorts from that Entry at 7821 with my Invalidation level at 7841 above ATH, is more effective today, compared to if I tried it yesterday. So, I'm also practicing best days for executions when an Asset is at an ATH.

A
@asuquokelvin - 1 week ago
Quoted - nsg_usd

It's totally fine.
Did you trade SP 500 or US30 today?

No I only took gold trade and currently on audcad buys

N
@nsg_usd - 6 days ago
Quoted - nsg_usd

Yeah. I use it too.
But I'm practicing on Shorting Indices from ATH, which is different because there has never been historic data for reference compared to trading it on currencies.
It's beyond catching a simple pullback but more like timing and catching trend reversals by building a trading strategy that will enable me to keep trading Assets even when they are on All-Time High adventures.
today's shorts from that Entry at 7821 with my Invalidation level at 7841 above ATH, is more effective today, compared to if I tried it yesterday. So, I'm also practicing best days for executions when an Asset is at an ATH.

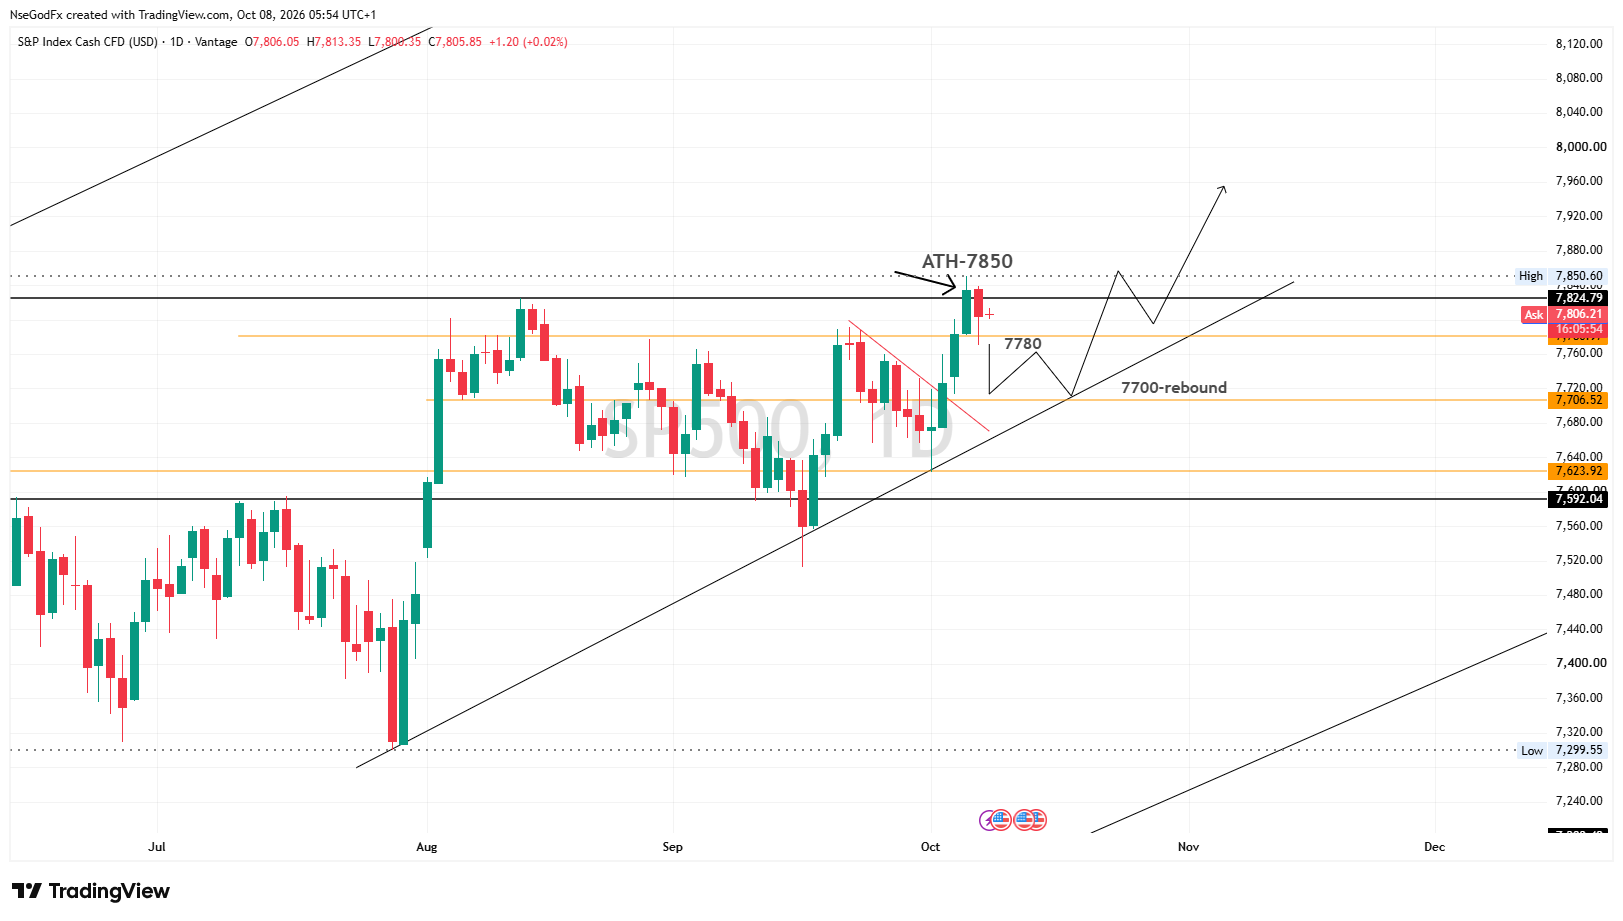
SP 500 Daily Update (Thurs, 8th Oct 2026)
Trend: Bullish
Bias: Bearish
Technical Outlook: Bullish Ascending Triangle
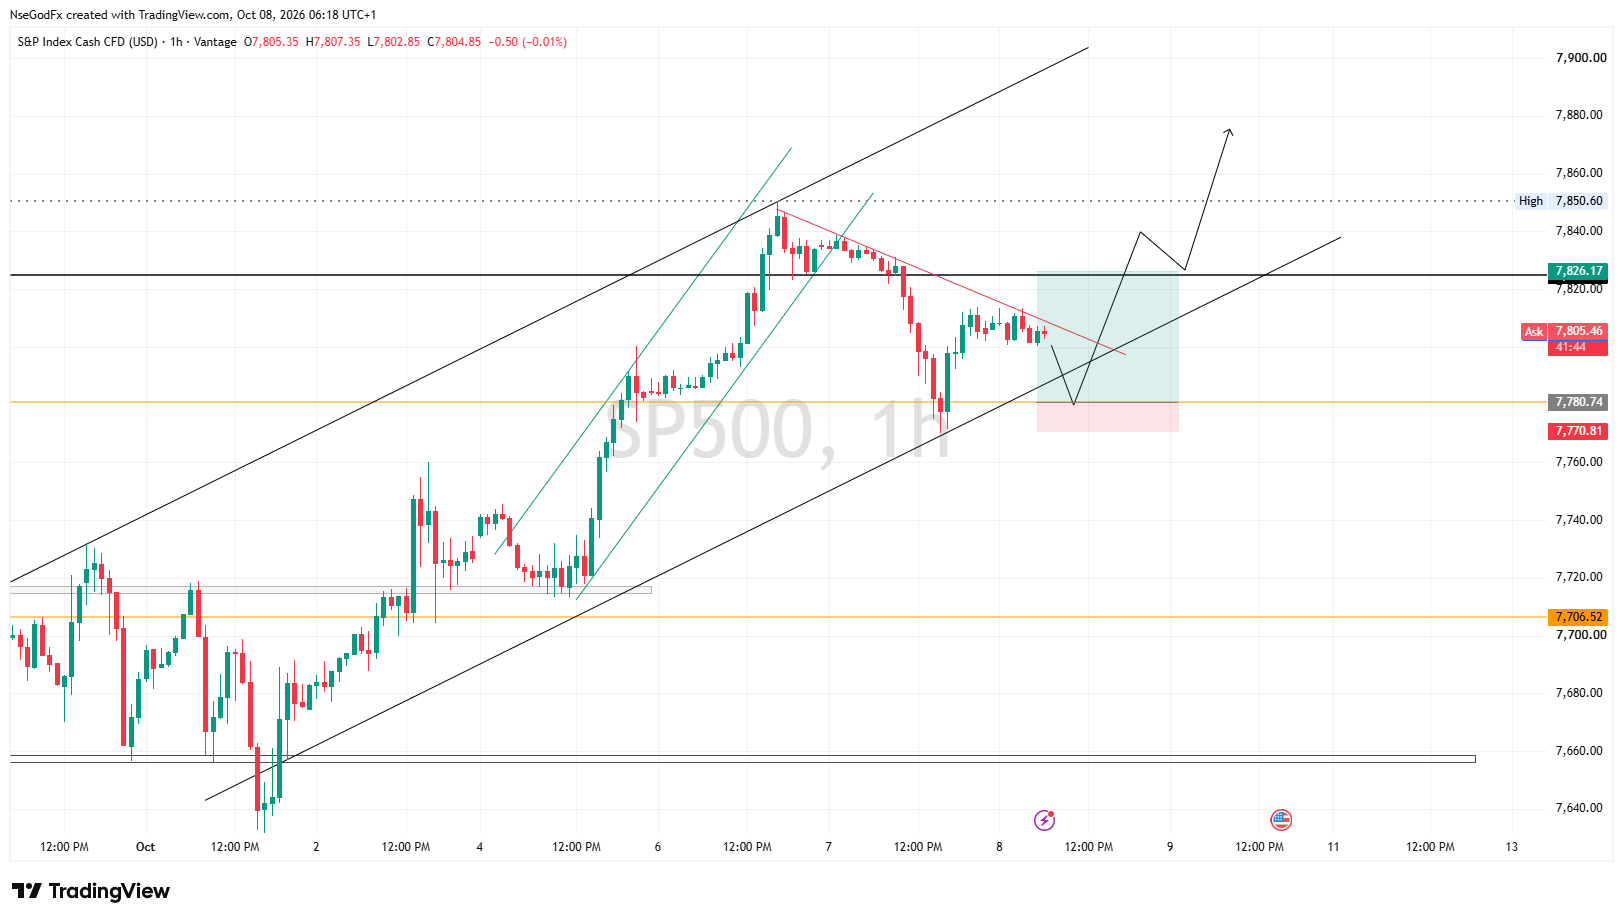
Intraday-Analysis: After setting a New ATH at 7850 on Tuesday, price retraced yesterday down to 7780 changing the intraday direction to a bearish narrative which signals price intentions to start a correction phase.
I'll be positioning for shorts fully once price break below 7780, and my Target will be 7700 which confluences with the trend Support for a price rebound. A break above 7824, will invalidate the bearish intentions seeing price journey into the sky for more ATH adventures.

N
@nsg_usd - 6 days ago
Quoted - nsg_usd

SP 500 Daily Update (Thurs, 8th Oct 2026)
Trend: Bullish
Bias: Bearish
Technical Outlook: Bullish Ascending Triangle
Intraday-Analysis: After setting a New ATH at 7850 on Tuesday, price retraced yesterday down to 7780 changing the intraday direction to a bearish narrative which signals price intentions to start a correction phase.
I'll be positioning for shorts fully once price break below 7780, and my Target will be 7700 which confluences with the trend Support for a price rebound. A break above 7824, will invalidate the bearish intentions seeing price journey into the sky for more ATH adventures.

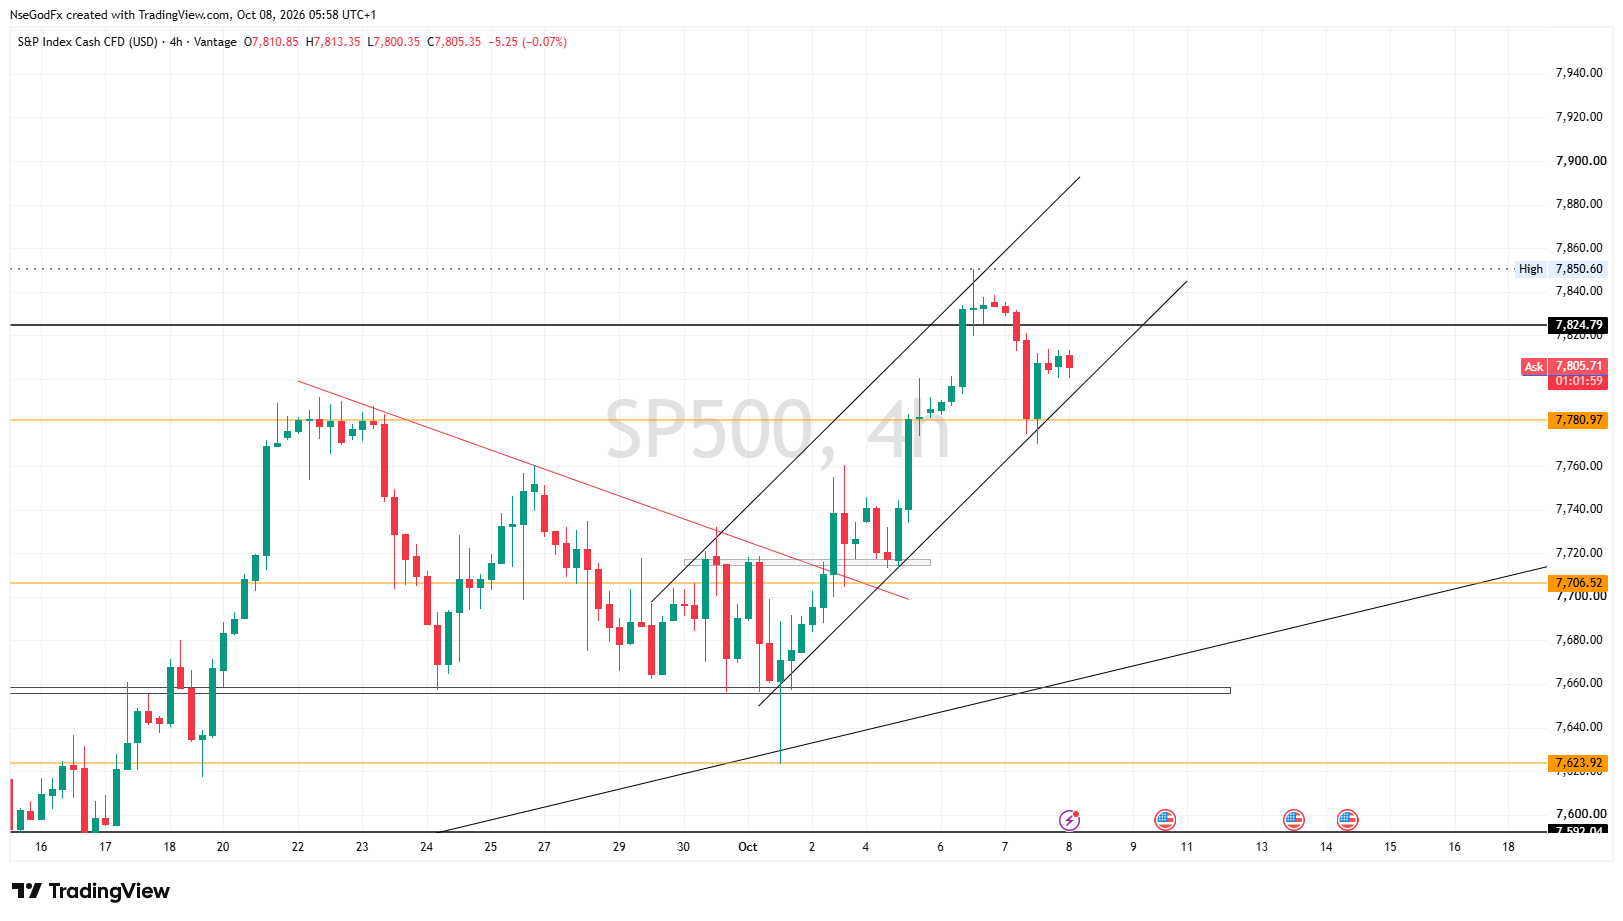
On 4hr, SP 500 has formed an intraday bullish channel which can inspire price to continue its bullish rally today, breaking above the resistance level at 7820-7824 price level.
While price is still confined to this bullish channel, I'll halt my short intentions while watching if price will invalidate the channel or continue higher.
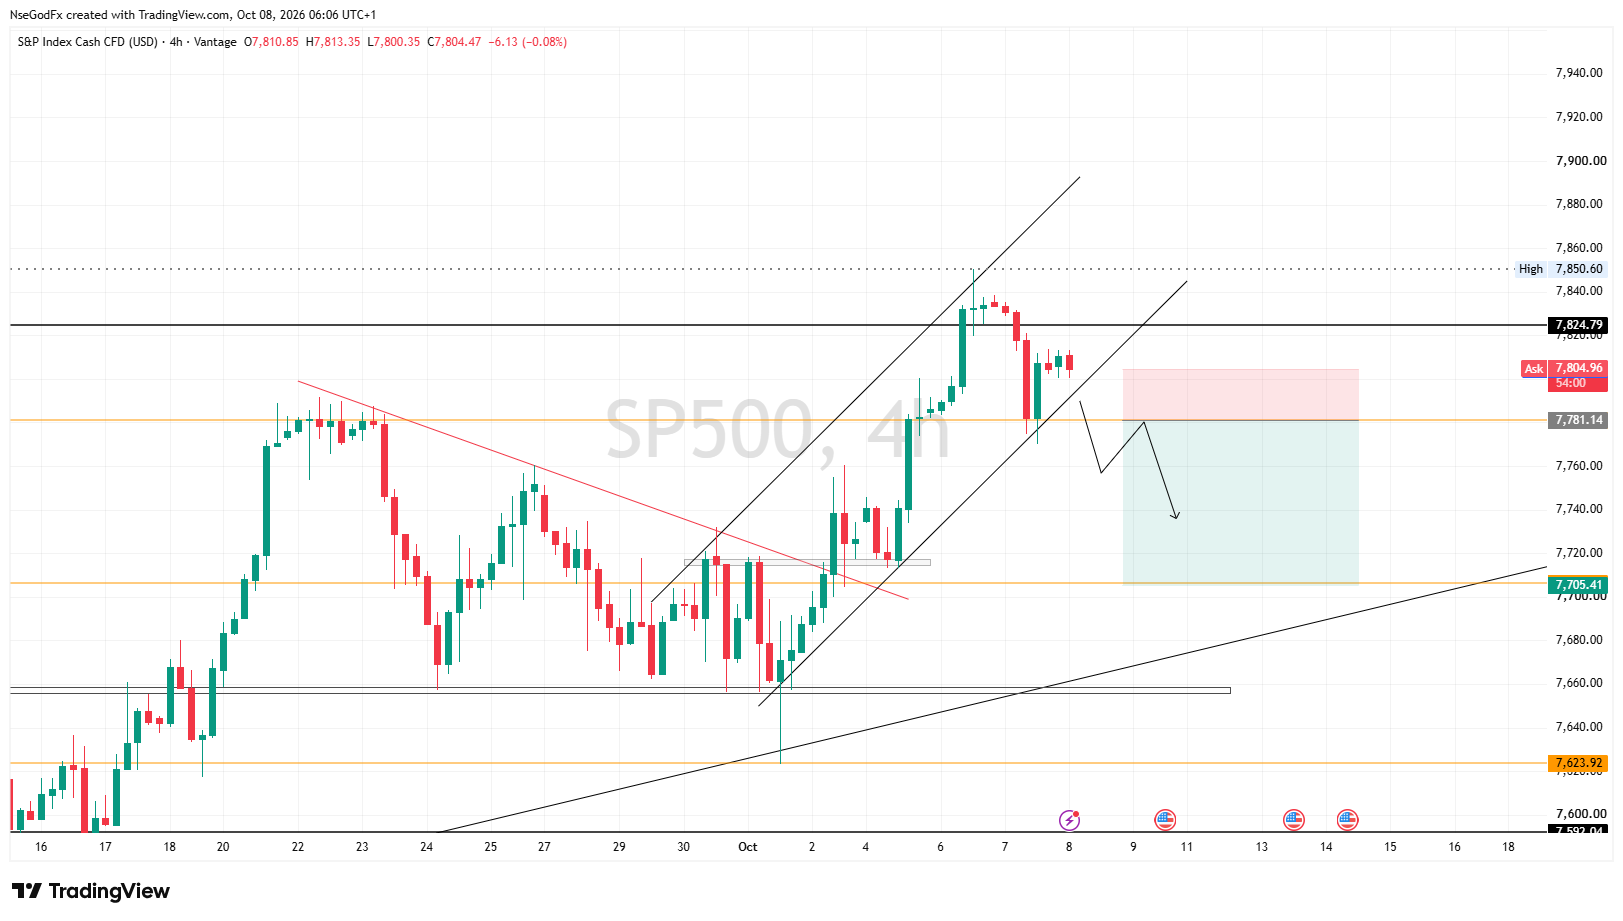
A good short opportunity will present itself if there's a downside break of the 7780 price level, flipping it from a support to resistance.
Entry: 7780
SL: 7803

A
@asuquokelvin - 6 days ago
Quoted - nsg_usd

On 1hr, if price creates a double bottom at the 7780-support level which will confluence with the trend support, I'll position for Long opportunities.
Entry: 7780
SL: 7766.

The confluence at 7780 makes the long idea more meaningful. wait for the double bottom to confirm with bullish rejection; a clean break below 7780 would weaken the setup and put 7766 at risk.

A
@asuquokelvin - 6 days ago
Quoted - obinna

market is choppy

It's better to stay out untill a breakout for a clear direction than forcing price, because you might at the end take losses

N
@nsg_usd - 2 days ago

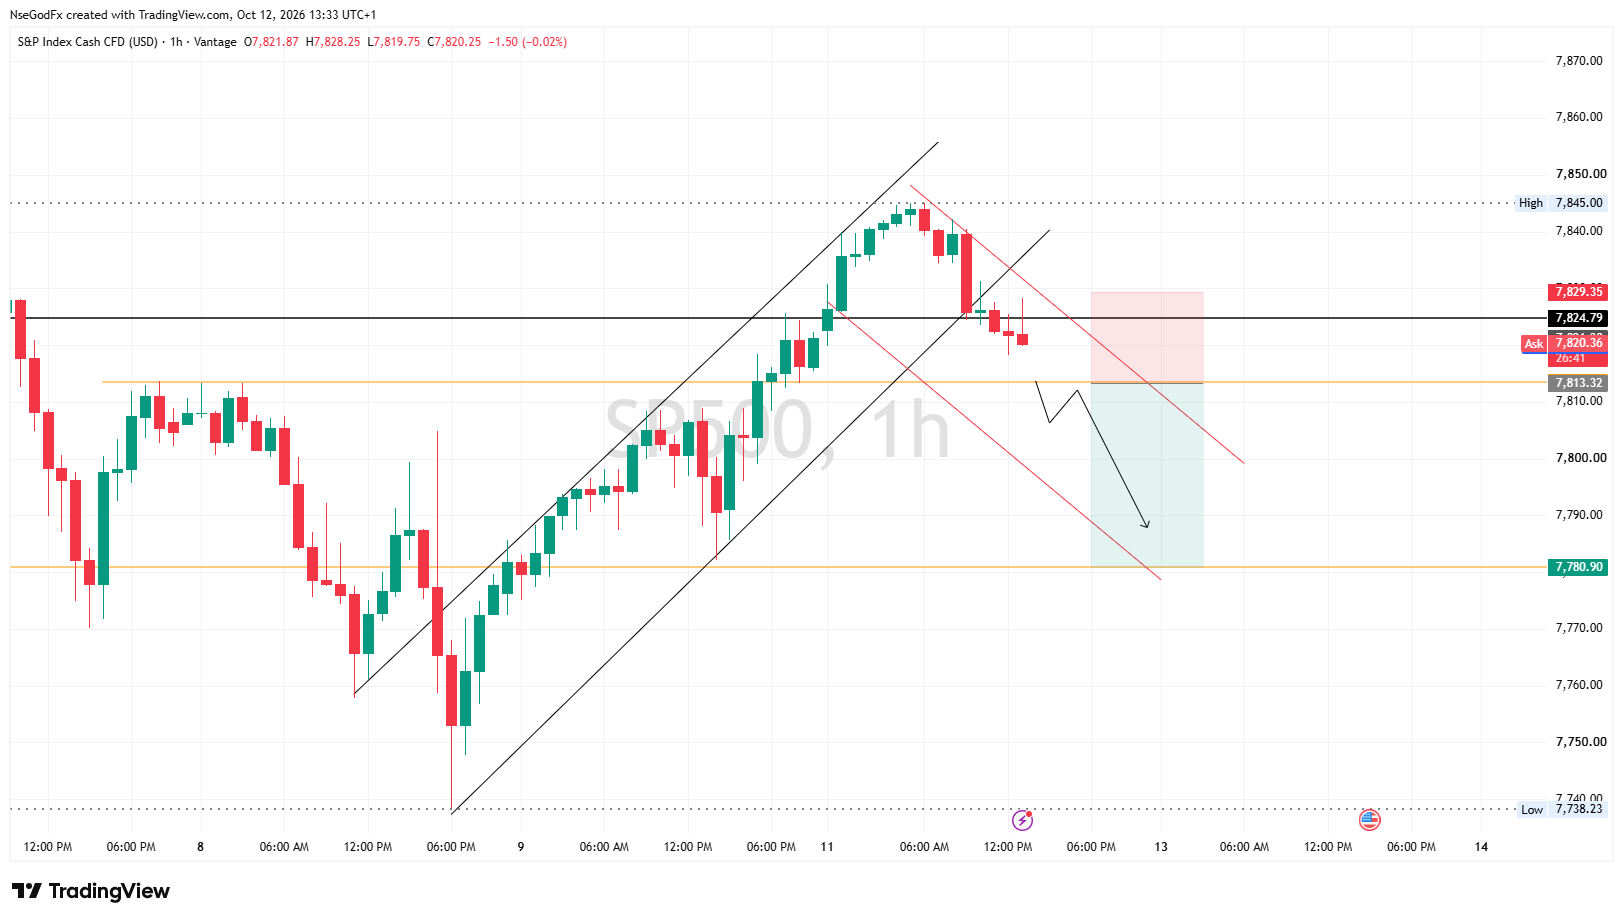
SP 500- Daily Update (Mon, 12th October 2026)
Trend: Bullish
Bias: Neutral
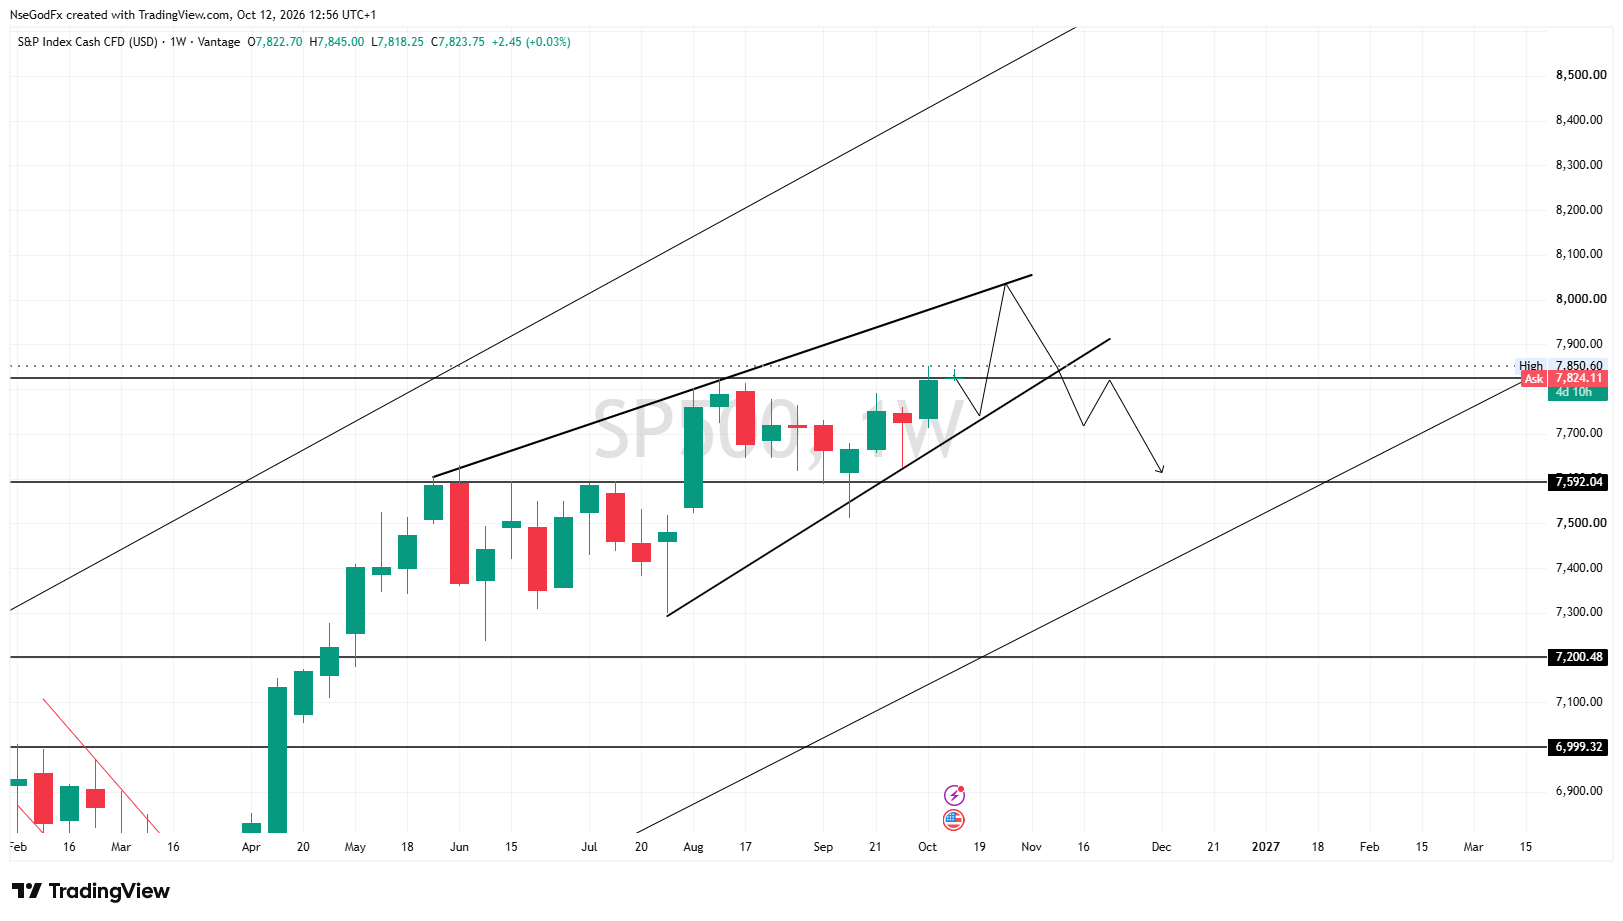
Technical Outlook: Rising Wedge Chart Pattern (Wk)
Intraday-Analysis: On the Weekly, a rising wedge formation has formed, and this often signifies the bears are losing strength. There's also a potential double top formation looming at the weekly key level (7824).
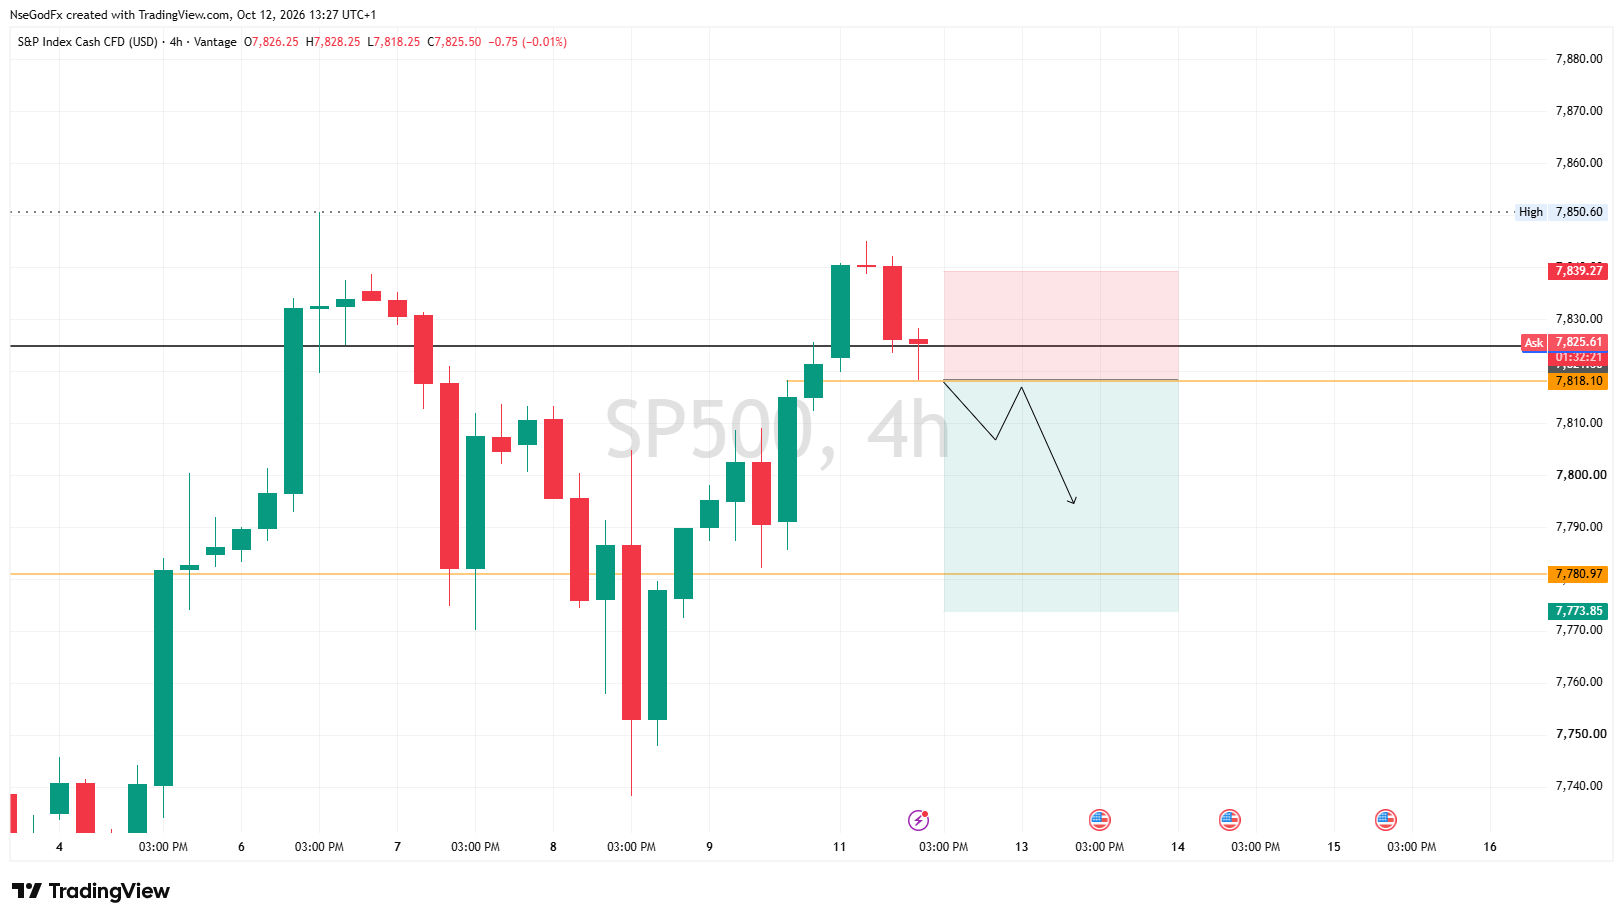
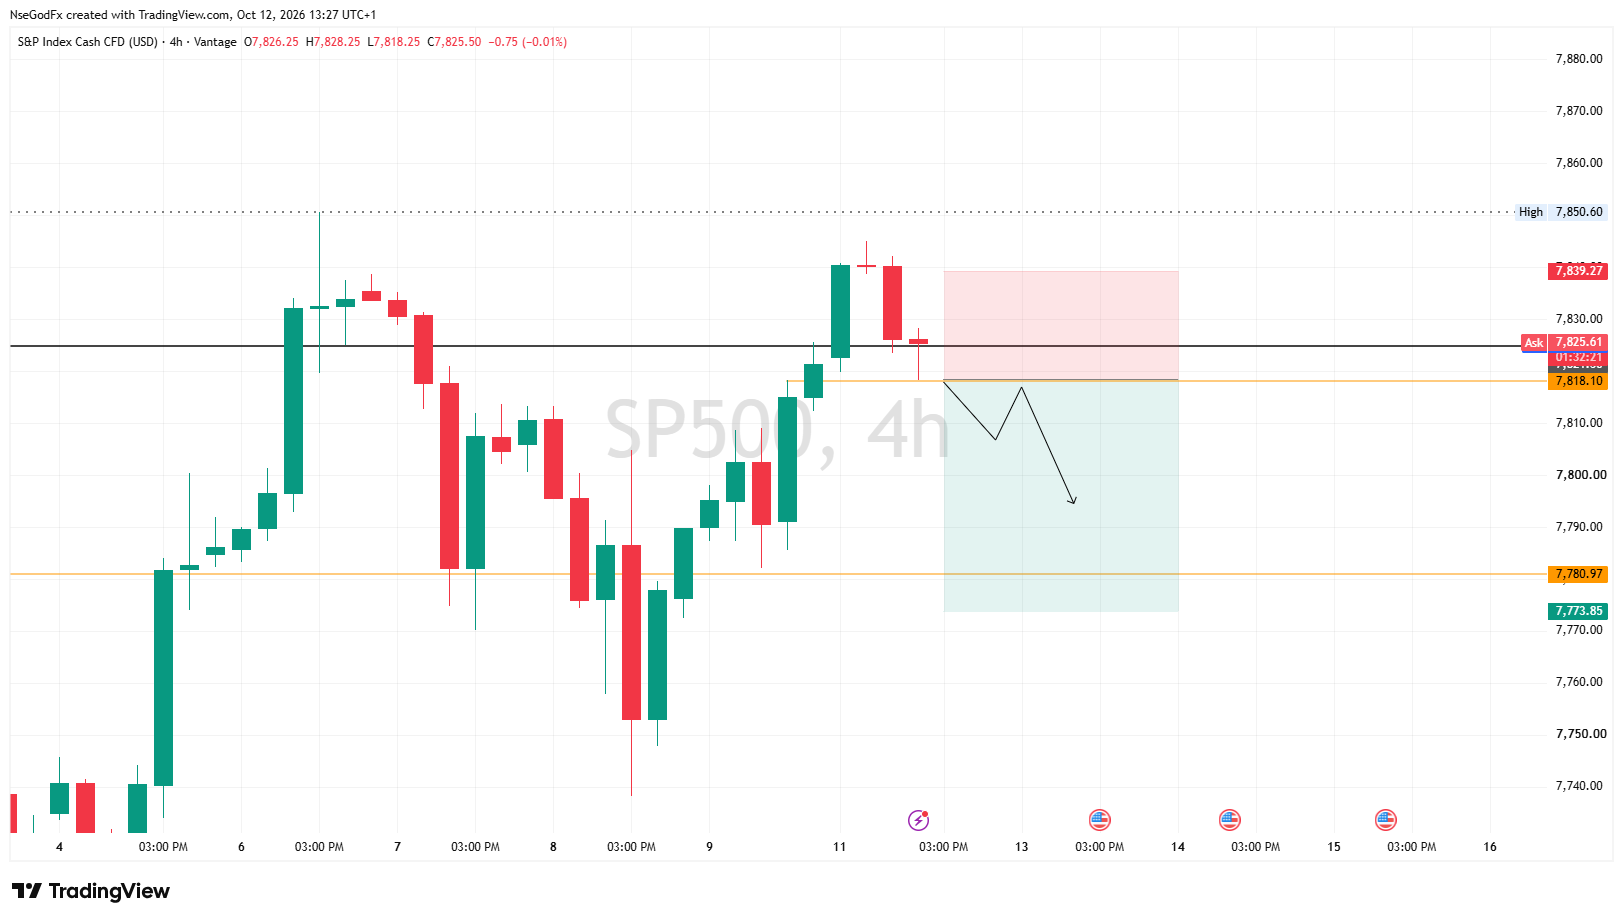
I'll be positioned to go short on the LTF. if the current 4hr closes bearish below the low of the previous candle.
Entry: 7818
SL: 7840

N
@nsg_usd - 2 days ago
Quoted - asuquokelvin

The short idea makes sense around the 7,824 resistance, but confirmation is key. A bearish 4H close below the previous candle’s low would strengthen the setup, while a break above 7,840 invalidates the trade.

Yeah. Although even with the invalidation of the trade setup, I wouldn't be comfortable buying this week. For me, the short probabilities is higher this week than bullish probabilities, so i'll just wait for a break below 7813, then join the sells with my SL above 7829 above the key supply zone.

Disclaimer:

At MyTradingLand.com, we connect you with forex brokers and provide a community for traders. While we offer valuable information and resources, please note that we are not financial advisors and cannot provide personalized financial advice. Always conduct your own research and invest responsibly.

Community Guidelines: The MyTradingLand.com community is designed as a resource for forex traders, promoting respectful and constructive discussions. We reserve the right to remove any content that is misleading, abusive, or violates our terms of service.

Broker Information: While we may receive commissions or advertising income from some of the brokers listed, this does not imply an endorsement of any broker, nor does it affect our review process. Our evaluations are based solely on objective criteria and user feedback.

Always verify the regulatory status of any broker with your local financial authority, along with their terms and privacy policies, before engaging with them. It is crucial to conduct thorough research to ensure that you are making informed decisions.

Risk Warning: At MyTradingLand.com, we strive to provide accurate information; however, the forex market is highly volatile and can change rapidly. It is essential to verify any information before making investment decisions.

Please be aware that trading in forex involves substantial risk, and it is possible to lose more than your trading equity/investment capital. 70-90% of retail CFD traders incur losses in their trading activities as per information from various brokers.

You are solely responsible for your use of MyTradingLand.com and any trading decisions you make. We encourage all users to educate themselves thoroughly about forex trading and to consider seeking advice from qualified financial professionals.

Advertising Disclosure: We may earn commissions from recommended brokers, but our reviews are independent (not influenced by potential earnings). Sponsored content is clearly marked and doesn't reflect our views.

©2026 ©2025 All rights reserved Mytradingland.com