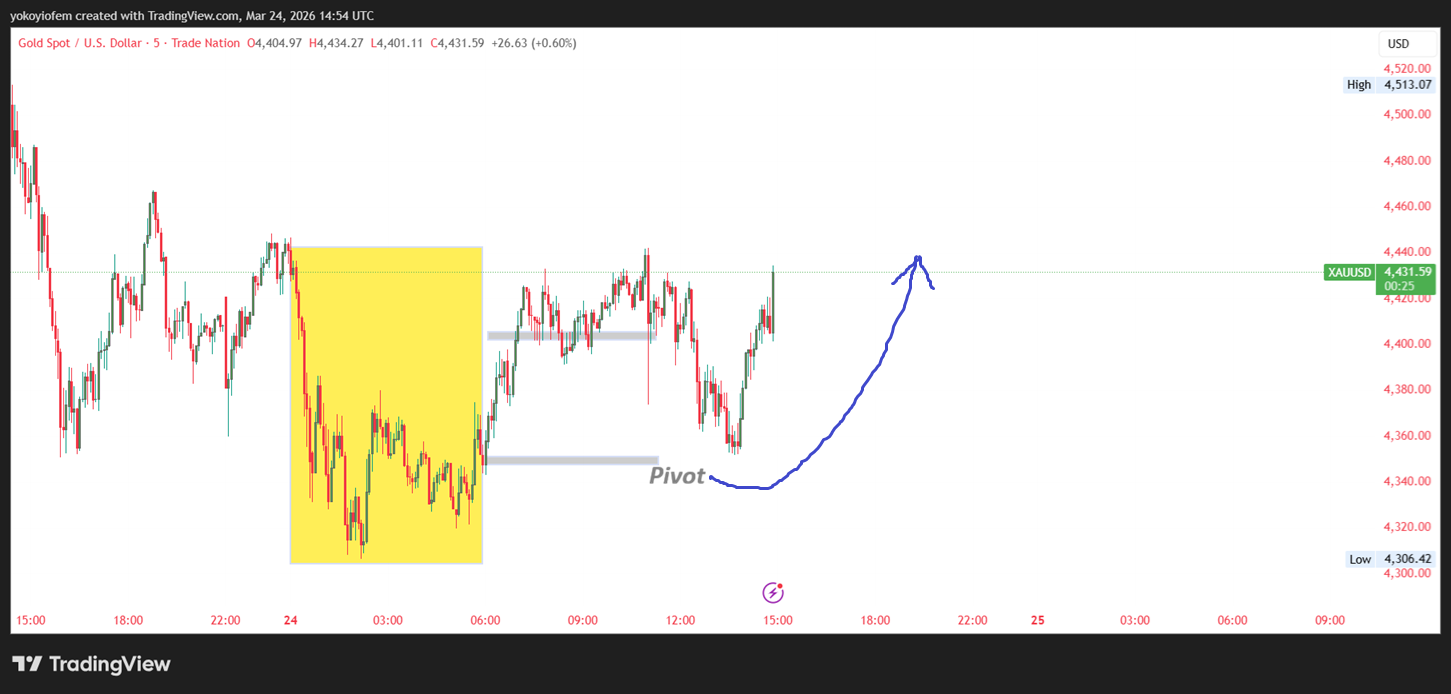
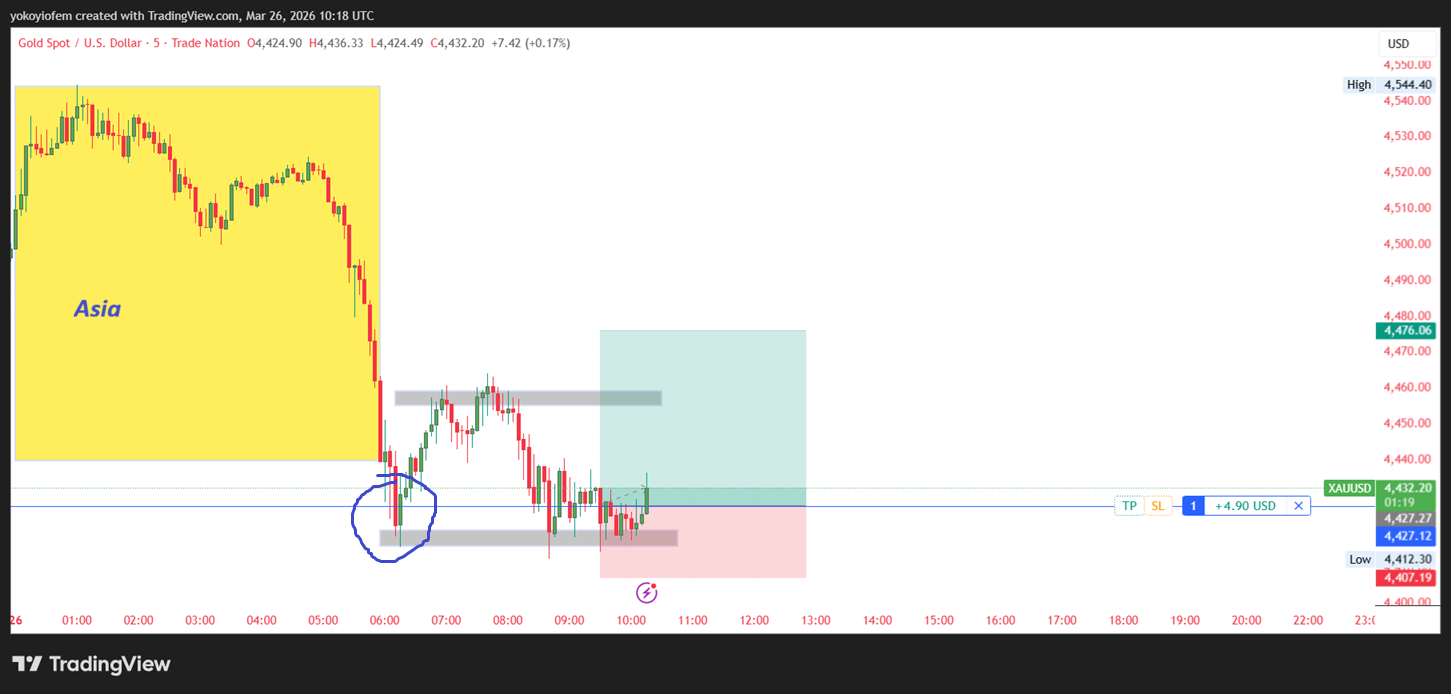
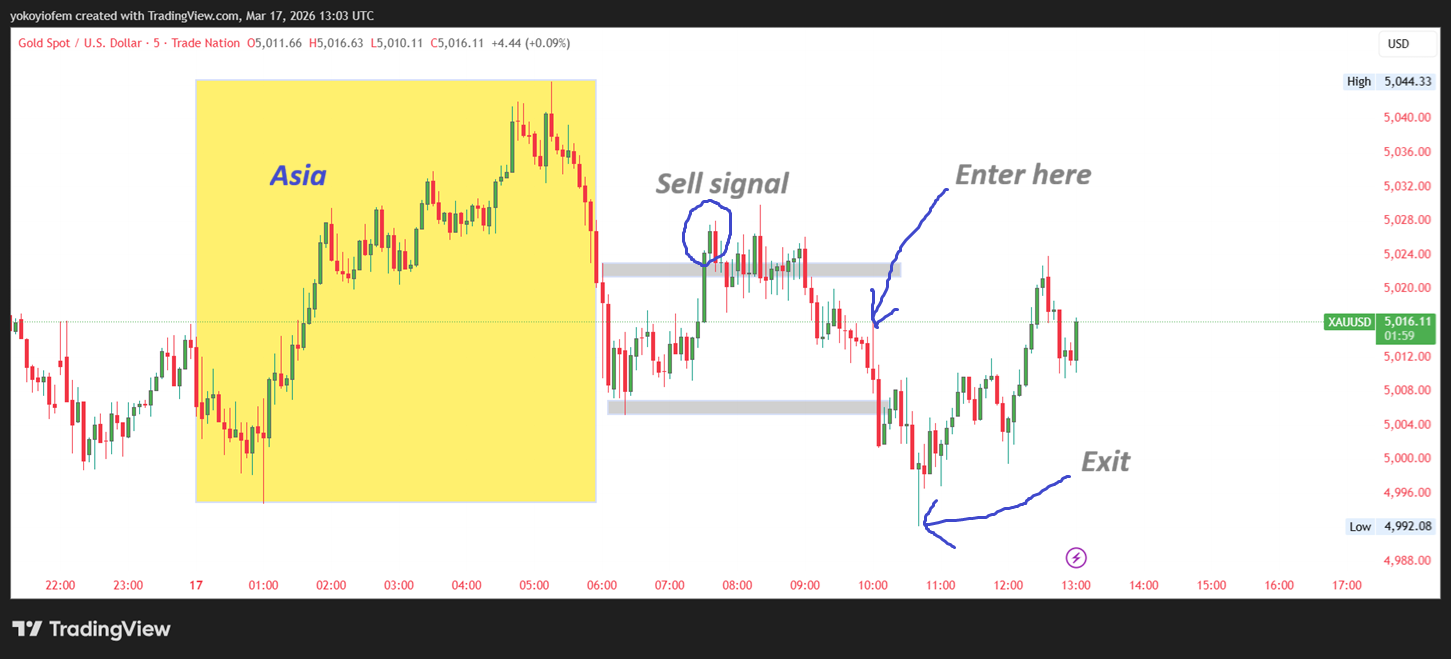
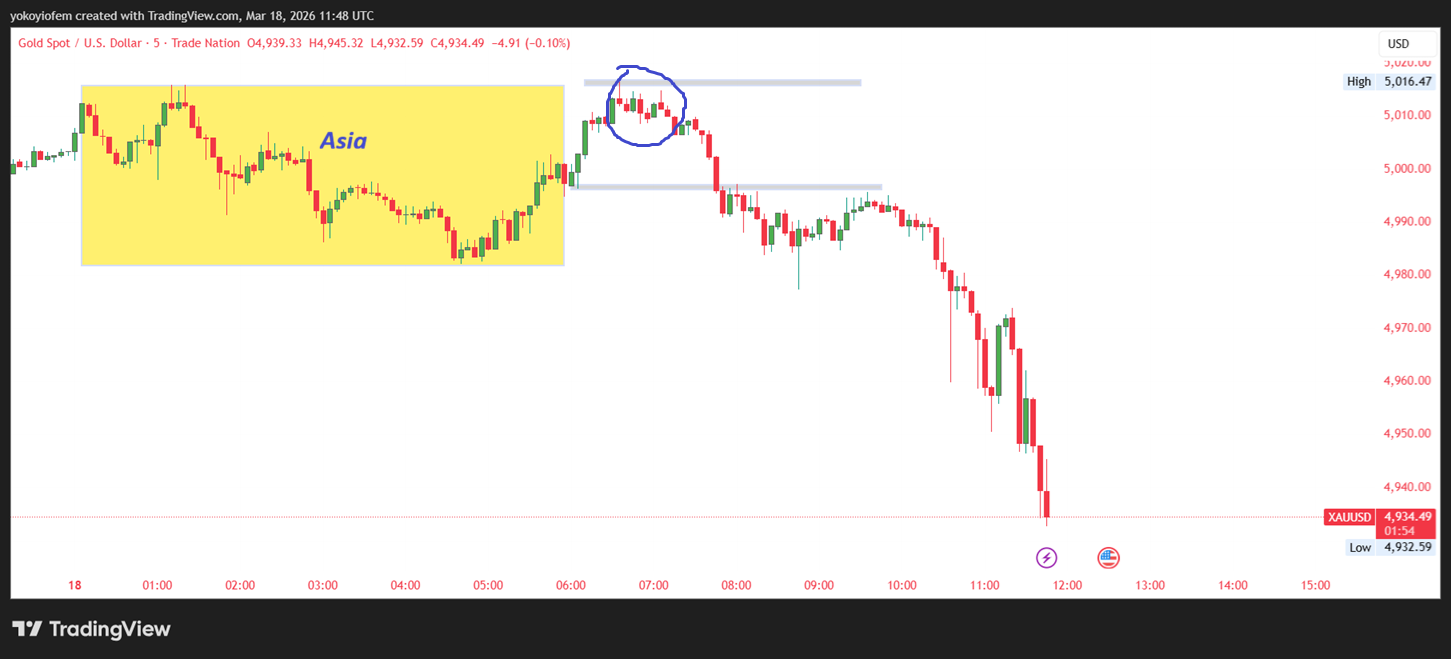
GOLD/USD
TP smashed again, today was a good day. I am done for the day.
Nice mate. Still waiting for my trades to play out. Gonna be a long day🤣
I missed this trade today because I wasnt on my computer, however here is the analysis in hindsight. You see the two grey lines? those mark the high and low of the Frankfurt open hour (6 to 7 am UTC). A bearish engulfing pattern formed outside the franky high (upper grey line) and this was a sell signal. But hold on, i wouldnt jump into the market just yet i would wait for price to fall further and that is why my entry is some pips below. For my exit plan, I would close the trade the moment price broke out of the Asian range (yellow box)
Didnt trade Gold today but in hindsight I would have shorted after price rejected at the Asian high then a bearish engulfing pattern formed.
Gold broke out of the Asian range and I have spotted a buy signal on Gold, so I am not going to jump in immediately I will wait for momentum to buiild in the upward direction.
This buy signal had no follow through and is invalidated because price has closed below it.
I just took a short on gold because price pierced it's head out of the Asian range (upper) and formed a reversal pattern. My SL is above the Asian range
@yoks please what was the cnadlestick pattern that warranted you to short?
The sell trigger was the bearish engulfing pattern (blue circle) that formed after price interacted with the edge of the Asian range (yellow box)
Gold Analysis
I didn't trade gold today because my broker increased the spread suddenly. However, if I was able to trade I would have bought after price exited the pre-franky low and began to reverse back into the Asian range
I just took a short on gold reasons are there's some news about Iran striking Israel and denying US peace talks and also the technicals show price is reversing into the Asian range.
@yoks please explain this trade 2 me again, I want to know how you picked this entry
@kemi the Asian session is from midnight to 6 am so the yellow box has to mark out this time period. To enter the short trade, I looked out for price interaction with the edge of the Asian box. This interaction gave birth to a bearish engulfing pattern which I used as reason to short the market.
Understood, one last question: what about your TP decision how did you make it?
I placed my TP at that 4,351 level because it marks yesterdays daily pivot. To calculate daily pivot just add (yesterday's high + yesterday's low + yesterday's closing price ) and divide by 3
can you shed more light on the daily pivot ?
Lets say you went to the market to get a pair of shoes, you would probably want to know how much those shoes traded for the previous day right? So, with that knowledge you will know how much to offer for to the seller of the shoe. That's kind of how daily pivots work. They give you an idea of how much an instrument traded for on the average the previous day. Price sometimes reverses at daily pivots (but not always) when traders refuse to pay higher/lower than the daily pivot
In my gold trade today I thought of where to take profit then I decided to place my TP at the daily pivot and you can see how price rejected at the pivot and reversed trend.